
ABSTRACT
Antibiotics are commonly used in the Intensive Care Unit (ICU); however, several studies showed that the impact of antibiotics to prevent infection, multi-organ failure, and death in the ICU is less clear than their benefit on course of infection in the absence of organ dysfunction. We characterized here the compositional and metabolic changes of the gut microbiome induced by critical illness and antibiotics in a cohort of 75 individuals in conjunction with 2,180 gut microbiome samples representing 16 different diseases. We revealed an “infection-vulnerable” gut microbiome environment present only in critically ill treated with antibiotics (ICU+). Feeding of Caenorhabditis elegans with Bifidobacterium animalis and Lactobacillus crispatus, species that expanded in ICU+ patients, revealed a significant negative impact of these microbes on host viability and developmental homeostasis. These results suggest that antibiotic administration can dramatically impact essential functional activities in the gut related to immune responses more than critical illness itself, which might explain in part untoward effects of antibiotics in the critically ill.
Introduction
Critical illness leads to the admission of more than 5 million patients per year to intensive care units (ICUs) in the United States alone. Intensive or invasive monitoring of ICU patients accounts for approximately 20% of the total US hospital cost, while the worldwide death rates for critically ill patients are increasing at a higher rate than any other common cause of death Citation1. Almost half of ICU patients show symptoms related to an initial systemic inflammatory response syndrome (SIRS).Citation2 However, besides inflammation, signs of immune exhaustion or ‘paralysis’ might occur simultaneously.Citation3 A disbalance of pro- and anti-inflammatory responses can lead to an increased risk of infection Citation4 and related sepsis, which are responsible for nearly 60% of deaths in ICUs and account for approximately 40% of ICU costs.Citation5
Vincent et al. Citation6 reported that while only 54% of ICU patients had suspected or proven infection, as many as 70% received at least one antibiotic, reflecting a rather “liberal use” within contemporary ICUs. This reflects an early antibiotic treatment – in order to avoid the deleterious impact of a missed or delayed antibiotic therapy if infection triggers organ dysfunction.Citation7 However, several studies showed that the benefits of antibiotics for prevention of infection, multi-organ failure, and death in the ICU are unclear.Citation8 Evidence suggests that approximately 37% of antibiotic treatments are unnecessary or not compliant with guidelines.Citation9 Infections and antibiotics can cause a rapid loss of commensal gastrointestinal microbiota,Citation10 which can result in metabolic and immune disturbances in the critically ill. An important role of gut bacteria is the fermentation of dietary fiber into short-chain fatty acids (SCFAs), which play an important role in preserving gut integrity.Citation11 A decrease in SCFAs concentrations may result in colonization by pathogenic species. For example, several Bacteroides and Bifidobacteria species secrete SCFAs inhibiting pathogen growth.Citation12,Citation13 Similarly, Clostridium scindens and Ruminococcus obeum produce secondary bile acids (BAs) that prevent the growth of Clostridium difficile Citation14 and Vibrio cholerae,Citation15 respectively. Gut bacteria also play an important role in the activation of host immunity against infections, both through innate and adaptive mechanisms.Citation16
With advent of the concept of the human being as a “holobiont” and the perception of the gut microbiome as being highly relevant in the regulation of the immune system, attention to interventions affecting the microbiome is now given also in critical illness. Previous studies have focused predominantly on taxonomic information using 16S rRNA gene sequencing to identify differences between health and disease.Citation17,Citation18
Fungal constituents of the microbiome represent an overlooked but very important kingdom. Research is beginning to show that fungi are critical for maintaining systemic immunity and intestinal homeostasis.Citation19 The mycobiome of skin,Citation20 gut,Citation21 oral cavity,Citation22 and lungs,Citation23 among other anatomical sites, in healthy individuals has been characterized in previous studies. Based on these studies, it seems that between individuals and anatomic sites there is high variability in the human mycobiome diversity,Citation24 which is consistent with what we know from the Human Microbiome Project (HMP, 2012) for the bacterial microbiome. Most of the anatomic sites in humans are dominated by members of the Basidiomycota phylum, such as Cryptococcus spp., Malassezia spp. and Filobasidium spp., and the Ascomycota phylum including Saccharomyces cerevisiae, Candida spp., and Cladosporium spp.Citation25,Citation26 Despite the recent findings showcasing the fungal role on host health, host–microbe and microbe–microbe interactions, only less than 0.5% of the published microbiome papers investigate or refer to the fungal population.Citation19 The mycobiota is increasingly recognized as a critical player in the development of human diseases, including inflammatory bowel disease, allergic airway diseases, skin disease, alcoholic liver disease, autoimmunity, neurological disorders, and metabolic syndrome.Citation27–30 In relation to microbe–microbe interactions, existing studies indicate that a competitive association between bacteria and fungi exists in the human gut. This was shown in antibiotic-treated subjects and germ-free mice, where an overgrowth of particular fungi in the gut and/or susceptibility to fungal infection was observed.Citation31 In addition, overgrowth of fungi due to antibiotics treatment has been associated with the development of allergic airway responses to Aspergillus fumigatus mold spores.Citation32 Part of the chemical warfare between bacteria and fungi is also the secretion of antifungal peptides from epithelial cells, which can be induced by commensal bacteria such as Blautia producta and Bacteroides thetaiotaomicron.Citation33 Previous research related to critically ill patients and mycobiome is very limited.Citation34–39 One recent study characterized the mycobiome of the lower respiratory tract of patients in ICU showing that Candida spp. dominated the fungal community in both with and without antibiotic therapy patient groups.Citation34 Another prospective pilot study showed an increase of C. albicans in the oral mycobiome after an admission to the ICU.Citation38 However, systematic investigation of the interactions between the gut mycobiome of critically ill patients and the bacteria functional activity is currently lacking.
Here, by a comprehensive characterization of the microbiome, mycobiome, and functional potential of the gut community and individual species, we demonstrate that even though antibiotics do not significantly disturb the bacterial and fungal composition of critically ill patients, as observed in healthy individuals,Citation40 they cause abundance changes in a handful of species that are highly connected with the production of SCFAs and BAs, allowing the expansion of pathogenic species.
Results
Highly distinct microbiome in ICU patients
To investigate the gut microbiome composition of critically ill patients, we initially included 70 critically ill patients. Of these, 54 were diagnosed with probable or microbiologically confirmed infection as defined by Calandra et al. Citation41 (respiratory tract (n = 37), abdominal (n = 6), bones/soft tissue (n = 3), chest (n = 2), catheter associated (n = 1), urogenital (n = 1), and unknown (n = 4)). These 54 received antibiotic treatment, whereas 16 did not presented an infection and did not receive antibiotic treatment. Of those, we collected stool samples from 49 patients receiving antibiotic treatment (broad spectrum beta-lactam antibiotics; n = 19 meropenem and n = 30 piperacillin/tazobactam) and 14 patients without antibiotic treatment, as well as from 12 healthy human volunteers. Basic anthropometric and clinical characteristics of the participants are displayed in Supplementary File 1. There were no significant differences between the two ICU groups in gender, age, BMI, type of admission or surgery and length of ICU or hospital stay (continuous data were compared by the Student’s t-test, dichotomous variables by the chi-squared test, a p-value < 0.05 was considered significant). Similarly, there were no significant differences between the healthy volunteers and ICU patients in the basic demographic characteristics.
We assessed the structure of the gut microbiome via shotgun metagenomics generating 39 million high-quality reads per sample on average (Supplementary Table 1). We used MetaPhlan2 Citation42 for taxonomic profiling, and we identified 428 species in total. Alpha-diversity measured as Shannon, Simpson, and Chao1 index dropped significantly in both antibiotics treated (ICU+) (Wilcoxon rank-sum test, P = 8.6e-6, P = 5.3e-6, P = 3.8e-5, Shannon, Simpson and Chao1 indices, respectively) and untreated subjects (ICU–) (Wilcoxon rank-sum test, P = .0037, P = .0025, P = .0054, Shannon, Simpson and Chao1 indices, respectively) compared to healthy individuals ()). In contrast to what has been observed in healthy volunteers,Citation44,Citation45 antibiotics administration had no significant impact on the alpha diversity when comparing the ICU+ against the ICU– patients (Wilcoxon rank-sum test, P = .79, P = .79, P = .64, Shannon, Simpson and Chao1 indices, respectively). The type of beta-lactam used had no significant impact either (Supplementary Figure 1).
Figure 1. Distinct gut microbiota signatures in ICU patients
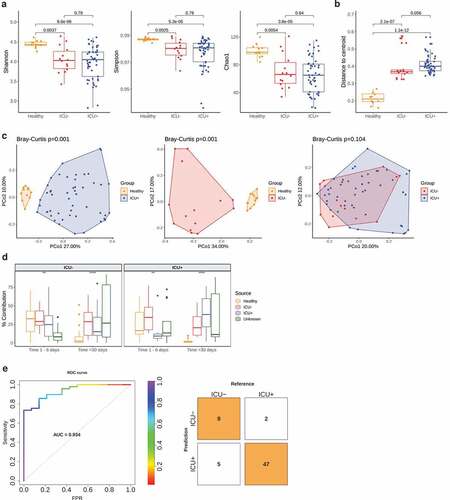
We subsequently investigated the variation in the microbiome structure of the three groups by calculating the distance to centroid ()). The gut microbiome of the ICU+ group had significantly higher structural variation compared to both healthy individuals (Wilcoxon rank-sum test, P = 1.1e-12) and the ICU– group even though it did not reach statistical significance (Wilcoxon rank-sum test, P = .056). Next, we calculated the beta-diversity (Bray–Curtis distance) of the three groups, which showed that although there was a high community dissimilarity between ICU+ and Healthy (PERMANOVA, P = .001) and between ICU– and Healthy (PERMANOVA, P = .001), the ICU+ and ICU– groups did not show significant differences (PERMANOVA, P = .104) (), Supplementary Figure 9(a)). Similarly, to alpha diversity, when we examined the two beta-lactam groups (meropenem and piperacillin/tazobactam) separately, we did not observe any significant difference (Supplementary Figure 1, Supplementary Figure 9(b)). To further evaluate our findings, we repeated the taxonomic analysis using the Metagenomic Species method (MGS) Citation46 and we observed the same patterns as above (Supplementary Figure 2, Supplementary Figure 9(c)).
As evident from both, the alpha- and beta-diversity comparisons, the similarities in the structure of the gut microbiome of the ICU+ compared to the ICU– group triggered our interest to examine our cohort in relation to another, small publicly available dataset of critically ill patients.Citation10 In that study, the authors performed a longitudinal sampling of critically ill patients with and without antibiotics administration to study abundance changes in the resistome profile of known pathogens. For the comparative analysis, we applied a microbial source tracking algorithm, namely FEAST.Citation43 When using our cohort as a sink we noticed how progressively the public ICU+ group becomes more taxonomically similar with our ICU+ group, as well as the compositional similarities between the two ICU– groups ()). From the methodological point of view, this analysis confirms that FEAST Citation43 is a relatively sensitive method but also that despite the non-significant overall differences between ICU+ and ICU– groups there is still a characteristic microbiome signature due to the antibiotic administration. Considering the relatively small differences between the ICU+ and ICU– groups, we next investigated whether these subtle differences in microbial signatures could be integrated into an algorithm to correctly classify the patients. To this end, a random forest classifier integrating species and pathways was developed and achieved an area under the receiver operating characteristic (ROC) curve (AUC) of 0.934 ()) using 20 features (Supplementary Figure 3). Enterococcus faecalis, a known pathogenCitation48 whose abundance has been associated to an increase in susceptibility to V. cholerae infection,Citation15 and several amino acid pathways that can serve as precursors for the synthesis of short-chain fatty acids (SCFAs) were among the selected features.
Critically ill patients treated with antibiotics show an “infection-vulnerable” gut microbiome
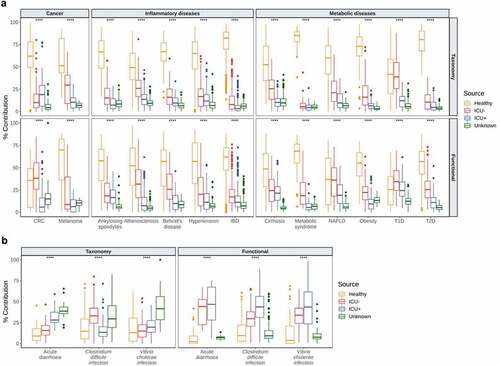
We subsequently used HUMAnN2 Citation49 for functional profiling of the microbial communities and identified 483 pathways in total. To further evaluate the community taxonomic and functional characteristics of the critically ill patients, we compared our cohort with a panel of publicly available datasets. For that, we retrieved 2,180 taxonomically and functionally annotated samples from 16 human diseases using the curatedMetagenomicData Citation50 package in R and we applied FEAST,Citation43 treating our samples as sources and the disease panel as sinks. In these settings, FEAST Citation43 revealed that there is a significantly lower similarity (Kruskal–Wallis, P < .0001) between the microbiome structure and function of individuals in the critically ill patients group with patients with cancer (colorectal cancer,Citation51–56 melanomaCitation57,Citation58), inflammatory (ankylosing spondylitis,Citation59 atherosclerosis,Citation60 Behcet’s disease,Citation61 hypertension,Citation62 inflammatory bowel diseaseCitation46), and metabolic diseases (cirrhosis,Citation63 metabolic syndrome,Citation64 nonalcoholic fatty-liver disease,Citation65 obesity,Citation66,Citation67 Type-1-Diabetes,Citation68,Citation69 Type-2-DiabetesCitation70,Citation71) compared to Healthy individuals ()). Due to this unexpected association, we expanded the range of diseases as sinks using infectious diseases and specifically 66 samples from patients with acute diarrhea,Citation72 C. difficile infectionCitation73 and V. cholerae infection.Citation74 In contrast to what we observed with noninfectious diseases, the taxonomic composition of the critically ill patients is significantly more similar (Kruskal–Wallis, P < .0001) to infectious diseases than the gut composition of healthy individuals ()). At the functional level, this difference is even more profound with the ICU+ group having the highest similarity (Kruskal–Wallis, P < .0001) with all three infectious diseases, suggesting that critically ill patients may be at a risk of severe infections by gut pathogens and that antibiotic treatment increases significantly that risk.
Figure 2. Comparative analysis of the microbiome of critically ill patients with other diseases
Immunomodulatory metabolites and their microbial producers are depleted from critically ill patients exposed to antibiotics
We subsequently focused on the impact of antibiotic administration in the ICU in relation to abundance changes in microbes with a potential role in immune regulation and host-immune homeostasis. Significant differences were observed at the phylum level among the three groups. The Healthy group had, on average, higher abundance of Bacteroidetes (17.9%, Kruskal–Wallis, P = .0063), Actinobacteria (9.9%, Kruskal–Wallis, P = .035), and Verrucomicrobia (4.7%, Kruskal–Wallis, P = .0098) (Supplementary Figure 4(a)). At the genus level, a striking difference in the abundance of Enterococcus was found, with the ICU+ group having the highest abundance compared to the other two groups (Kruskal–Wallis, P = 3.6e-6). In contrast, the relative abundance of Blautia was significantly higher in ICU– (Kruskal–Wallis, P = .029) (Supplementary Figure 4(a)).
At the species level, we found 106 and 80 species significantly differentially abundant (Wilcoxon rank-sum test, P < .05) between the Healthy and ICU+ and Healthy and ICU– groups, respectively. The species enriched in the Healthy group include known SCFAs and BAs producers, such as Ruminococcus bromii,Citation76 Faecalibacterium prausnitzii,Citation77 Eubacterium eligens,Citation78 Eubacterium hallii Citation78 and Eubacterium rectale,Citation77,Citation78 among others () and Supplementary Figure 4(b)). On the contrary, species enriched in ICU+ and ICU– included known pathogens such as Klebsiella pneumoniae,Citation79 Klebsiella oxytoca,Citation79 E. faecalis,Citation48 and Enterococcus faecium Citation48 () and Supplementary Figure 4(b)). Comparing ICU+ and ICU– groups, we found 12 species significantly differentially abundant (8 enriched in ICU– and 4 in the ICU+). R. gnavus, Clostridium symbiosum, and Veillonella parvula, known SCFAs and BAs producers,Citation80–83 were enriched in ICU–, whereas from the species enriched in ICU+ ()) Bifidobacterium animalis has been indicated as a SCFAs producer.Citation84 Since B. animalis was the only SCFA producer enriched in ICU+, we retrieved the genome-scale metabolic model of B. animalis from the AGORA repository Citation85 and we simulated growth on an ICU media using flux balance analysis. We monitored the potential of B. animalis to produce SCFAs, including acetate, propionate, and butyrate; however, none of these compounds was predicted to be produced in our in silico simulations (data not shown).
Figure 3. Differential abundance analysis reveals changes in bacteria with important functional properties in critically ill
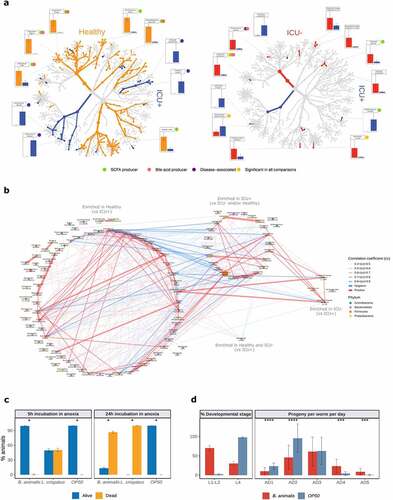
We used the enriched species to reconstruct the species co-abundance network using all samples from our cohort. We observed a much more intense within group communication between the Healthy-enriched species (vs. ICU+) with 162 positive and 19 negative correlations (absolute correlation coefficient >0.4) compared to the species enriched in ICU+ (vs Healthy and/or ICU–) that showed 43 positive and no negative correlations () and Supplementary Table 2). Alistipes putredinis, F. prausnitzii, and Bacteroides uniformis were interconnected healthy-enriched species showing negative correlations with Klebsiella and Staphylococcus species, common sources of serious infections in ICU.Citation86 From the species enriched in ICU+ compared to Healthy, E. faecium, Staphylococcus epidermidis, and Lactobacillus rhamnosus showed the highest number of correlations, suggesting that these may be important species to maintain the community structure. From the species enriched in ICU+ compared to ICU–, Lactobacillus crispatus showed positive correlations with known pathogens such as Enterococcus and Klebsiella species, as well as negative correlations with Healthy-enriched SCFAs and BAs producers including F. prausnitzii, E. rectale, and A. shahii.
To examine in vivo host effects of the species enriched in ICU+ patients compared to ICU–, we utilized nematode C. elegans as a model host. C. elegans recently emerged as a suitable simple model for discovering conserved host–microbiome interactions.Citation87 The experiments were conducted by reconstituting germ free L1 nematodes with the two, sufficiently annotated, bacterial strains enriched in ICU+ (B. animalis and L. crispatus). We found that both strains had a strong negative impact on the host homeostasis: L. crispatus exerted direct toxicity in the model host ()), and B. animalis instigated a delay in the C. elegans development indicative of the physiological stress ()). By including heat-killed bacteria as an additional control and performing OD normalization across conditions, we found that host toxicity of L. crispatus requires live bacteria, while B. animalis rather acts as a passive stressor (Supplementary Figure 5). Interestingly, the nematodes, which overcame the developmental hindrance by B. animalis, displayed a delay in reproductive aging ()) consistent with the putative probiotic effect of B. animalis in the animals that were able to conquer the initial stress caused by this bacterium. To probe the potential probiotic effect of B. animalis at the mechanistic level, we tested its ability to induce nuclear translocation of DAF-16/FOXO transcription factor – a conserved mediator of stress resistance and longevity extension.Citation90–92 We found that live B. animalis indeed had the strongest capacity to induce DAF-16 activation among all conditions tested (Supplementary Figure 6). Our results are thus in line with the previously reported ability of B. animalis to cause disease in immunocompromised human patients, while it acts as a probiotic in healthy humans,Citation93 demonstrating the physiological relevance of our nematode findings. Collectively, our in vivo tests indicate that the rarefication of the microbiome, which is exacerbated by antibiotics exposure in ICU+ patients, facilitates the enrichment of microbes with potential of exerting direct detrimental effects on the host.
Functional shifts in the microbiome
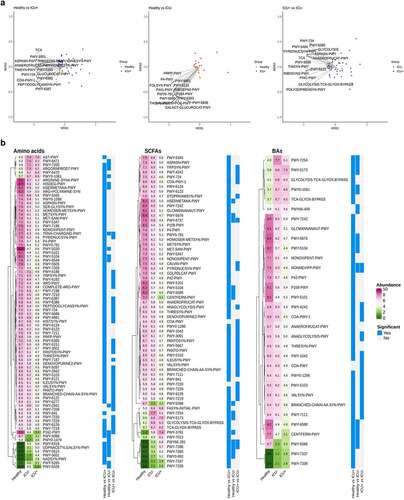
Next, we compared MetaCyc pathway abundance to explore the gut microbiome functionality in the three groups. As shown in the ordination plot ()), the differences between ICU+ compared to the other 2 groups at the functional level are driven by SCFA biosynthesis, AA biosynthesis, and fermentation to SCFA, whereas the abundance of pathways related to nucleotide and nucleoside degradation and vitamin biosynthesis are the main drivers in the comparison of Healthy vs ICU–. Therefore, we then focused on AAs, SCFAs, and BAs due to their important role in the regulation of the immune system and their influence in diseases associated with dysbiosis.Citation11 In total, we identified 117 significantly differentially abundant pathways related to the metabolism of AAs, SCFAs, and BAs (Wilcoxon rank-sum test, P < .05). Even though the majority of these pathways had a higher relative abundance in the Healthy compared with ICU– group, only a few pathways reached statistical significance. On the contrary, the differences in the relative abundances between the ICU+ with the Healthy group were striking ()). The relative abundance of 98 of the 117 unique pathways was significantly lower in ICU+. Despite the small number of significantly differentially abundant species between ICU+ and ICU–, there were more differences in the metabolic pathways between the two groups than between Healthy and ICU–, suggesting that antibiotic treatment has a stronger effect in the metabolism of AAs, SCFAs, and BAs than critical illness. Several of these pathways were selected in the random forest model to classify the two groups of ICU patients () and Supplementary Figure 3).
Figure 4. Functional shifts contributed by the microbiome
Metabolomics analysis
We then performed targeted metabolomic analysis and quantified the levels of 10 SCFAs and 27 BAs in 38 stool samples (see Methods). Consistently with the results from the MetaCyc pathway analysis, we observed a significant decrease in the abundance of SCFAs and BAs in the ICU+ group compared to the Healthy and ICU– groups ()). Of 10 identified SCFAs, 6 were significantly different between the groups ()). Acetic acid, propionic acid, butyric acid, and valeric acid were significantly lower in the ICU+ group compared to both the Healthy and ICU– groups (Wilcoxon rank-sum test, P < .05). The levels of these SCFAs were not found to differ significantly between the ICU– and Healthy groups. A similar pattern was observed with the BAs; ketolithocholic acid, deoxycholic acid, glycolithocholic acid, hyodeoxycholic acid, isolithocholic acid, lithocholic acid, and ursodeoxycholic acid were all found significantly lower in abundance in ICU+ patients (Wilcoxon rank-sum test, P < .05) compared to both Healthy and ICU– patients ()). Among them, ursodeoxycholic acid is increasingly used in the clinical setting for a treatment of a variety of conditions.Citation94,Citation95 Ketolithocholic acid, lithocholic acid, and ursodeoxycholic acid have been also found to provide resistance against C. difficile infections and to modulate the host inflammatory response during the infection.Citation96 The BA profiling of ICU+ patients may also explain the high similarity at the functional level revealed by FEAST with the C. difficile cohort ()).
Figure 5. Associations between gut microbiome and short-chain fatty acids and bile acids
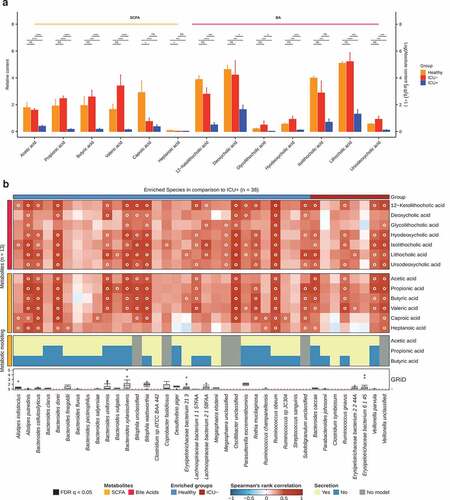
To identify which species were mainly responsible for the differences in the levels of the measured SCFAs and BAs in ICU+ compared to the other two groups, we performed growth rate analysis Citation89 and Spearman’s correlation between the 13 metabolites and 38 species. The species selected were either having (i) significantly higher abundance in the Healthy group compared to ICU+ but not compared to the ICU– group or (ii) significantly higher abundance in the ICU– compared to the ICU+ group ()). As shown in , A. putredinis, Lachnospiraceae bacterium 2 1 58FAA and Lachnospiraceae bacterium 1 1 57FAA showed positive correlations with SCFAs and/or BAs and were predicted through Flux Variability Analysis (FVA) Citation88 to secrete SCFAs. Several Bacteroides species, including B. uniformis, were actively growing (GRiD Citation89 > 1), they showed positive correlations with the measured SCFAs and they were predicted through FVA Citation88 to secrete SCFAs supporting the identified correlation ()). Since BA metabolism is not included in these metabolic models, we analyzed the BA biosynthesis potential of the species showing high correlation with BAs using differential analysis of enzymes involved in the BA biosynthesis pathway. The enzymes cbh and baiN were found in the genomes of Bacteroides xylanisolvens, L. bacterium 2 1 58FAA, R. obeum, and R. gnavus. The abundance levels of B. xylanisolvens and R. obeum cbh and the abundance levels of R. obeum baiN were found significantly higher in the Healthy group compared to the ICU+ (Wilcoxon rank-sum test, P < .05, data not shown). R. obeum has been previously shown to have an inhibitory effect on V. cholerae due to its capacity to degrade virulence-activating signals in the gut through the synthesis of bile salt hydrolases.Citation15
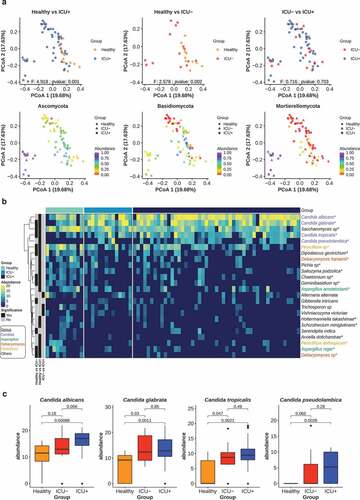
Candida species and resistant genes flourish in critically ill patients
Since the microbiome composition and functional profile of critically ill patients appeared to be dysbiotic, we investigated next if this leads to systematic changes in the structure of the fungal community, with emphasis on Candida species and the antibiotic resistance gene (ARG) levels in the three groups. We built high-quality libraries for ITS2 sequencing of 74 available stool samples from the Healthy, ICU+ and ICU– groups. We estimated the fungal relative abundance using the DADA2 pipeline.Citation97 The taxonomic profiling revealed that Ascomycota (85.63%) was the most abundant fungal phyla, followed by Basidiomycota (9.84%) and Muromycota (3.44%) ()). There was no significant difference in the alpha diversity (Shannon, Simpson, Chao1) between any of the two groups and the type of beta-lactam administrated in the ICU+ group did not appear to influence this pattern (Wilcoxon rank-sum test, P > .05) (Supplementary Figure 7). However, when we calculated the Bray–Curtis distance of the three groups we observed a high community dissimilarity between ICU+ and Healthy (PERMANOVA, P = .001) and between ICU– and Healthy (PERMANOVA, P = .001), whereas the ICU+ and ICU– groups did not show significant differences (PERMANOVA, P = .703) (), Supplementary Figure 10(a)). We subsequently investigated differences in fungal species relative abundance between the three groups. In total 19, 11, and 3 fungal species were found significantly different (Wilcoxon rank-sum test, P < .05) in the comparisons between Healthy vs ICU+, Healthy vs ICU–, ICU+ vs ICU–, respectively ()). The Candida genus, which includes species that are opportunistic pathogens, was found to have the greatest number of differentially abundant species between the three groups. Candida albicans, Candida glabrata, Candida pseudolambica, and Candida tropicalis were all found to have the highest abundance in ICU+ patients ()).
Figure 6. ICU patients have distinct mycobiome profiles
To determine whether antibiotic treatment exerts selective pressure on the resistome as a whole, we analyzed the change in Pfams related to the resistome and mobilome, as well as the abundance differences of ARGs between the three groups. In the abundance comparison between the Healthy and the ICU+ groups, there were 71 statistically significant Pfams (Wilcoxon rank-sum test, P < .05) related to the resistome and/or mobilome, with 48 of them being more abundant in the ICU+ and 23 in the Healthy group (Supplementary Figure 8(a)). Interestingly, the differences between ICU– and Healthy groups were also large with 30 and 16 Pfams being more abundant in the ICU– and the Healthy group, respectively (Supplementary Figure 8(a)). In the comparison between ICU+ and ICU– there were 19 significant Pfams with 14 being more abundant in the ICU+ and 5 in the ICU– group (Supplementary Figure 8(a)).
Subsequently, we annotated the ARGs in the three groups using deepARG.Citation98 The overall ARG abundance profile of the ICU+ and ICU– groups using the Bray–Curtis distances indicates that there is no substantial perturbation during antibiotic treatment (PERMANOVA, P = .261), but there are significant differences between ICU+ and Healthy (PERMANOVA, P = .001) and between ICU– and Healthy (PERMANOVA, P = .001) (Supplementary Figure 8(b), Supplementary Figure 10(b)). Comparing the total accumulative relative ARGs abundance led to the same conclusion; critically ill patients have already a unique resistome profile compared to healthy individuals, which is only marginally disturbed by antibiotics administration (Wilcoxon rank-sum test, P = 5.97e-8, Supplementary Figure 8(c)). Considering the polypharmacology approaches often applied in ICU, our observation is in agreement to recent studies suggesting that human targeted drugs can significantly impact on the gut resistome profile.Citation99 Nevertheless, an abundance comparison of the individual ARGs revealed 24 ARGs, including 3 beta-lactams (SHV, PENA, AMPC), significantly higher in the ICU+ group and only 1 in the ICU– group (dabestr, Confidence Interval (CI) = 95%, Supplementary Table 3). Among the ARGs that exhibit the highest abundance differences (dabestr, 95%) between the ICU+ and ICU– groups were AAC(6ʹ)-I (aminoglycoside), ADEC (multidrug), ERMB (macrolide, lincosamide and streptogramin), VANS (glycopeptide), and MSRC (macrolide, lincosamide and streptogramin) (Supplementary Figure 8(d)).
Discussion
Sepsis, acute respiratory distress syndrome (ARDS), and multi-organ failure represent common conditions most frequently driven by an inappropriate host response to pathogens of the critically ill. These conditions are responsible for immense global mortality accompanied by a tremendous economic burden Citation1. While breakthroughs of molecular medicine have revolutionized treatment in oncology and rheumatology, in critical illness research endeavors of decades have not resulted in any targeted therapies. In practice, intensive care can be considered mostly as supportive and antibiotics are a cornerstone of care for patients with sepsis, i.e. infection-driven organ dysfunction.Citation7
The off-target effects of antibiotics on the microbiome are, however, also particularly obvious in the ICU population. Antibiotics often fail to resolve organ failure despite evidence of infection and, even more concerning, are frequently administered not to miss an occult infection. While the resulting increase of multi-resistant bacteria is an obvious problem, the negative impact on the “holobiont” in the ICU have largely been ignored. More to the point, considerations in intensive care are more dwelling around the early days of introduction of antimicrobial therapy when Paul Ehrlich propagated the concept of “therapia sterilisans magna” where only “parasitotropic“ effects in the absence of “organotropic“ effects of drugs were envisioned.Citation100 Thus, molecular therapies for these common and lethal diseases are desperately needed and depend on a better understanding of systems biology of the host metabolome–microbiome interplay.Citation101 Up to now, the downstream consequences, such as host inflammation and cellular damage, and not the upstream sources, in particular the complex microbial ecosystems that reside in and on the human body, have been the priority of research. Nevertheless, two recent studies in mice Citation102,Citation103 indicate that Fecal Material Transplantation (FMT) and specific species in the gut microbiome could prevent sepsis opening up new clinical research avenues.
Here, we present evidence from a human study that the selective pressures to which critically ill patients are exposed (parenteral nutrition, polypharmacy, including e.g., proton pump inhibitors, shock states requiring invasive life support measures, such as catecholamine treatment) shape the microbiome of these patients in a unique way with highly distinct characteristics compared to healthy or other disease states, including metabolic, inflammatory, or malignant diseases. As we have shown, the microbiome structure and function of critically ill patients resembles signatures mainly observed in severe infections such as C. difficile and V. cholerae. This already “infection-vulnerable” microbiome structure in critical illness becomes severely dysbiotic after antibiotic treatment with an observed depletion of SCFAs, including propionate, butyrate, and acetate, and BAs. Similarly, in an elegant mice study Kim et al., Citation102 demonstrated using FMT from healthy littermates that high levels of butyrate (and potentially also propionate), provided mainly by Bacteroidetes, can rescue from lethal sepsis caused by a pathogenic mixture of K. oxytoca, E. faecalis, Serratia marcescens and C. albicans isolated from a septic patient. Three of these pathogenic species, K. oxytoca, E. faecalis and C. albicans, were found in significantly higher abundance in our critically ill patients compared to healthy individuals. However, the poor similarity in gut microbial taxonomic abundances between human and mice Citation104 highlights the importance of investigating the relationship between critical illness and gut microbiota in human clinical samples. For example, while Kim et al., Citation102 hypothesized that critical illness itself may result in the depletion of gut butyrate. In our human study, this was not the case and only after antibiotics administration we observed a dramatic decrease in the SCFA levels. Nevertheless, we observed a significant change in taxonomy also in ICU– compared to Healthy related to inflammation, such as a significant increase in the abundance of Staphylococcus and Enterococcus, which have been reported as key factors for the development of signs of systemic inflammation, nosocomial infection and complications in the ICU course.Citation48,Citation86
Our study has several limitations. Critically ill patients represent a heterogeneous patient group characterized by comorbidities, past infections and age, leakage of alveolar, and intestinal barriers as well as impaired defense and repair mechanisms.Citation105,Citation106 Low flow states up to overt shock, autonomic dysfunction, and lack of sufficient options for enteral feeding, e.g., due to dysphagia or impaired consciousness affect gut function, transit time, and defecation.Citation107 Many drugs that are applied routinely in addition to antibiotics, such as proton pump inhibitors or catecholamines can affect gut function substantially.Citation99 Nevertheless, while rodent studies allow to control many of the aforementioned confounders, only clinical studies allow to address the impact of antibiotics on the gut microbiome as it relates to clinically meaningful outcomes. Thus, we aimed at control of confounders through inclusion of patient cohorts requiring critical care but not receiving antibiotics.
Patients in ICUs represent a relatively small subgroup of hospitalized patients, but they reflect a specific at-risk population that accounts for approximately 25% of all hospital-acquired infections.Citation108 Infection as a typical complication of critical illness increases length of ICU stay, morbidity, mortality, and costs.Citation109 Moreover, the rise in multidrug-resistant strains prompts attention on nonantibiotic strategies in the prevention and treatment of nosocomial infections, such as pro- or synbiotics. However, mechanisms of action in the vulnerable population of critically ill patients requires further investigation into the mechanisms that shape the gut microbiome. From our study we suggest that the loss of a handful of species, that are highly connected with the production of SCFAs and BAs, during antibiotic administration in the ICU allows the expansion of pathogenic species, which exhibit potential to cause direct hindrance of host homeostasis. Despite the availability of more advanced antibiotics in ICUs death rates from sepsis following nosocomial infections keep increasing, indicating that these antibiotics do not increase survival but instead they produce a highly dysbiotic gut ecosystem that allows more aggressively resistant and lethal pathogens to thrive.Citation1 These changes are likely associated with or even to promote a state of “protracted critical illness”, a frequent observation in patients discharged after prolonged intensive care and characterized by persistent systemic infection. It seems warranted to design studies that aim to restore the gut microbiome or replace key metabolites, such as SCFAs or BAs, in this vulnerable patient population to restore homeostasis of the “metaorganism” after discharge from intensive care.
Materials and methods
Study design
A prospective observational study was undertaken from May 2018 until January 2019 at the Jena University Hospital. Adult critically ill patients either treated with systemic antimicrobial therapy (piperacillin/tazobactam or meropenem) for at least 2 days or without any systemic antimicrobial therapy within the last 7 days were eligible for this study. Patients with inflammatory bowel disease, major bowel resection, selective decontamination of the oral and digestive tract, oral vancomycin therapy, immunocompromised patients, history of chemotherapy during the last 6 months, or known travel history to areas of high antimicrobial resistance within the last 4 weeks were excluded from this study. The need for informed consent was waived by the IRB, since this investigation did not involve any intervention at the patient. The collected basic data were used only for calculating mean values per group and were not linked to the individual metagenomic profiles. Stool samples from healthy volunteers (>50 years old) with no antimicrobial therapy within the last 6 months served as a control group. Healthy volunteers interested in participating were invited for a consultation with medical doctors in the Jena University Hospital. Their health status and prior antibiotic use was self-reported. The basic demographic data for the healthy cohort is provided in Supplementary File 1. We collected up to 100 ml feces which were sampled immediately after natural defecation. Fecal specimens were transferred into two sterile containers, one that was mixed with liquid thioglycolate medium supplemented with catalase and 10% glycerol and one without buffer solution. Both containers were stored at –80°C. Each patient contributed with only one stool sample.
DNA extraction from stool samples
All stool samples were processed by Novogene (UK). DNA was extracted using the following protocol: Stool samples were thoroughly mixed with 900 μL of CTAB lysis buffer. All samples were incubated at 65°C for 60 min before being centrifuged at 12000 × g for 5 min at 4°C. Supernatants were transferred to fresh 2-mL microcentrifuge tubes and 900 μL of phenol:chloroform:isoamyl alcohol (25:24:1, pH = 6.7; Sigma-Aldrich) was added for each extraction. Samples were mixed thoroughly prior to being incubated at room temperature for 10 min. Phase separation occurred by centrifugation at 12,000 × g for 15 min at 4°C, and the upper aqueous phase was re-extracted with a further 900 μL of phenol:chloroform:isoamyl alcohol. Next, samples were centrifuged at 12,000 × g for 10 min at 4°C, and the upper aqueous phases were transferred to fresh 2-mL microcentrifuge tubes. The final extraction was performed with 900 μL of chloroform:isoamyl alcohol (24:1), and layer separation occurred by centrifugation at 12,000 × g for 15 min at 4°C. Precipitation of DNA was achieved by adding the upper phase from the last extraction step to 450 μL of isopropanol (Sigma-Aldrich) containing 50 μL of 7.5 M ammonium acetate (Fisher). Samples were incubated at – 20°C overnight, although shorter incubations (1 h) produced lower DNA yields. Samples were centrifuged at 7500 × g for 10 min at 4°C, and supernatants were discarded. Finally, DNA pellets were washed three times in 1 mL of 70% (v/v) ethanol (Fisher). The final pellet was air-dried and re-suspended in 200 μL of 75 mM TE buffer (pH = 8.0; Sigma-Aldrich).
Library preparation and sequencing for metagenomics
Sequencing library was generated based on Illumina technologies and following manufactures’ recommendations. Index codes were added to each sample. Briefly, the genomic DNA was randomly fragmented to a size of 350 bp, then DNA fragments were narrowly size selected with sample purification beads. The selected fragments were then end polished, A-tailed, and ligated with adapter. These fragments were filtered with beads again and amplified by PCR reaction. At last, the library was analyzed for size distribution and quantified using real-time PCR. The library was then to be sequenced on an Illumina platform Novaseq 6000 (Novogene) with paired-end reads of 150 bp.
Internal transcribed spacer sequencing
The concentration of genomic DNA was determined by Qubit, and the DNA quality was checked on the gel. 200 ng of DNA was used as input for PCR reaction with corresponding primer set specifically binding to different hypervariable regions. Each primer set had a unique barcode. PCR product was then run on the gel and DNA fragment with the proper amplification size was cut and purified. The purified PCR product was then used as template for library preparation. The PCR products were pooled together with equal amount and then end polished, A-tailed, and ligated with the adapter. These fragments were filtered with beads again. After PCR reaction (to make library fully double strand), the library was analyzed for size distribution and quantified using real-time PCR. The library was then to be sequenced on Hiseq2500.
Metabolomics analysis
We performed targeted metabolomics analysis for 38 of the 75 available samples. The remaining samples were destroyed during a prolonged stay in the customs during the COVID-19 pandemic.
Quantification of SCFAs: SCFAs were extracted by addition of 2 mg ultra-pure water pr. mg of sample. The samples were vortex mixed for 1–2 min until suspension is reached, and centrifuged at max speed for 10 min at 4°C. The supernatant was transferred to a spinX centrifuge filter and centrifuged for additional 5 min at 4°C. The filtrate was collected and stored at –20°C until analysis. Sample analysis was carried out by MS-Omics as follows. Samples were acidified using hydrochloric acid, and deuterium labeled internal standards where added. All samples were analyzed in a randomized order. Analysis was performed using a high polarity column (ZebronTM ZB-FFAP, GC Cap. Column 30 m x 0.25 mm x 0.25 μm) installed in a GC (7890B, Agilent) coupled with a quadrupole detector (5977B, Agilent). The system was controlled by ChemStation (Agilent). Raw data was converted to netCDF format using Chemstation (Agilent), before the data was imported and processed in Matlab R2014b (MathWorks, Inc.) using the PARADISe software described by Johnsen et al.Citation110
Quantification of BAs: Bile acids were extracted by addition of 4 mg methanol pr. mg of sample. The samples were vortex mixed for 1–2 min until suspension is reached, and centrifuged at max speed for 10 min at 4°C. The supernatant was transferred to a spinX centrifuge filter and centrifuged for additional 5 min at 4°C. In a HPLC vial, 285 μL filtrate is mixed with 15 μL internal standard. The final volume of filtrate of CS10768 and CS10798 where below 285 μl. Therefore, 200 μl were combined with 85 μl Methanol and 15 μl internal standard. Sample analysis was carried out by MS-Omics as follows. The analysis was carried out using a Thermo Scientific Vanquish LC coupled to Thermo Q Exactive HF MS. An electrospray ionization interface was used as ionization source. Analysis was performed in negative ionization mode. The chromatographic separation of bile acids was carried out on a Waters Acquity HSS T3 1.8 μm 2.1 × 150 mm (Waters). The column was thermostated at 30°C. The mobile phases consisted of (A) ammonium acetate 10 mmol/l, and (B) methanol:acetonitrile (1:1, v/v). Bile acids were eluted by increasing B in A from 45% to 100% for 16 min. Flow rate was 0.3 min. Peak areas were extracted using Tracefinder 4.1 (Thermo Scientific). Identification of compounds were based on accurate mass and retention time of authentic standards.
Data processing
Quality control of sequence data
Quality control to remove low-quality reads was performed as described previously.Citation111 Briefly, all Illumina primer/adapter/linker sequences were removed. Subsequently, low-quality regions (consecutive regions with Phred quality <20) were trimmed. Finally, all reads were mapped to the human genome with BWA version 0.7.4 Citation112 and reads with >95% identity and 90% coverage were removed as human DNA contamination.
Taxonomic profiling
Taxonomic annotation of the high-quality reads was performed using MetaPhlAn2Citation42 version 2.7.7 with default settings, generating taxonomic relative abundances. Bacterial community profiles were constructed at phylum, genus and species level for further analyses.
Taxonomic annotation of fungal ITS was performed using the DADA2 pipelineCitation97 version 1.14 with default parameters including adapter removal, quality filtering and trimming, dereplication of identical reads, read-pair merging, ITS2 extraction and chimera removal. Remaining reads were binned as operational taxonomic units and aligned to the UNITE fungi database using RDP classifier.Citation113 All samples were then normalized by cumulative sum scaling using R package metagenomeSeq.Citation114
Functional annotation
The HUMAnN2 pipeline Citation49 version 0.11.2 was used for functional annotation of the high-quality reads after the quality control. The quantified pathway and gene family abundances in the units of RPKs (read per kilobase) were then normalized to copies per million (CPM) units by the provided HUMAnN2 script, resulting in transcript-per-million-like (TPM) normalization. Gene families were then regrouped to Pfam domains for further analyses.
Abundance comparisons
Species, pathways, and Pfams were filtered by 10% prevalence across all samples and their relative abundances were used for statistical comparisons between the three groups. Differentially abundant features were identified by the Wilcoxon rank-sum test and were considered significantly differentially abundant if the P-value was less than 0.05.
Differentially abundant phyla and genera were identified by the Kruskal-Wallis test and were considered significantly differentially abundant if the P-value was less than 0.05.
Metagenomics sequences from HUMAnN2 profiles
Gene family abundances were clustered using mgs-canopyCitation46 version 1.0 software with standard parameters. Gene family clusters were considered metagenomic sequences (MGS) if they had at least 700 genes. Taxonomic annotation of MGS was done using species annotation information available for each gene family.
We calculated contributions of each species to an MGS. An MGS was annotated to the species with the largest contribution if: the gene contribution of that species was more than 50% and the second largest species was “unclassified” or contributed less than 10%.
Diversity analysis
Alpha diversity indices Shannon, Simpson, and Chao1 were calculated using the R packages veganCitation75 and fossilCitation115 based on relative species abundance. Wilcoxon rank-sum test was used to test for significant differences in alpha diversity. For estimating community dissimilarities, Bray–Curtis distances were calculated using the R package veganCitation75 based on the relative species abundance. To test for significant differences in the microbial composition, permutational multivariate analysis of variance (PERMANOVA), as implemented in the function adonis from R package vegan,Citation75 was used to analyze beta-diversity.
Co-abundance networks
The relative abundance table for significantly different species was processed using SparCC Citation116 for co-abundance network inference. Species–species correlation coefficients were estimated as the average of 20 inference iterations and 100 permutations were used for the pseudo P-value calculation. For the visualization of the co-abundance network, only interactions with an absolute correlation coefficient >0.4 were used.
Metabolic modeling
To estimate the availability and composition of metabolites in ICU patients, the nutrition fed in ICU (https://www.fresenius-kabi.com/de/ernaehrung/fresubin-original) was considered. Metabolic composition of complex products such as fish oil was described by vmh diet designer (https://www.vmh.life/#nutrition/dietdesigner). The human genome-scale metabolic model Recon3D 3.01 Citation117 simulated based on the ICU specific diet (Supplementary File 2) was used to predict metabolites that can potentially be secreted by the host. Flux Variability Analysis (FVA) Citation88 was used to determine feasible exchange reaction flux bounds that support metabolite secretion alongside optimal growth rate. Identified metabolites were assumed to be available for the bacterial species and strains to be consumed. Genome-scale metabolic models of the studied species and strains were collected from two different gut model repositories, AGORA 1.03 (https://www.vmh.life) Citation85 and CarveMe.Citation118 Taking into account the availability of ICU diet compounds and potential host-secreted metabolites in the gut, the maximum amount of SCFAs (acetic acid, propionic acid, and butyric acid) production by bacterial species and strains were predicted by applying FVA Citation88 again alongside achieving maximum ATP yield as objective for the available bacterial metabolic models.
Abundance of ARGs
The metagenomic reads were analyzed using the deepARG pipeline,Citation98 which uses deep learning to identify and quantify ARGs. Reads were compared to the provided DeepARG-DB database using a prediction model to evaluate sequence similarities and predict antibiotic resistance. The pipeline was run in short sequence mode with a minimum probability cutoff of 0.8, an identity cutoff of 80%, an E-value cutoff of 1e-10 and a minimum coverage of 50%.
Testing for significant differences in ARG abundance was performed using R package dabestr Citation119 with a confidence interval of 95%.
Bacterial growth rate estimation
Bacterial growth rate was calculated using the growth rate index (GRiD) Citation89 version 1.2. The algorithm first calculates the coverage of all contigs of a reference genome in the sample, sorts them from high to low, and reorders them to two groups, placing an ori-containing contig at start and a ter-containing contig at the mid-region of the genome. Next, it calculates coverage drops across a sliding 10 Kb window, with values representing the coverage ratio of the peak and trough of the curve. High values represent faster growth rates.
Random forest model
A Random Forest classifier was built to classify ICU patients into ICU– and ICU+ based on bacterial taxonomic profiles and pathways. The model was implemented using R package caret Citation120 with all bacterial species and pathway abundances as input features. The model was trained after centering and scaling the data and removing variables with near zero variance, using a tune length of 10 and fivefold cross-validation as resampling method, the rest of the parameters were left as default. Feature importance were calculated using function varImp from R package caret.Citation120 A random forest model was then built using only the 20 most important features. R package PRROC Citation121 was used for ROC calculation and plot.
Bacterial exposure and survival assay in C. elegans
Bacterial strains used were Escherichia coli OP50, Lactobacillus crispatus (DSM 20356), and Bifidobacterium animalis (DSM 20104). All strains except E. coli were acquired from the German Collection of Microorganisms and Cell Cultures and cultured following the supplier guidelines. Bacterial stocks were kept at –80°C until use. C. elegans strain used was N2 wild-type isolate obtained from the Caenorhabditis Genetics Center.
Bacterial stocks were inoculated in anoxic broth (MRS for L. crispatus and BSM for B. animalis) and incubated at 37°C for 72 h. 150 µL of each bacterial culture was spread onto medium sized NGM agar plates (5,5 cm diameter) and incubated for 24 h at 37°C in an anaerobic container (BD GasPak™ EZ container systems) prior to worm addition. E. coli was grown on NGM in normoxia. UV-killed OP50 was produced by exposing NGM plates to UV light (320 nm) in a Chemi-Doc XRS+ transilluminator (BioRad) for 10 min.
Age-synchronized germ-free worms were obtained by collecting eggs from gravid adults upon treatment with alkaline hypochlorite solution (composition per liter: 200 mL 1 M KOH, 250 mL bleach, and 500 mL ddH2O) and letting the eggs hatch overnight at 20°C in M9 buffer. Synchronized L1 larvae were seeded onto NGM plates containing respective bacterial strains (4 plates per strain). Approximately 150 worms were seeded per plate. Plates were incubated at 20°C in an anaerobic container for 5 h or 24 h. After incubation worms were washed with M9 buffer and transferred to UV-killed OP50 plates. UV-killed OP50 plates were incubated at 20°C in normoxic conditions for 24 h prior to survival assessment. Heat-killed bacteria was obtained by submerging bacterial cultures at 80°C for 60 min and OD600 was normalized to 0,2 before placing the cultures onto NGM plates. Live bacteria was also subjected to OD600 normalization in all tests, which involved heat-killed control conditions.
Survival rate was assessed by screening all the worms present in each plate. A worm was regarded as dead if it did not respond to gentle touch with a platinum wire. Survival was expressed as percentage of the total number worms. Each experiment was performed 3 times.
Developmental fitness and reproductive aging assays in C. elegans
Bifidobacterium animalis was grown for 72 h on anoxic BSM broth at 37°C. Afterward, 150 uL of bacterial culture was spread onto medium-sized NGM plates (4 plates) and incubated for 24 h at 37°C in an anaerobic container (BD GasPak™ EZ container systems) prior to worm addition. E. coli OP50 was grown on NGM at normoxic conditions. C. elegans N2 population was synchronized as described above and approximately 150 worms were seeded on either B. animalis or OP50 plates. Plates were incubated for 24 h at 20°C in the anaerobic container. Developmental assay was carried out as previously described.Citation122 In brief, 30 worms per bacterium were put individually onto small UV-killed OP50 plates and incubated for 48 h at 20°C before developmental stage of each worm was visually assessed. Reproductive aging assay was carried out as described previously.Citation123 In brief, after incubation with B. animalis or OP50 the worms were washed with M9 and let to develop until L4 stage on UV-killed OP50 plates at 20°C, normoxia. At this moment 25 randomly picked worms (per condition) were transferred individually onto small-sized UV-killed OP50 plates. Every day the brood size of each worm was determined (sum of eggs and L1s) and parent worm was transferred to new plate until egg laying ceased. These experiments were performed 3 times.
DAF-16 nuclear translocation assay
Nematodes expressing DAF-16::GFP fusion protein were obtained from the Caenorhabditis Genetics Center (strain TJ356). Bacterial strains used were the same as described above. Anoxic broth was inoculated with an aliquot of actively growing bacterial culture and incubated at 37°C for 48 h. OD600 of all living cultures was normalized to 0,1. 150 µL of each bacterial culture was spread onto medium sized NGM agar plates (5,5 cm diameter) and incubated for 24 h at 37°C in an anaerobic container (BD GasPak™ EZ container systems) prior to worm addition. E. coli was grown on NGM in normoxia. Heat-killed bacteria was generated as described above and OD600 was normalized to 0,2 prior to seeding onto NGM plates.
Age-synchronized germ-free worms were obtained as described above and grown until L4 stage on UV-killed OP50. L4 worms were washed with M9 buffer and transferred to NGM plates containing bacteria. Approximately 150 worms were seeded per plate. Plates were incubated at 20°C in an anaerobic container (BD GasPak™ EZ container systems) on either live or heat-killed bacteria for 5 h. Control plates were incubated in normoxia on live bacteria only. After incubation, 30 worms were picked from each condition and transferred to empty NGM plates for imaging. Imaging was carried out using a ZEISS Axio Zoom.V16 microscope equipped with fluorescence light. Imaged worms were sorted into three categories (nuclear, intermediate, cytosolic) depending on the localization of the GFP tagged DAF-16 transcription factor. This experiment was performed three times.
Statistical analysis
To determine differential abundance of taxonomic, functional, and metabolic features between groups Wilcoxon two-tailed rank-sum test was applied when analyzing the differences between two groups, whereas Kruskal–Wallis test was used when more than two groups were compared. Correlation between microbial taxa and metabolites was assessed by Spearman’s correlation. The R package dabestrCitation119 was used to test differential abundance of ARGs. Significant differences in source contributions to sinks using FEASTCitation43 were assessed using Wilcoxon two-tailed rank sum test. To assess differences in alpha diversity and beta dispersion, Wilcoxon two-tailed rank sum test was used, whereas PERMANOVA was used for beta diversity.
Ethics approval and consent to participate
The study was approved by the local ethics committee in Jena, Germany (5289-10/17). Informed consent was waived by the ethics committee because feces were only collected after natural defecation and no patient data were obtained.
Author contributions
GP and MB designed the study. MB was involved in sample collection and processing. GP designed and supervised the bioinformatics analysis and edited the manuscript. AMS and LZ carried out the data analysis and data integration. MM performed the metabolic modelling. BS and YN helped with the interpretation of results and revised the manuscript. RS carried out the quality control and pre-processing of the metagenomic data, and together with AB and CB helped with the interpretation of results. PAP, MM and ME designed and performed the animal studies. All authors read and approved the final manuscript.
Supplemental Material
Download Zip (11.9 MB)Disclosure statement
The authors declare that they have no competing interests.
Availability of data and material
Raw sequence files were deposited into the NCBI Sequence Read Archive (SRA) under accession number PRJNA670323.
Supplementary material
Supplemental data for this article can be accessed on the publisher’s website.
Additional information
Funding
References
- Milbrandt E, Kersten A, Rahim M, Dremsizov T, Clermont G, Cooper L, Angus D. 2008. Growth of intensive care unit resource use and its estimated cost in medicare. Crit Care Med. 36(9):2504–25. doi:10.1097/CCM.0b013e318183ef84.
- Brun-Buisson C. 2000. The epidemiology of the systemic inflammatory response. Intensive Care Med [Internet]. 26(S1):S064–74. doi:10.1007/s001340051121.
- Adib-Conquy M, Cavaillon JM. 2009. Compensatory anti-inflammatory response syndrome. Thromb Haemost. 101(1):36–47. doi:10.1160/TH08-07-0421.
- Boomer JS, To K, Chang KC, Takasu O, Osborne DF, Walton AH, Bricker TL, Jarman SD, Kreisel D, Krupnick AS, et al. 2011.Immunosuppression in patients who die of sepsis and multiple organ failure. JAMA - J Am Med Assoc. 306(23):2594–2605. doi:10.1001/jama.2011.1829.
- Angus DC, Linde-Zwirble WT, Lidicker J, Clermont G, Carcillo J, Pinsky MR. 2001. Epidemiology of severe sepsis in the United States: analysis of incidence, outcome, and associated costs of care. Crit Care Med. 29(7):1303–1310. doi:10.1097/00003246-200107000-00002.
- Vincent J-L, Sakr Y, Singer M, Martin-Loeches I, Machado FR, Marshall JC, Finfer S, Pelosi P, Brazzi L, Aditianingsih D, et al. 2020. Prevalence and outcomes of infection among patients in intensive care units in 2017. JAMA [Internet]. 323(15):1478. doi:10.1001/jama.2020.2717.
- Rhodes A, Evans LE, Alhazzani W, Levy MM, Antonelli M, Ferrer R, Kumar A, Sevransky JE, Sprung CL, Nunnally ME, et al. 2017. Surviving sepsis campaign. Crit Care Med. 45:486–552.
- Silvestri L, De La Cal M, Van Saene H. Selective decontamination of the digestive tract: the mechanism of action is control of gut overgrowth. Intensive Care Med. 2012;38.
- Fridkin S, Baggs J, Fagan R, Magill S, Pollack LA, Malpiedi P, Slayton R, Khader K, Rubin MA, Jones M, et al. 2014. Vital signs: improving antibiotic use among hospitalized patients. MMWR Morb Mortal Wkly Rep [Internet]. 63:194–200. Available from. http://www.ncbi.nlm.nih.gov/pubmed/24598596%0Ahttp://www.pubmedcentral.nih.gov/articlerender.fcgi?artid=PMC4584728
- Ravi A, Halstead FD, Bamford A, Casey A, Thomson NM, van Schaik W, Snelson C, Goulden R, Foster-Nyarko E, Gm S, et al. 2019. Loss of microbial diversity and pathogen domination of the gut microbiota in critically ill patients. Microb Genomics [Internet]. 5(9).
- McKenney PT, Pamer EG. 2015. From hype to hope: the gut microbiota in enteric infectious disease. Cell [Internet] ; 163(6):1326–1332. doi:10.1016/j.cell.2015.11.032.
- Jacobson A, Lam L, Rajendram M, Tamburini F, Honeycutt J, Pham T, Van Treuren W, Pruss K, Stabler SR, Lugo K, et al. 2018. A gut commensal-produced metabolite mediates colonization resistance to salmonella infection. Cell Host Microbe [Internet] ; 24(2):296–307.e7. doi:10.1016/j.chom.2018.07.002.
- Fukuda S, Toh H, Hase K, Oshima K, Nakanishi Y, Yoshimura K, Tobe T, Clarke JM, Topping DL, Suzuki T, et al. 2011.Bifidobacteria can protect from enteropathogenic infection through production of acetate. Nature. 469(7331):543–547. doi:10.1038/nature09646.
- Kang JD, Myers CJ, Harris SC, Kakiyama G, Lee I-K, Yun B-S, Matsuzaki K, Furukawa M, Min H-K, Bajaj JS, et al. 2019. Bile acid 7α-Dehydroxylating gut bacteria secrete antibiotics that inhibit clostridium difficile: role of secondary bile acids. Cell Chem Biol Internet]. 26(1):27–34.e4. doi:10.1016/j.chembiol.2018.10.003.
- Alavi S, Mitchell JD, Cho JY, Liu R, Macbeth JC, Hsiao A. 2020. Interpersonal gut microbiome variation drives susceptibility and resistance to cholera infection. Cell [Internet]. 181(7):1533–1546.e13. doi:10.1016/j.cell.2020.05.036.
- Hand TW. 2016. The role of the microbiota in shaping infectious immunity. Trends Immunol Internet. 37(10):647–658. doi:10.1016/j.it.2016.08.007.
- Armour CR, Nayfach S, Pollard KS, Sharpton TJ. 2019. A metagenomic meta-analysis reveals functional signatures of health and disease in the human gut microbiome. mSystems. 4(4):1–15. doi:10.1128/mSystems.00332-18.
- McDonald D, Ackermann G, Khailova L, Baird C, Heyland D, Kozar R, Lemieux M, Derenski K, King J, Vis-Kampen C, et al. 2016. Extreme dysbiosis of the microbiome in critical illness. mSphere [Internet]. 1(4).
- Hernández-Santos N, Klein BS. 2017. Through the scope darkly: the Gut mycobiome comes into focus. Cell Host Microbe. 22(6):728–729. doi:10.1016/j.chom.2017.11.013.
- Zhang E, Tanaka T, Tajima M, Tsuboi R, Nishikawa A, Sugita T. 2011. Characterization of the skin fungal microbiota in patients with atopic dermatitis and in healthy subjects. Microbiol Immunol. 55(9):625–632. doi:10.1111/j.1348-0421.2011.00364.x.
- Huseyin CE, O’Toole PW, Cotter PD, Scanlan PD. 2017. Forgotten fungi-the gut mycobiome in human health and disease. FEMS Microbiol Rev.
- Ghannoum MA, Jurevic RJ, Mukherjee PK, Cui F, Sikaroodi M, Naqvi A, Gillevet PM. 2010. Characterization of the oral fungal microbiome (mycobiome) in healthy individuals. PLoS Pathog. 6(1):e1000713. doi:10.1371/journal.ppat.1000713.
- Nguyen LDN, Viscogliosi E, Delhaes L. 2015. The lung mycobiome: an emerging field of the human respiratory microbiome. Front Microbiol. 6. doi:10.3389/fmicb.2015.00089.
- Witherden EA, Moyes DL. Mycrobiome and gut inflammation: implications in gut disease. In: Immunity and inflammation in health and disease. Elsevier; 2018. p. 271–280.
- van Woerden HC, Gregory C, Brown R, Marchesi JR, Hoogendoorn B, Matthews IP. 2013. Differences in fungi present in induced sputum samples from asthma patients and non-atopic controls: a community based case control study. BMC Infect Dis. 13(1). doi:10.1186/1471-2334-13-69.
- Hoffmann C, Dollive S, Grunberg S, Chen J, Li H, Wu GD, Lewis JD, Bushman FD. 2013. Archaea and fungi of the human gut microbiome: correlations with diet and bacterial residents. PLoS One.
- Sokol H, Leducq V, Aschard H, Pham HP, Jegou S, Landman C, Cohen D, Liguori G, Bourrier A, Nion-Larmurier I, et al. 2017. Fungal microbiota dysbiosis in IBD. Gut. 66(6):1039–1048. doi:10.1136/gutjnl-2015-310746.
- Fujimura KE, Sitarik AR, Havstad S, Lin DL, Levan S, Fadrosh D, Panzer AR, Lamere B, Rackaityte E, Lukacs NW, et al. 2016. Neonatal gut microbiota associates with childhood multisensitized atopy and T cell differentiation. Nat Med. 22(10):1187–1191. doi:10.1038/nm.4176.
- Velegraki A, Cafarchia C, Gaitanis G, Iatta R, Boekhout T. 2015. Malassezia infections in humans and animals: pathophysiology, detection, and treatment. PLoS Pathog. 11(1):e1004523. doi:10.1371/journal.ppat.1004523.
- Yang AM, Inamine T, Hochrath K, Chen P, Wang L, Llorente C, Bluemel S, Hartmann P, Xu J, Koyama Y, et al. 2017. Intestinal fungi contribute to development of alcoholic liver disease. J Clin Invest. 127(7):2829–2841. doi:10.1172/JCI90562.
- Dollive S, Chen YY, Grunberg S, Bittinger K, Hoffmann C, Vandivier L, Cuff C, Lewis JD, Wu GD, Bushman FD. 2013. Fungi of the murine gut: episodic variation and proliferation during antibiotic treatment. PLoS One. 8(8):e71806. doi:10.1371/journal.pone.0071806.
- Noverr MC, Noggle RM, Toews GB, Huffnagle GB. 2004. Role of antibiotics and fungal microbiota in driving pulmonary allergic responses. Infect Immun. 72(9):4996–5003. doi:10.1128/IAI.72.9.4996-5003.2004.
- Fan D, Coughlin LA, Neubauer MM, Kim J, Kim MS, Zhan X, Simms-Waldrip TR, Xie Y, Hooper LV, Koh AY. 2015. Activation of HIF-1α and LL-37 by commensal bacteria inhibits Candida albicans colonization. Nat Med.
- Krause R, Halwachs B, Thallinger GG, Klymiuk I, Gorkiewicz G, Hoenigl M, Prattes J, Valentin T, Heidrich K, Buzina W, et al. 2016.Characterisation of Candida within the mycrobiome/microbiome of the lower respiratory tract of ICU patients. PLoS One. 11(5):1–29. doi:10.1371/journal.pone.0155033.
- Krause R, Moissl-Eichinger C, Halwachs B, Gorkiewicz G, Berg G, Valentin T, Prattes J, Högenauer C, Zollner-Schwetz I. 2017. Mycrobiome in the lower respiratory tract – a clinical perspective. Front Microbiol. 07. doi:10.3389/fmicb.2016.02169.
- Arastehfar A, Carvalho A, Nguyen MH, Hedayati MT, Netea MG, Perlin DS, Hoenigl M. 2020. COVID-19-Associated Candidiasis (CAC): an underestimated complication in the absence of immunological predispositions? J Fungi. 6(4):211. doi:10.3390/jof6040211.
- Lagunes L, Rello J. 2016. Invasive candidiasis: from mycobiome to infection, therapy, and prevention. Eur J Clin Microbiol Infect Dis. 35(8):1221–1226. doi:10.1007/s10096-016-2658-0.
- Watkins RR, Mukherjee PK, Chandra J, Retuerto MA, Guidry C, Haller N, Paranjape C, Ghannoum MA. 2017. Admission to the intensive care unit is associated with changes in the oral mycobiome. J Intensive Care Med. 32(4):278–282. doi:10.1177/0885066615627757.
- Heisel T, Nyaribo L, Sadowsky MJ, Gale CA. 2019. Breastmilk and NICU surfaces are potential sources of fungi for infant mycrobiomes. Fungal Genet Biol. 128:29–35. doi:10.1016/j.fgb.2019.03.008.
- Seelbinder B, Chen J, Brunke S, Vazquez-Uribe R, Santhaman R, Meyer AC, De Oliveira Lino FS, Chan KF, Loos D, Imamovic L, et al. 2020. Antibiotics create a shift from mutualism to competition in human gut communities with a longer-lasting impact on fungi than bacteria. Microbiome. 8(1). doi:10.1186/s40168-020-00899-6.
- Calandra T, Cohen J. 2005. The international sepsis forum consensus conference on definitions of infection in the intensive care unit. Crit Care Med. 33(7):1538–1548. doi:10.1097/01.CCM.0000168253.91200.83.
- Truong DT, Franzosa EA, Tickle TL, Scholz M, Weingart G, Pasolli E, Tett A, Huttenhower C, Segata N. 2015. MetaPhlAn2 for enhanced metagenomic taxonomic profiling. Nat Methods [Internet]. 12(10):902–903. doi:10.1038/nmeth.3589.
- Shenhav L, Thompson M, Joseph TA, Briscoe L, Furman O, Bogumil D, Mizrahi I, Pe’er I, Halperin E. 2019. FEAST: fast expectation-maximization for microbial source tracking. Nat Methods. 16(7):627–632. [Internet]. doi:10.1038/s41592-019-0431-x.
- Abeles SR, Jones MB, Santiago-Rodriguez TM, Ly M, Klitgord N, Yooseph S, Nelson KE, Pride DT. 2016. Microbial diversity in individuals and their household contacts following typical antibiotic courses. Microbiome [Internet]. 4(1):39. doi:10.1186/s40168-016-0187-9.
- Burdet C, Nguyen TT, Duval X, Ferreira S, Andremont A, Guedj J, Mentré F, Cherng B, Su Gin DC, Rama ND, et al. 2019. Impact of antibiotic gut exposure on the temporal changes in microbiome diversity. Antimicrob Agents Chemother [Internet]. 63. https://aac.asm.org/content/63/10/e00820-19.
- Nielsen HB, Almeida M, Juncker AS, Rasmussen S, Li J, Sunagawa S, Plichta DR, Gautier L, Pedersen AG, Le Chatelier E, et al. 2014. Identification and assembly of genomes and genetic elements in complex metagenomic samples without using reference genomes. Nat Biotechnol. 32(8):822–828. doi:10.1038/nbt.2939.
- Foster ZSL, Sharpton TJ, Grünwald NJ. 2017. Metacoder: an R package for visualization and manipulation of community taxonomic diversity data. PLOS Comput Biol [Internet]. 13(2):e1005404. doi:10.1371/journal.pcbi.1005404.
- Fiore E, Van Tyne D, Gilmore MS. 2019. Pathogenicity of Enterococci. Microbiol Spectr [Internet]. 7(4).
- Franzosa EA, McIver LJ, Rahnavard G, Thompson LR, Schirmer M, Weingart G, Lipson KS, Knight R, Caporaso JG, Segata N, et al. 2018. Species-level functional profiling of metagenomes and metatranscriptomes. Nat Methods [Internet]. 15(11):962–968. doi:10.1038/s41592-018-0176-y.
- Pasolli E, Schiffer L, Manghi P, Renson A, Obenchain V, Truong DT, Beghini F, Malik F, Ramos M, Dowd JB, et al. 2017. Accessible, curated metagenomic data through experimentHub. Nat Methods [Internet]. 14(11):1023–1024. doi:10.1038/nmeth.4468.
- Hannigan GD, Duhaime MB, Ruffin MT, Koumpouras CC, Schloss PD. 2018. Diagnostic potential and interactive dynamics of the colorectal cancer virome. MBio. 9(6). doi:10.1128/mBio.02248-18.
- Feng Q, Liang S, Jia H, Stadlmayr A, Tang L, Lan Z, Zhang D, Xia H, Xu X, Jie Z, et al. 2015. Gut microbiome development along the colorectal adenoma-carcinoma sequence. Nat Commun. 6(1):6528. doi:10.1038/ncomms7528.
- Thomas AM, Manghi P, Asnicar F, Pasolli E, Armanini F, Zolfo M, Beghini F, Manara S, Karcher N, Pozzi C, et al. 2019. Metagenomic analysis of colorectal cancer datasets identifies cross-cohort microbial diagnostic signatures and a link with choline degradation. Nat Med. 25:667–678.
- Vogtmann E, Hua X, Zeller G, Sunagawa S, Voigt AY, Hercog R, Goedert JJ, Shi J, Bork P, Sinha R. 2016. Colorectal cancer and the human gut microbiome: reproducibility with whole-genome shotgun sequencing. PLoS One. 11(5):e0155362. doi:10.1371/journal.pone.0155362.
- Yu J, Feng Q, Wong SH, Zhang D, Liang QY, Qin Y, Tang L, Zhao H, Stenvang J, Li Y, et al. 2017. Metagenomic analysis of faecal microbiome as a tool towards targeted non-invasive biomarkers for colorectal cancer. Gut. 66(1):70–78. doi:10.1136/gutjnl-2015-309800.
- Zeller G, Tap J, Voigt AY, Sunagawa S, Kultima JR, Costea PI, Amiot A, Böhm J, Brunetti F, Habermann N, et al. 2014. Potential of fecal microbiota for early-stage detection of colorectal cancer. Mol Syst Biol. 10(11):766. doi:10.15252/msb.20145645.
- Gopalakrishnan V, Spencer CN, Nezi L, Reuben A, Andrews MC, Karpinets TV, Prieto PA, Vicente D, Hoffman K, Wei SC, et al. 2018. Gut microbiome modulates response to anti-PD-1 immunotherapy in melanoma patients. Science. 359(6371):97–103. doi:10.1126/science.aan4236.
- Matson V, Fessler J, Bao R, Chongsuwat T, Zha Y, Alegre M-L, Luke JJ, Gajewski TF. 2018. The commensal microbiome is associated with anti-PD-1 efficacy in metastatic melanoma patients. Science. 359(6371):104–108. doi:10.1126/science.aao3290.
- Wen C, Zheng Z, Shao T, Liu L, Xie Z, Le Chatelier E, He Z, Zhong W, Fan Y, Zhang L, et al. 2017. Quantitative metagenomics reveals unique gut microbiome biomarkers in ankylosing spondylitis. Genome Biol. 18(1):142. doi:10.1186/s13059-017-1271-6.
- Jie Z, Xia H, Zhong S-L, Feng Q, Li S, Liang S, Zhong H, Liu Z, Gao Y, Zhao H, et al. 2017.The gut microbiome in atherosclerotic cardiovascular disease. Nat Commun. 8(1):845. doi:10.1038/s41467-017-00900-1.
- Ye Z, Zhang N, Wu C, Zhang X, Wang Q, Huang X, Du L, Cao Q, Tang J, Zhou C, et al. 2018.A metagenomic study of the gut microbiome in Behcet’s disease. Microbiome. 6(1):135. doi:10.1186/s40168-018-0520-6.
- Li J, Zhao F, Wang Y, Chen J, Tao J, Tian G, Wu S, Liu W, Cui Q, Geng B, et al. 2017.Gut microbiota dysbiosis contributes to the development of hypertension. Microbiome. 5(1):1–19. doi:10.1186/s40168-016-0222-x.
- Qin N, Yang F, Li A, Prifti E, Chen Y, Shao L, Guo J, Le Chatelier E, Yao J, Wu L, et al. 2014. Alterations of the human gut microbiome in liver cirrhosis. Nature [Internet]. 513(7516):59–64. 10.1038/nature13568.
- Li SS, Zhu A, Benes V, Costea PI, Hercog R, Hildebrand F, Huerta-Cepas J, Nieuwdorp M, Salojärvi J, Voigt AY, et al. 2016.Durable coexistence of donor and recipient strains after fecal microbiota transplantation. Science. 352(6285):586–589. doi:10.1126/science.aad8852.
- Loomba R, Seguritan V, Li W, Long T, Klitgord N, Bhatt A, Dulai PS, Caussy C, Bettencourt R, Highlander SK, et al. 2017.Gut microbiome-based metagenomic signature for non-invasive detection of advanced fibrosis in human nonalcoholic fatty liver disease. Cell Metab. 25(5):1054–1062.e5. doi:10.1016/j.cmet.2017.04.001.
- Louis S, Tappu R-M, Damms-Machado A, Huson DH, Bischoff SC. 2016. Characterization of the gut microbial community of obese patients following a weight-loss intervention using whole metagenome shotgun sequencing. PLoS One. 11(2):e0149564. doi:10.1371/journal.pone.0149564.
- Le Chatelier E, Nielsen T, Qin J, Prifti E, Hildebrand F, Falony G, Almeida M, Arumugam M, Batto J-M, Kennedy S, et al. 2013.Richness of human gut microbiome correlates with metabolic markers. Nature. 500(7464):541–546. doi:10.1038/nature12506.
- Kostic AD, Gevers D, Siljander H, Vatanen T, Hyötyläinen T, Hämäläinen A-M, Peet A, Tillmann V, Pöhö P, Mattila I, et al. 2015.The dynamics of the human infant gut microbiome in development and in progression toward type 1 diabetes. Cell Host Microbe. 17(2):260–273. doi:10.1016/j.chom.2015.01.001.
- Heintz-Buschart A, May P, Laczny CC, Lebrun LA, Bellora C, Krishna A, Wampach L, Schneider JG, Hogan A, De Beaufort C, et al. 2016. Integrated multi-omics of the human gut microbiome in a case study of familial type 1 diabetes. Nat Microbiol. 2:16180. doi:10.1038/nmicrobiol.2016.180.
- Karlsson FH, Tremaroli V, Nookaew I, Bergström G, Behre CJ, Fagerberg B, Nielsen J, Bäckhed F. 2013. Gut metagenome in European women with normal, impaired and diabetic glucose control. Nature. 498(7452):99–103. doi:10.1038/nature12198.
- Qin J, Li Y, Cai Z, Li S, Zhu J, Zhang F, Liang S, Zhang W, Guan Y, Shen D, et al. 2012.A metagenome-wide association study of gut microbiota in type 2 diabetes. Nature. 490(7418):55–60. doi:10.1038/nature11450.
- Kieser S, Sarker SA, Sakwinska O, Foata F, Sultana S, Khan Z, Islam S, Porta N, Combremont S, Betrisey B, et al. 2018. Bangladeshi children with acute diarrhoea show faecal microbiomes with increased Streptococcus abundance, irrespective of diarrhoea aetiology. Environ Microbiol [Internet]. 20(6):2256–2269. doi:10.1111/1462-2920.14274.
- Vincent C, Miller MA, Edens TJ, Mehrotra S, Dewar K, Manges AR. 2016. Bloom and bust: intestinal microbiota dynamics in response to hospital exposures and Clostridium difficile colonization or infection. Microbiome [Internet]. 4(1):12. doi:10.1186/s40168-016-0156-3.
- David LA, Weil A, Ryan ET, Calderwood SB, Harris JB, Chowdhury F, Begum Y, Qadri F, LaRocque RC, Turnbaugh PJ. 2015. Gut microbial succession follows acute secretory diarrhea in humans. MBio [Internet]. 6(3):e00381–15. doi:10.1128/mBio.00381-15.
- Dixon P. 2003. VEGAN, a package of R functions for community ecology. J Veg Sci [Internet]. 14(6):927–930. doi:10.1111/j.1654-1103.2003.tb02228.x.
- Baxter NT, Schmidt AW, Venkataraman A, Kim KS, Waldron C, Schmidt TM. 2019. Dynamics of human gut microbiota and short-chain fatty acids in response to dietary interventions with three fermentable fibers. MBio [Internet]. 10(1):e02566–18. doi:10.1128/mBio.02566-18.
- Heinken A, Ravcheev DA, Baldini F, Heirendt L, Fleming RMT, Thiele I. 2019. Systematic assessment of secondary bile acid metabolism in gut microbes reveals distinct metabolic capabilities in inflammatory bowel disease. Microbiome. 7(1):1–18. doi:10.1186/s40168-019-0689-3.
- Mukherjee A, Lordan C, Ross RP, Cotter PD. 2020. Gut microbes from the phylogenetically diverse genus Eubacterium and their various contributions to gut health. Gut Microbes [Internet]. 12(1):1802866. doi:10.1080/19490976.2020.1802866.
- Podschun R, Ullmann U. 1998. Klebsiella spp. as Nosocomial pathogens: epidemiology, taxonomy, typing methods, and pathogenicity factors. Clin Microbiol Rev Internet]. 11(4):589–603. doi:10.1128/CMR.11.4.589.
- Devlin AS, Fischbach MA. 2015. A biosynthetic pathway for a prominent class of microbiota-derived bile acids. Nat Chem Biol [Internet]. 11(9):685–690: doi:10.1038/nchembio.1864.
- Liu H, Tian R, Wang H, Feng S, Li H, Xiao Y, Luan X, Zhang Z, Shi N, Niu H, et al. 2020. Gut microbiota from coronary artery disease patients contributes to vascular dysfunction in mice by regulating bile acid metabolism and immune activation. J Transl Med [Internet]. 18(1):382. doi:10.1186/s12967-020-02539-x.
- Morrison DJ, Preston T. 2016. Formation of short chain fatty acids by the gut microbiota and their impact on human metabolism. Gut Microbes [Internet]. 7(3):189–200. doi:10.1080/19490976.2015.1134082.
- Mirković B, Murray MA, Lavelle GM, Molloy K, Azim AA, Gunaratnam C, Healy F, Slattery D, McNally P, Hatch J, et al. 2015. The role of short-chain fatty acids, produced by anaerobic bacteria, in the cystic fibrosis airway. Am J Respir Crit Care Med [Internet]. 192(11):1314–1324. doi:10.1164/rccm.201505-0943OC.
- Horiuchi H, Kamikado K, Aoki R, Suganuma N, Nishijima T, Nakatani A, Kimura I. 2020. Bifidobacterium animalis subsp. lactis GCL2505 modulates host energy metabolism via the short-chain fatty acid receptor GPR43. Sci Rep [Internet]. 10(1):4158. doi:10.1038/s41598-020-60984-6.
- Magnúsdóttir S, Heinken A, Kutt L, Ravcheev DA, Bauer E, Noronha A, Greenhalgh K, Jäger C, Baginska J, Wilmes P, et al. 2017. Generation of genome-scale metabolic reconstructions for 773 members of the human gut microbiota. Nat Biotechnol [Internet]. 35(1):81–89. doi:10.1038/nbt.3703.
- Pons MJ, Ruiz J. 2019. Current trends in epidemiology and antimicrobial resistance in intensive care units. J Emerg Crit Care Med [Internet]. 3:5. doi:10.21037/jeccm.2019.01.05.
- Han B, Sivaramakrishnan P, Lin -C-CJ, Neve IAA, He J, Tay LWR, Sowa JN, Sizovs A, Du G, Wang J, et al. 2017. Microbial genetic composition tunes host longevity. Cell [Internet]. 169:1249–1262.e13. http://www.ncbi.nlm.nih.gov/pubmed/28622510
- Mahadevan R, Schilling CH. 2003. The effects of alternate optimal solutions in constraint-based genome-scale metabolic models. Metab Eng [Internet]. 5(4):264–276. doi:10.1016/j.ymben.2003.09.002.
- Emiola A, Oh J. 2018. High throughput in situ metagenomic measurement of bacterial replication at ultra-low sequencing coverage. Nat Commun [Internet]. 9(1):4956. doi:10.1038/s41467-018-07240-8.
- Libina N, Berman JR, Kenyon C. 2003. Tissue-specific activities of C. elegans DAF-16 in the regulation of lifespan. Cell. 115(4):489–502. doi:10.1016/S0092-8674(03)00889-4.
- Murphy CT. 2006. The search for DAF-16/FOXO transcriptional targets: approaches and discoveries. Exp Gerontol. 41(10):910–921. doi:10.1016/j.exger.2006.06.040.
- Kenyon CJ. 2010. The genetics of ageing. Nature.
- Jungersen M, Wind A, Johansen E, Christensen JE, Stuer-Lauridsen B, Eskesen D. 2014. The science behind the probiotic strain bifidobacterium animalis subsp. lactis BB-12(®). Microorganisms [Internet]. 2:92–110. (2): doi:10.3390/microorganisms2020092.
- Paumgartner G. 2002. Ursodeoxycholic acid in cholestatic liver disease: mechanisms of action and therapeutic use revisited. Hepatology [Internet]. 36:525–531. (3):doi:10.1053/jhep.2002.36088.
- Keely SJ, Steer CJ, Lajczak-McGinley NK. 2019. Ursodeoxycholic acid: a promising therapeutic target for inflammatory bowel diseases? Am J Physiol Liver Physiol [Internet]. 317:G872–81.
- Theriot CM, Bowman AA, Young VB. 2016. Antibiotic-induced alterations of the gut microbiota alter secondary bile acid production and allow for clostridium difficile spore germination and outgrowth in the large intestine. mSphere. 1(1). doi:10.1128/mSphere.00045-15.
- Callahan BJ, McMurdie PJ, Rosen MJ, Han AW, Johnson AJA, Holmes SP. 2016. DADA2: high-resolution sample inference from Illumina amplicon data. Nat Methods [Internet]. 13(7):581–583. doi:10.1038/nmeth.3869.
- Arango-Argoty G, Garner E, Pruden A, Heath LS, Vikesland P, Zhang L. 2018. DeepARG: a deep learning approach for predicting antibiotic resistance genes from metagenomic data. Microbiome. 6(1):1–15. doi:10.1186/s40168-018-0401-z.
- Maier L, Pruteanu M, Kuhn M, Zeller G, Telzerow A, Anderson EE, Brochado AR, Fernandez KC, Dose H, Mori H, et al. 2018. Extensive impact of non-antibiotic drugs on human gut bacteria. Nature [Internet]. 555(7698):623–628. doi:10.1038/nature25979.
- Sörgel F. 2004. The return of Ehrlich’s ‘Therapia magna sterilisans’ and other Ehrlich concepts? Chemotherapy. 50(1):6–10. doi:10.1159/000077277.
- Khaliq W, Großmann P, Neugebauer S, Kleyman A, Domizi R, Calcinaro S, Brealey D, Gräler M, Kiehntopf M, Schäuble S, et al. 2020. Lipid metabolic signatures deviate in sepsis survivors compared to non-survivors. Comput Struct Biotechnol J. 18:3678–3691. doi:10.1016/j.csbj.2020.11.009.
- Kim SM, DeFazio JR, Hyoju SK, Sangani K, Keskey R, Krezalek MA, Khodarev NN, Sangwan N, Christley S, Harris KG, et al. 2020. Fecal microbiota transplant rescues mice from human pathogen mediated sepsis by restoring systemic immunity. Nat Commun [ [Internet]. 11:1–11. doi:10.1038/s41467-020-15545-w.
- Singer JR, Blosser EG, Zindl CL, Silberger DJ, Conlan S, Laufer VA, DiToro D, Deming C, Kumar R, Morrow CD, et al. 2019. Preventing dysbiosis of the neonatal mouse intestinal microbiome protects against late-onset sepsis. Nat Med [Internet]. 25(11):1772–1782. doi:10.1038/s41591-019-0640-y.
- Nguyen TLA, Vieira-Silva S, Liston A, Raes J. 2015. How informative is the mouse for human gut microbiota research? Dis Model Mech [Internet]. 8:1–16. doi:10.1242/dmm.017400.
- Esper AM, Martin GS. 2011. The impact of comorbid conditions on critical illness. Crit Care Med [Internet]. 39(12):2728–2735. doi:10.1097/CCM.0b013e318236f27e.
- Huber-Lang M, Lambris JD, Ward PA. 2018. Innate immune responses to trauma. Nat Immunol [Internet]. 19(4):327–341. doi:10.1038/s41590-018-0064-8.
- Ladopoulos T. 2018. Gastrointestinal dysmotility in critically ill patients. Ann Gastroenterol [ [Internet]. Available from]. http://www.annalsgastro.gr/files/journals/1/earlyview/2018/ev-03-2018-10-AG3394-0250.pdf
- Alonso-Echanove J, Gaynes RP. Scope and magnitude of nosocomial ICU infections. [Internet]. 2001.
- Barrasa-Villar JI, Aibar-Remón C, Prieto-Andrés P, Mareca-Doñate R, Moliner-Lahoz J. 2017. Impact on morbidity, mortality, and length of stay of hospital-acquired infections by resistant microorganisms. Clin Infect Dis [Internet]. 65(4):644–652. :doi:10.1093/cid/cix411.
- Johnsen LG, Skou PB, Khakimov B, Bro R. 2017. Gas chromatography – mass spectrometry data processing made easy. J Chromatogr A [Internet]. 1503:57–64. Available from. https://linkinghub.elsevier.com/retrieve/pii/S0021967317306489.
- Li J, Sung CYJ, Lee N, Ni Y, Pihlajamäki J, Panagiotou G, El-Nezami H. 2016. Probiotics modulated gut microbiota suppresses hepatocellular carcinoma growth in mice. Proc Natl Acad Sci [Internet]. 113(9):E1306–15. doi:10.1073/pnas.1518189113.
- Li H. 2013. Aligning sequence reads, clone sequences and assembly contigs with BWA-MEM. Oxford Univ Press.
- Wang Q, Garrity GM, Tiedje JM, Cole JR. 2007. Naïve Bayesian classifier for rapid assignment of rRNA sequences into the new bacterial taxonomy. Appl Environ Microbiol [Internet] ; 73(16):5261–5267. doi:10.1128/AEM.00062-07.
- Paulson JN, Stine OC, Bravo HC, Pop M. 2013. Differential abundance analysis for microbial marker-gene surveys. Nat Methods [Internet]. 10(12):1200–1202. doi:10.1038/nmeth.2658.
- Vavrek MJ. 2011. fossil: palaeoecological and palaeogeographical analysis tools. Palaeontol Electron. 14.
- Friedman J, Alm EJ. 2012. Inferring correlation networks from genomic survey data. PLoS Comput Biol. 8(9):1–11. doi:10.1371/journal.pcbi.1002687.
- Brunk E, Sahoo S, Zielinski DC, Altunkaya A, Dräger A, Mih N, Gatto F, Nilsson A, Preciat Gonzalez GA, Aurich MK, et al. 2018. Recon3D enables a three-dimensional view of gene variation in human metabolism. Nat Biotechnol [Internet]. 36(3):272–281. doi:10.1038/nbt.4072.
- Machado D, Andrejev S, Tramontano M, Patil KR. 2018. Fast automated reconstruction of genome-scale metabolic models for microbial species and communities. Nucleic Acids Res [Internet]. 46(15):7542–7553. doi:10.1093/nar/gky537.
- Ho J, Tumkaya T, Aryal S, Choi H, Claridge-Chang A. 2019. Moving beyond P values: data analysis with estimation graphics. Nat Methods [Internet]. 16(7):565–566. doi:10.1038/s41592-019-0470-3.
- Kuhn M. 2008. Caret package. J Stat Softw. 28.
- Grau J, Grosse I, Keilwagen J. 2015. PRROC: computing and visualizing Precision-recall and receiver operating characteristic curves in R. Bioinformatics. 31(15):2595–2597. doi:10.1093/bioinformatics/btv153.
- Xiong H, Pears C, Woollard A. 2017. An enhanced C. elegans based platform for toxicity assessment. Sci Rep [Internet]. 7(1):9839. doi:10.1038/s41598-017-10454-3.
- Chawla DG, Shah RV, Barth ZK, Lee JD, Badecker KE, Naik A, Brewster MM, Salmon TP, Peel N. 2016. Caenorhabditis elegans glutamylating enzymes function redundantly in male mating. Biol Open [Internet]. 5:1290–1298. (9): doi:10.1242/bio.017442.