
ABSTRACT
Background
Increasing evidence indicates that psychopathological disorders are associated with the gut microbiota. However, data are largely lacking from long-term longitudinal birth cohorts, especially those comprising low-risk healthy individuals. Therefore, this study aims to describe gut microbiota development in healthy children from birth till age 10 years, as well as to investigate potential associations with internalizing and externalizing behavior.
Results
Fecal microbial composition of participants in an ongoing longitudinal study (N = 193) was analyzed at 1, 3 and 4 months, and 6 and 10 years of age by 16S ribosomal RNA gene sequencing. Based on these data, three clusters were identified in infancy, two of which were predominated by Bifidobacterium. In childhood, four clusters were observed, two of which increased in prevalence with age. One of the childhood clusters, similar to an enterotype, was highly enriched in genus-level taxon Prevotella_9. Breastfeeding had marked associations with microbiota composition up till age 10, implying an extended role in shaping gut microbial ecology. Microbial clusters were not associated with behavior. However, Prevotella_9 in childhood was positively related to mother-reported externalizing behavior at age 10; this was validated in child reports.
Conclusions
This study validated previous findings on Bifidobacterium-enriched and -depleted clusters in infancy. Importantly, it also mapped continued development of gut microbiota in middle childhood. Novel associations between gut microbial composition in the first 10 years of life (especially Prevotella_9), and externalizing behavior at age 10 were found. Replications in other cohorts, as well as follow-up assessments, will help determine the significance of these findings.
Introduction
The gut microbiota, mainly consisting of a vast number of bacteria,Citation1 inhabits the gut of coelomate animals and has co-evolved with the hosts.Citation2 These resident microorganisms play a crucial role in many aspects of health, including nutrition, immunity and neurophysiology.Citation3–5 Evidence is accumulating that the gut microbiota also plays a crucial role in aspects of mental health and behavior.Citation5 Therefore, maintaining normal diversity and function of the gut microbiota throughout development is essential for physical and mental health. The current study investigates gut microbial development from infancy to middle childhood, as well as potential relations of the gut microbiota with behavioral measures in healthy children.
In humans, infancy is commonly recognized as a critically important period for microbiota to colonize the gut.Citation6 Before weaning, a healthy gut microbiota community is predominated by Bifidobacterium.Citation7 Next to the Bifidobacterium-predominated type, researchers have identified several other infant gut bacterial types using cluster analyses. The identified clusters are characterized by Bacteroides, Streptococcus, Enterobacteriaceae or Staphylococcaceae,Citation8–10 and are thought to develop as a result of complex extrinsic factors, such as child sex, birth weight, delivery mode, diet, and antibiotics.Citation11–19 Changes in extrinsic factors can also lead individuals to transition between different clusters.Citation20 While some studies suggested that by age 3, children have gut microbial profiles that strongly resemble those observed in adults,Citation21,Citation22 other cross-sectional studies concluded that an adult-like gut microbial ecosystem has not yet been completely established at this age.Citation23–25 Compared to healthy adults, the fecal microbiota of healthy toddlers is characterized by a higher relative abundance of Bifidobacterium.Citation23 Remarkably, Bifidobacterium remains more abundant in healthy school-aged children and older-aged adolescents, as compared to healthy adults.Citation24,Citation25 All of these cross-sectional studies imply that gut microbiota development may extend longer into childhood than previously thought, potentially due to long-term impacts of early extrinsic factors. However, information on healthy gut microbial development from longitudinal studies is largely lacking.
Researchers have gradually revealed a bidirectional communication between the gut microbiota and the host brain along the microbiota-gut-brain axis (MGBA), based on accumulating evidence from both animal and human studies mostly focused on clinical mental disorders, such as major depressive disorders and bipolar depression.Citation5,Citation26–35 In humans, childhood is regarded as a critical phase for behavioral problems to start emerging. Numerous studies showed that elevated childhood behavioral problems, such as internalizing (i.e., behavioral problems influencing children’s internal psychological environment, such as anxiety, depression, somatization, and social withdrawal symptoms) and externalizing problems (i.e., behavioral problems manifested in outward behavior such as antisocial behavior, aggression, hyperactivity, acting out, and hostility)Citation36 are associated with higher chances of developing mental disorders and risky lifestyles in adulthood, which may in turn result in premature mortality.Citation37–40 However, investigations about the MGBA in childhood are still at an early stage. Most of the existing studies are cross-sectional and mainly focused on children diagnosed with psychological disorders, such as autism spectrum disorder (ASD) and attention deficit/hyperactivity disorder (ADHD).Citation41–43 Three previous longitudinal studies on community samples have reported associations of the gut microbiota with temperament, cognition, and behavioral problems in children until age 2 years.Citation44–46 Two papers identified bacterial clusters associated with different behavioral patterns,Citation44,Citation45 while the third found increased internalizing problems in a Prevotella-depleted group.Citation46 However, no studies have longitudinally investigated these links in healthy children beyond age 2.
The present study has two goals. First, we aimed to describe the normative development of the gut microbiota from birth till age 10 in a healthy community sample. To our knowledge, this has not been done before. We evaluated both short- and long-term associations of the gut microbial composition with extrinsic factors (i.e., birth weight, child sex, delivery mode, breastfeeding, and antibiotics) and determined whether the gut microbiota could be clustered into different successional patterns throughout the first 10 years on the basis of variance in microbial composition. Second, we aimed to investigate potential associations of the gut microbiota with internalizing and externalizing behavior in middle childhood in the same cohort. For this second aim, we raised three broad hypotheses based on scarce literature: internalizing and externalizing behavior would (1) differ between bacterial clusters; (2) explain general variance in microbial composition; (3) be related to alpha diversity or relative abundances of specific bacteria.
Results
First aim: gut microbiota development in the first 10 years of life
Gut bacterial clusters and transition patterns
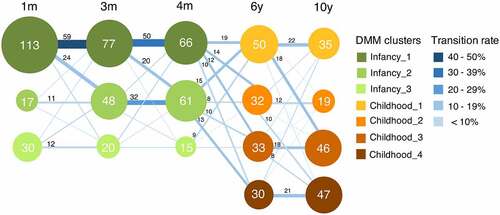
To track gut microbiota development throughout infancy and childhood in the first 10 years of life, we stratified the participants into bacterial clusters based on their compositional features at the genus level by Dirichlet multinomial mixture (DMM) models. Based on microbial community composition, three bacterial clusters were obtained in infancy, and four clusters were found in childhood (). While some individuals maintained the same bacterial composition over infancy or childhood, others transitioned to a different bacterial cluster when becoming older. At 1 month of age, 70.6% (113/160) of the infants belonged to Infancy_1, while fecal microbiota of 10.6% (17/160) and 18.8% (30/160) of the infants was classified as Infancy_2 and Infancy_3, respectively. Notably, the prevalence of Infancy_2 continuously increased with age throughout infancy, while the proportions of the other two clusters decreased. From infancy to childhood, no obvious transition pattern was observed. At age 6, Childhood_1 included 34.5% (50/145) of the children, while the other three clusters evenly shared the rest. From age 6 to 10, for individuals belonging to Childhood_1, 44.0% (22/50) remained in the same cluster, and another 36.0% (18/50) converted to Childhood_3. Similar transition patterns were also discerned in Childhood_2, of which 37.5% (12/32) of children remained in the same cluster, and another 31.3% (10/32) transitioned to Childhood_4. Meanwhile, 61.9% (39/63) of the children, belonging to either Childhood_3 or Childhood_4, stayed in the same clusters at age 10. As a consequence, 63.3% (93/147) of children ended up in Childhood_3 and Childhood_4 when reaching age 10.
Figure 1. Transition between bacterial clusters in the first 10 years of life. Nodes represent clusters, with colors identifying a compositional cluster. Clusters were identified based on their compositional features at the genus level by Dirichlet multinomial mixtures (DMM) models. The size of the node indicates the number of individuals belonging to this cluster, which is displayed in the node. Lines are sized and colored based on the transition rate, with adjacent numbers representing the number of individuals transitioning from one cluster to another with increasing age. The numbers with transition rates below 6.0% are not shown.
Characteristics of gut bacterial clusters
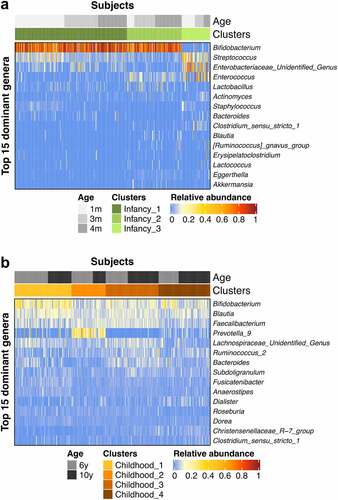
Both Infancy_1 and Infancy_2 clusters were predominated by Bifidobacterium, and significantly differed in relative abundances of Streptococcus, an unidentified genus within the Enterobacteriaceae and Enterococcus (). Infancy_1 showed higher relative abundances of Streptococcus and an unidentified genus within the Enterobacteriaceae, and lower relative abundance of Enterococcus, in relation to Infancy_2. Compared to Infancy_1 and Infancy_2, Infancy_3 was depleted in Bifidobacterium but enriched in Streptococcus, Enterococcus and an unidentified genus from Enterobacteriaceae. In childhood, Bifidobacterium was among the most predominant genera, albeit at varying relative abundances (). In Childhood_1 Bifidobacterium was most predominant as compared to other genera, whereas Childhood_2 was predominated by Prevotella_9 at an average relative abundance of 24.5 ± 14.4%, which was much higher than in other clusters (Chilhood_1, 4.1 ± 11.4%; Childhood_3, 0.1 ± 1.0%; Childhood_4, 3.3 ± 4.4%).
Figure 2. Heatmaps showing the relative abundances of the top 15 predominant genera in the bacterial clusters in infancy (a) and childhood (b).
To further describe the features of bacterial clusters, we compared the phylogenetic alpha diversity and beta diversity between them (Figures S1 and S2). Significant differences in alpha diversity indices between bacterial clusters reflected the results of DMM clustering in the current study.
To describe the potential functional differences between bacterial clusters, we exploratorily applied the Picrust2 (phylogenetic investigation of communities by reconstruction of unobserved states) method,Citation47,Citation48 based on 16S rRNA gene sequence data. In total, 2651 KEGG orthologs and 288 MetaCyc pathways were obtained over the study period. In infancy, 14 KEGG orthologs with average relative abundances more than 0.5% were significantly different between bacterial clusters after FDR adjustment (Table S20), while 13 KEGG orthologs differed significantly in childhood (Table S21). We found the function beta-galactosidase was predicted to be decreased in bacterial cluster Infancy_3 (0.19 ± 0.16%) compared with Infancy_1 and Infancy_2 (0.68 ± 0.17 and 0.67 ± 0.19%). In later life, beta-glucosidase was observed significantly increased in Childhood_2 (0.84 ± 0.17%) as compared to the other three childhood bacterial clusters (0.67 ± 0.16, 0.62 ± 0.07, and 0.6 ± 0.11%). Regarding MetaCyc pathways with average relative abundances more than 0.5%, 72 of them were significantly different after correction in infancy (Table S22), and 88 differed significantly in childhood (Table S23). These MetaCyc pathways mainly covered degradation and biosynthesis of carbohydrates and amino acids. In the first several months, pathways of Bifidobacterium shunt, mixed acid fermentation, L-arginine biosynthesis I and II, and superpathway of aromatic amino acid biosynthesis were significantly reduced in Infancy_3 as compared to Infancy_1 and Infancy_2. Pathways of L-arginine biosynthesis I and II were observed significantly depleted in Childhood_2 as compared to the other three bacterial clusters in childhood.
In addition to microbial compositional features, we also exploratorily investigated whether bacterial clusters differed on population characteristics, namely delivery mode, child sex, breastfeeding, medications, diseases, etc., in infancy and childhood (Tables S1 and S2). Delivery mode was significantly different between infant bacterial clusters, of which Infancy_3 showed highest rates in C-section and assisted vaginal delivery. Food frequency was also compared between bacterial clusters in childhood, and no significant differences were observed (Table S3).
Associations of gut microbial composition with extrinsic factors
To determine to what extent extrinsic factors (i.e., birth weight, child sex, delivery mode, breastfeeding, and antibiotics) can explain the observed variation in microbiota composition, their simple effects (i.e., the impact of one factor on gut microbiota without taking other factors into account) were measured separately per time point, as well as for all infancy and childhood samples, respectively (Tables S4 and S5). In infancy, breastfeeding significantly explained 1.0%, 1.4% and 1.2% of adjusted variances without the biases in microbial composition, in separate analyses at age 1, 3 and 4 months. None of the other factors tested, i.e., delivery mode, birth weight and child sex, significantly contributed to explaining the observed variation in microbial composition, in separate analyses at infancy time points. In childhood, no significant simple effects were observed at single time points.
In analyses pooling all infancy samples together, child age was found having the most predominant significant effect (1.0%), followed by breastfeeding and delivery mode (0.7% and 0.2%). With respect to simple effects of extrinsic factors in childhood, breastfeeding significantly explained around 0.3% of adjusted variance in microbial composition in the pooled data of ages 6 and 10. Similar to infancy, in the period from age 6 to 10, child age significantly explained the most observed variance in microbial composition (0.9%) as compared to other extrinsic factors of which only breastfeeding explained significant variance (0.3%).
Next to it, we measured conditional effects (i.e., the impact of individual factors when partitioning out effects from other factors) of the significant extrinsic factors obtained from pooled data (). These extrinsic factors included (1) Child age, delivery mode, and breastfeeding for infancy and (2) Child age and breastfeeding for childhood. After partitioning out total explained variance, selected infancy and childhood extrinsic factors were still able to significantly explain partial variance.
Table 1. Conditional effects of extrinsic factors with significant simple effects on gut microbiota in infancy and childhood
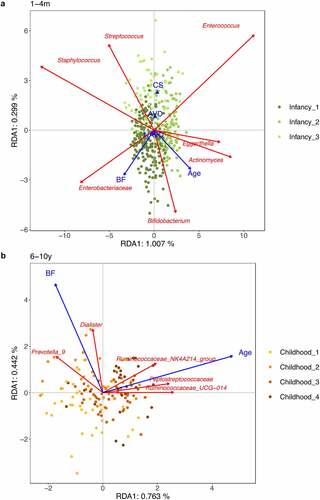
To gain more insights into the associations between the gut microbiota and extrinsic factors with significant conditional effects, we performed analyses on the pooled infancy data and the pooled childhood data (). During infancy, breastfeeding was positively associated with increased relative abundances of Bifidobacterium and an unidentified genus within Enterobacteriaceae. Infants with C-section showed higher levels of Streptococcus and Enterococcus, and lower levels of Bifidobacterium. With increasing age from 1 to 4 months, Bifidobacterium, Actinomyces and Eggerthella also increased in relative abundances. Over childhood, age was positively related to higher relative abundances of unidentified genera from the Ruminococcaceae and Peptostreptococcaceae. In the same age period, higher breastfeeding was associated with higher relative abundances of Prevotella_9 and Dialister.
Figure 3. RDA plots of extrinsic factors with significant conditional effects on gut microbial composition. (a) RDA plot based on microbiota profiles at the age of 1, 3 and 4 months. (b) RDA plot based on microbiota profiles at the age of 6 and 10 years. RDA plots are displayed based on Bray-Curtis distance matrices computed from log-transformed data at the genus level. Unidentified genera are shown at the family level. To clarify, we displayed adjusted variances along axes, which were corrected to be without biases. Generally, the value of adjusted variances is less than that of original variances. CS: C-section. AVD: assisted vaginal delivery. NAVD: non-assisted vaginal delivery. BP: breastfeeding proportion.
Second aim: associations of the gut microbiota with internalizing and externalizing behavioral measures in middle childhood
Bacterial clusters and behavior
We did not find any significant associations between bacterial clusters and child internalizing and externalizing behavior (Figures S3 and S4).
RDA models
Before exploring associations between the gut microbiota and behavioral measures, we first assessed which behavioral measures were capable of significantly explaining variance in microbial composition with and without accounting for the extrinsic factors studied in the first aim, by using Redundancy Analysis (RDA) models. Without accounting for these factors, internalizing behavior, evaluated by the Strengths and Difficulties Questionnaire (SDQ) maternal reports at 10 years of age, was able to explain the variance in microbial composition at 1 month of age (p = 0.050; Table S6).
As for samples in childhood (Table S7), maternal-reported externalizing behavior, measured by the SDQ at age 10, significantly explained variance in gut microbial composition at age 6. Remarkably, we found both internalizing and externalizing behavior, assessed by the maternal SDQ at age 10, were able to significantly explain variation in the gut microbiota in the period from age 6 to 10. When taking also significant extrinsic factors into account, i.e., child age and breastfeeding (), we found that the maternal SDQ reports of externalizing behavior at age 10 still significantly explained variance in microbial composition during childhood. However, internalizing behavior was no longer significant in this model.
Table 2. Partial variance in microbial composition in childhood explained by behavioral problems at age 10 as reported by the mother (SDQ)
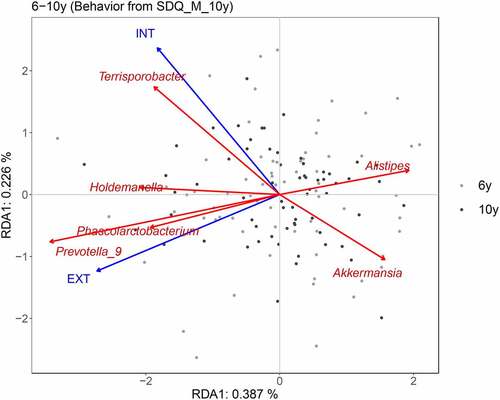
To specifically explain the associations of pooled gut microbiota of ages 6 and 10 with internalizing and externalizing behavior assessed by the maternal SDQ at age 10, partial RDA was performed by accounting for age and breastfeeding (). Externalizing behavior showed positive associations with relative abundances of Prevotella_9 and Phascolarctobacterium. In addition, more internalizing behavior was related to reduced relative abundance of Akkermansia, and more externalizing behavior was associated with decreased relative abundance of Alistipes. Finally, a higher relative abundance of Terrisporobacter was found in individuals with higher internalizing behavior scores.
Figure 4. Partial RDA plot indicating associations of genera in childhood with internalizing and externalizing behavior at age 10 as reported by the mother (SDQ). RDA plots are displayed based on Bray-Curtis distance matrices calculated from log-transformed data at the genus level. Child age and breastfeeding were accounted for. To clarify, we displayed adjusted variances along axes, which were corrected to be without biases. Generally, the value of the adjusted variance was less than that of the original variance. INT: internalizing behavior. EXT: externalizing behavior.
PRC models
In order to assess emerging associations of gut microbiota composition as measured during early infancy and childhood with internalizing and externalizing behavior at age 10, we performed Principal Response Curves (PRC) analyses (). This method can be used to assess temporal trajectories of dissimilarity between behavior groups with different scores, and to select genera with relatively large changes in relative abundances across the first 10 years of life. With respect to internalizing behavior, measured by the maternal SDQ at age 10, no obvious differences were observed between high (H) and low/medium (L + M) score groups in the first 4 months of life, whereas the dissimilarity in microbial composition between groups started changing somewhere between 4 months and 6 years.
Figure 5. PRC analysis of internalizing (a) and externalizing behavior (b) at age 10 as reported by the mother (SDQ). Behavior groups are set based on quartiles. H level includes individuals with scores in the top quartile, and L+M level includes the bottom three quartiles. L+M level is used as reference (Low+Medium; baseline). Canonical coefficients indicate the differences between H and L+M. The wider the distance between H and L+M, the more dissimilar they are to each other. The taxon weight reflects for which taxa the compositional variation is best represented by the PRC model. The direction of abundance change is determined jointly by the signs of canonical coefficient and taxon weight. Same signs indicate increased relative abundance, while reverse signs represent reduced relative abundance. Genera with absolute values of taxon weights less than 0.60 are not displayed. Genera data was pre-processed with log-transformation.
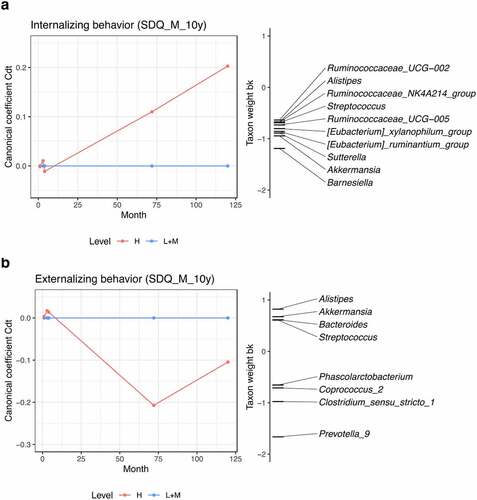
Similarly, with respect to externalizing behavior, measured by the same questionnaire at the same age, differences between behavior groups started emerging between 4 months and 6 years. Among the time points included in this study, the difference between groups of externalizing behavior was highest at age 6, and then decreased again at age 10. Children belonging to the top quartile (H), tended to show higher levels of Prevotella_9 and Clostridium_sensu_stricto_1, and reduced relative abundances of the genera Alistipes, Akkermansia, Bacteroides and Streptococcus (). As the coefficients for group H are negative compared to the baseline, negative taxon weights indicate positive correlations.
Furthermore, we compared the differences in relative abundances of the genera selected from PRCs between behavior groups at each age. With respect to internalizing behavior, the genera Akkermansia, Alistipes, Sutterella, Barnesiella, and two genus-level groups of Eubacterium were observed reduced in individuals belonging to the H group at age 10, although not significantly after FDR adjustment (Table S8). As for externalizing behavior, Alistipes was depleted, and Phascolarctobacterium, Coprococcus_2, Clostridium_sensu_stricto_1 and Prevotella_9 were increased in relative abundances in the H group at age 6 (Table S9). After FDR correction, Clostridium_sensu_stricto_1 and Prevotella_9 were observed with p values less than 0.10. At age 10, the relative abundance of Clostridium_sensu_stricto_1 remained higher in H group individuals, albeit insignificant after FDR correction.
MLM models
Multilevel models (MLM) were used due to their ability in processing time-series data. These models included the following extrinsic factors: child age, delivery mode, breastfeeding, birth weight, and child sex in infancy, and the same factors, as well as age of solid food introduction and antibiotic treatments, in childhood. For the maternal SDQ at age 10, we found that internalizing behavior was moderately positively related to phylogenetic alpha diversity during infancy (), while externalizing behavior was not related to alpha diversity or relative abundances of specific genera in infancy. In childhood, Alistipes was found to be significantly negatively associated with externalizing behavior assessed by the maternal SDQ at age 10. In addition, higher relative abundances of Prevotella_9 and Phascolarctobacterium were significantly associated with increased externalizing behavior. Interestingly, similar associations of Prevotella_9 and Phascolarctobacterium with externalizing behavior were further validated in the SDQ child reports at age 10 (Table S10). MLM models were also conducted for behavior assessed by the maternal CBCL at age 6, however, no consistent associations were found (Table S11).
Table 3. MLM models for internalizing and externalizing behavior at age 10 as reported by the mother (SDQ)
Discussion
In our study, three distinct bacterial clusters were identified in samples taken during the first 4 months of life. This is in line with previous studies focusing on the first half year of life,Citation8–10 both for the number of clusters and the bacterial cluster composition. Regarding Infancy_1 and Infancy_2, they were predominated by Bifidobacterium with numerical predominance values at 77.5 ± 20.9% and 75.2 ± 20.4%, which are similar to the numerical predominance values of Bifidobacterium-predominated clusters in the three previous studies.Citation8–10 Contrary to the Bifidobacterium-enriched clusters, Infancy_3 was depleted in Bifidobacterium but enriched in Streptococcus and an unidentified genus within Enterobacteriaceae; these characteristics were also found in previously reported clusters.Citation8–10 Notably, the identification of these Bifidobacterium-depleted clusters varies between studies. For instance, Dogra et al. found two, rather than one, Bifidobacterium-depleted clusters, enriched in Streptococcus and Enterobacteriaceae, respectively.Citation10 This may be due to the differences in clustering methods and study populations. Also, Borewicz et al. described a Bacteroides-predominated cluster that was absent in our study.Citation8 High intra-individual variability of the gut microbiota may explain these different findings, since we used the same clustering method and included participants from the same country as Borewicz et al. Future large-scale studies and meta-analyses may help clarify these clustering issues in infant populations.
Remarkably, the infant cluster transition patterns in our study were highly similar to those previously reported by other studies.Citation10,Citation49 The prevalence of Bifidobacterium-enriched clusters was increased from 1 to 4 months of age, while the ratio of Infancy_3 was reduced. Infancy_3 was identified with the highest proportion of C-section and assisted vaginal deliveries, while no differences in breastfeeding were observed between infant clusters in our study. The shift toward a Bifidobacterium-enriched microbial community in infants from the Infancy_3 cluster may imply a quick adaption to environmental changes, such as the initiation of breastfeeding. Given the similarity between Infancy_1 and Infancy_2, generating more specific profiles of Bifidobacterium species and strains may help enhance their differentiation. In sum, our study provides further support on the consistency of gut bacterial clusters in infancy, regardless of differences between studies in sample size, collection period and clustering method.
In fecal samples taken at 6 and 10 years of age, we distinguished four bacterial clusters and delineated how children transitioned between these clusters, with two clusters separately predominated by Bifidobacterium and Prevotella_9 and the other two enriched in Bifidobacterium, Blautia and Faecalibacterium. Our clusters showed similarities and differences to those of a recent study by Zhong et al. in healthy Dutch school-aged children (mean age 7.3 years, ranging from 6 to 9).Citation50 Our Childhood_1 closely resembled the Bifidobacterium-dominated cluster reported by Zhong et al. and showed a similar relative abundance of Bifidobacterium at 21.6 ± 12.0%. In adults, the relative abundance of Bifidobacterium normally ranges from 2% to 14%.Citation51 The other three childhood clusters observed in our study were within this range. Although a Bifidobacterium-predominated microbiota is commonly known to be beneficial for infants, this type of cluster may lack maturity in children and adults.Citation20 Moreover, Childhood_1 displayed the lowest diversity among all four clusters (Fig. S1; also reported by Zhong et al.). This finding further supports the notion of immaturity of Childhood_1, as the lower diversity may be paired to a corresponding lower functional potential that may not fully meet the requirements of complex carbohydrate utilization and butyrate production in later life.Citation50 Childhood_2 was similar to a Prevotella-predominated cluster observed by Zhong et al., and also to one of the three human adult enterotypes.Citation52 These microbial community types exhibit approximately 20% of Prevotella, a genus positively associated with carbohydrate intake and fiber consumption.Citation53,Citation54 In contrast to the findings of Zhong et al., in our study, no Bacteroides-predominated cluster was found. Although Childhood_3 showed the highest level of Bacteroides across our clusters, the relative abundance of this genus (6.6 ± 4.4%) was lower than in the corresponding community type reported by Zhong et al. (near 20%). Childhood_3 was enriched in a group of near evenly distributed genera, including Bifidobacterium, Blautia, Faecalibacterium, and an unidentified genus within Lachnospiraceae (12.3 ± 6.2%, 10.2 ± 3.1%, 10.0 ± 3.5% and 8.49 ± 5.6%). Childhood_4 had similar levels of Bifidobacterium and Blautia (13.3 ± 10.2% and 8.9 ± 4.2%) as Childhood_3, while comprising lower levels of Faecalibacterium and an unidentified genus within Lachnospiraceae (5.9 ± 3.2% and 3.7 ± 4.4%) than Childhood_3. Both Childhood_3 and Childhood_4 showed more diverse and more evenly distributed microbiota than Bifidobacterium-predominated Childhood_1 and Prevotella_9-predominated Childhood_2; these features may allow more complex functions in Childhood_3 and Childhood_4, and hence may mark a mature gut microbiota community for children in middle childhood or at a later age.
The differences between the studies may be attributed to age, as Zhong et al. included consecutive time points from age 6 to 9, while the present study was specifically focused on ages 6 and 10. This particular period, spanning 4 years and reaching into early puberty, may be of relevance for gut microbial development. Indeed, from age 6 to 10, we observed an overall progressive transition of children from Childhood_1 and Childhood_2 to Childhood_3 and Childhood_4, both displaying higher alpha diversity than the other two clusters, hinting at a trend toward increasing microbial functional capacity from age 6 to 10. This also indicates that in healthy children gut microbial development appears to continue at least until early puberty. Though diet is regarded as an important factor influencing the gut microbiota, we did not find differences between childhood bacterial clusters with respect to the children’s dietary intake. Note, however, that this may be due to the fact that we only measured food frequency at age 10, while the gut bacteria were assessed at ages 6 and 10.
We further investigated potential functional differences of the gut microbiota between bacterial clusters in an exploratory manner by using the Picrust2 approach. In general, we noticed that multiple predicted metabolic functions (i.e., KEGG orthologs and MetaCyc pathways) varied between bacterial clusters in infancy and childhood. For example, in infancy, we observed that the level of KEGG ortholog beta-galactosidase, an enzyme catalyzing the hydrolysis of beta-galactosides like lactose, was lower in Infancy_3 in comparison with the other two infant bacterial clusters. Beta-galactosidase has been found prevalent in Bifidobacterium species.Citation55 Consistent with this, Infancy_3 showed the lowest level of Bifidobacterium; hence, the depletion of Bifidobacterium may explain the reduction of beta-galactosidase in Infancy_3. In childhood, we found that the relative abundance of the KEGG ortholog beta-glucosidase, an enzyme hydrolysing various glycosides like cellulose coming from plant foods, was highest in bacterial cluster Childhood_2. Childhood_2 was enriched in a fiber-favoring bacterium Prevotella_9. As a consequence, this cluster can be considered to have a higher ability of utilizing cellulose, which is in line with our finding. As for differences in MetaCyc pathways, we observed that the biosynthesis of precursors (i.e., aromatic amino acids) for neurotransmitters (i.e., serotonin, dopamine and norepinephrine), was decreased in Infancy_3. This bacterial cluster also showed decreases in mixed acid fermentation and Bifidobacterium shunt, which might indicate a reduction in short-chain fatty acids (SCFAs) production. Although the role of SCFAs on the MGBA has not been clearly elucidated, they are speculated to have considerable impacts.Citation56 In both Infancy_3 and Childhood_2, we noticed decreased levels in predicted functions of L-arginine biosynthesis I and II. L-arginine supplementation has been reported to stimulate glutamate decarboxylation in Lactococcus lactis, which in turn increases the production of the neurotransmitter gamma-aminobutyric acid (GABA).Citation57 However, it is unknown if other bacteria have similar interactions of L-arginine with GABA. Finally, note that there are two main limitations of any function prediction tool based on marker genes such as Picrust2.Citation47 The first is the bias caused by the reference database, and the second is that the resolution cannot distinguish strain-specific functionality. Hence, these findings of predicted functions must be seen as exploratory and interpreted with caution.
Regarding extrinsic factors, breastfeeding was found to explain a moderate amount of variance in infant gut microbial composition, similarly to our previous findings in which breastfeeding explained 2–6% of the variance.Citation58 In line with previous studies,Citation18,Citation21,Citation59 increased breastfeeding was found related to higher levels of Bifidobacterium in the first 4 months of life. Surprisingly, early-life breastfeeding was also associated with the gut microbiota in the period from 6 to 10 years of age. This finding tied well with observations by Zhong et al., who uncovered a persistent effect of breastfeeding duration on the gut microbiota based on community samples at school age.Citation50 Although it is widely accepted that breastfeeding only prominently affects the gut microbiota in infancy or early childhood,Citation18,Citation60 both Zhong’s and our findings may indicate an extended influence of breastfeeding on shaping microbial composition and even function. In addition, we found that breastfeeding was positively associated with increased Prevotella_9 in childhood. Prevotella, as a genus prevalent in populations consuming fiber,Citation53 has been found tightly linked to glucose metabolism.Citation61 However, in this study, it is unknown if the increased level of Prevotella_9 is caused by breastfeeding or other relevant dietary factors. In a recent study based on another population, we found that longer exclusive breastfeeding duration was associated with a healthier child diet at age 3 years,Citation62 note though that, as mentioned before, diet at age 10 was unrelated to child gut microbiota. Further studies aiming to validate this association and explore causality are hence needed to clarify these issues. With respect to antibiotic use, due to the fact that very few infants were treated with antibiotics in our study, we did not take early antibiotic use into consideration. Note, however, that in populations where antibiotic use in infants is commonplace, antibiotic treatments should be included as a potential confounder as there is evidence that they not only affect the gut microbial composition but might also affect later neurodevelopment.Citation63–65
Regarding associations between the gut microbiota and child behavior, we found no associations of the bacterial clusters with internalizing and externalizing behavior measured by maternal and child reports at age 6 and 10. In earlier studies, clustering methods were also adopted with the aim of exploring links of the child gut microbiota with subsequent temperament at 6 months and cognition at 2 years.Citation44,Citation45 Compared to these studies in which the microbial composition was analyzed at one selected time point, in the present study we used five time points in the first 10 years of life to more comprehensively delineate relations between the bacterial clusters and problem behavior. Although we did not find that bacterial clusters were related to problem behavior in our study, this does not imply that clustering methods were inappropriate to use. Indeed, clustering methods are highly suitable for high-dimensional data. Also, it is worth noting that there can be a moderate relation between the gut microbiota and problem behavior, the substantiation of which might require larger datasets to reflect this relation. Furthermore, variation in microbial composition does not directly provide information about differences in microbial function involved in MGBA. In other words, different microbial communities may hold similar gene potential. Limited by the 16S rRNA sequencing technique, we were only able to explore function with the Picrust2 method in the current data. This method has shortcomings that can be avoided by using metagenomics in combination with metabolomics analyses in future studies.
With respect to specific bacteria, based on several complementary statistical methods, including RDA, PRC and MLM models, we found that the relative abundances of Prevotella_9 and Phascolarctobacterium in samples taken at age 6 to 10 were positively associated with increased mother-reported externalizing behavior at age 10, while a negative association was observed in the level of Alistipes with the same externalizing behavior at the same age. A previous longitudinal study in toddlers found that a higher relative abundance of Prevotella at 1 year of age was related to more internalizing behavior, but not externalizing behavior, at age 2.Citation46 The large age gap and different assessment moments may explain the differences between the two studies. Comparing our findings with studies focusing on children with psychopathology, we find that autistic children (4 to 11 years), commonly exhibiting co-occurring externalizing problems,Citation66 showed increased abundances of microbial groups including Prevotella, Bacteroides and Porphyromonas, compared to healthy controls.Citation67 In contrast, another study found that Prevotella was reduced in children with autism (3 to 16 years).Citation68 Apart from autism, ADHD has also been shown to be associated with externalizing behavior in adolescence.Citation69 For children with ADHD, two previous studies reported no changes in Prevotella abundance,Citation43,Citation70 whereas Kristensen et al. found decreased levels of Prevotellaceae.Citation71 In sum, there is no well-defined link between Prevotella and behavioral problems and mental disorders, just as at the physical health level, Prevotella has been related to the consumption of beneficial plant-rich diets, but also to harmful chronic inflammation.Citation72 As a large genus, Prevotella includes around 40 different species that greatly vary in their genetic potential.Citation72 In this case, using metagenomic analyses to characterize the Prevotella population at higher taxonomic resolution, i.e., species or strain level, would be helpful to better understand a more specific potential interaction with host behavior. With respect to Phascolarctobacterium, a systematic review showed its relative abundance was higher in patients with major depressive disorder (MDD) than controls,Citation73 while Li et al. reported that it was positively related to improved mood in adults with the same dietary structure.Citation74 Though these studies reflect that Phascolarctobacterium is related to internalization-relevant mental problems, it is worth noting that internalizing and externalizing behavior can co-exist in children and may lead to opposite behavioral problems at a later age.Citation75–77 As for Alistipes, earlier studies found its role was divergent in MDD and ASD.Citation41,Citation67,Citation73 As described earlier, distinct behavioral issues can co-occur and even predict the opposite one in the same child; this does not only work for MDD but also for ASD which is often accompanied by greater aggression.Citation78 Given the complexity of mental problems, the associations of Phascolarctobacterium and Alistipes with externalizing behavior need to be interpreted with caution.
Strengths of this study include the prospective, lengthy longitudinal design with repeated gut microbial sampling in healthy community children. Additionally, behavioral measures were reported by both mothers and children and at two different ages, and a series of sophisticated and complementary statistical analyses were performed. A limitation of the study is the restricted taxonomic resolution of the 16S rRNA gene sequence data used in this study, which does not permit us to distinguish bacteria at the species or strain level.
In sum, in this study we identified three bacterial clusters in infancy and four in childhood and explored transitional trajectories of individuals through these clusters in the first 10 years of life. These clusters exhibited similarities as well as differences to previously identified clusters. Among the different extrinsic factors studied, breastfeeding stood out by having marked associations with the gut microbiota up till age 10, implying an extended role in shaping gut microbial ecology. With respect to problem behavior, high relative abundances of Prevotella_9 and Phascolarctobacterium and a low level of Alistipes in middle childhood were associated with increased externalizing behavior at age 10. In the future, strain-resolved metagenomic sequencing, as well as specific sets of qPCR assays, can provide a better understanding of the potential role of Prevotella_9 in child behavior. Additionally, determining behaviorally relevant fecal metabolites will help bridge the gap between association and causality. Finally, to take a step further in understanding the development of the gut microbiota throughout childhood, as well as its relations with child behavioral phenotypes, healthy longitudinal cohorts with a higher frequency of gut microbial sampling (e.g., yearly samples throughout childhood) are direly needed.
Materials and methods
Participants
Participants were identified from an ongoing longitudinal Dutch study named BIBO (Basale Invloeden op de Baby Ontwikkeling),Citation79 consisting of healthy low-risk individuals (N = 193), with approval from the ethical committee of the Faculty of Social Sciences of the Radboud University (ECG300107, ECG13012012, SW2017-1303-497 and SW2017-1303-498).
Data collection procedures
Parents were instructed to collect fecal samples in sterilized plastic tubes by using the scoop attached to the tube cap, when their children were 1, 3 and 4 months of age, and 6 and 10 years of age. Infancy samples were collected from diapers, and childhood samples were collected immediately after defecation from potties or toilets without contact with the toilet water. The tubes were then placed in clean plastic bags provided by investigators before being temporarily kept in the freezer (−20°C). Samples were transported to the Laboratory of Microbiology at Wageningen University and stored at −80°C before being processed. A total number of 739 fecal samples were collected at these five timepoints. Participants with at least one fecal sample at these assessment moments were included in the present study (N = 187).
Behavioral measures were collected with questionnaires at 6 and 10 years of age. Additionally, we recorded the following variables as extrinsic factors that may predict variance in the gut microbiota: child age, child sex, birth weight, delivery mode, frequency of breastfeeding and formula intake in the first 27 weeks of life (mothers were required to weekly record the average number of breastfeeding and formula intake per day), the age of first solid food introduction, and use of antibiotics in the first 10 years of life.Citation80,Citation81 Finally, we also measured dietary intake at age 10 by a food frequency questionnaire.
Measures
Gut microbiota composition
In brief, DNA extraction was performed using the Maxwell 16 Total RNA system (Promega, Wisconsin, USA) with 0.01–0.13 g of fecal sample and Stool Transport and Recovery Buffer (STAR; Roche Diagnostics Corporation, Indianapolis, IN), as reported previously.Citation82 Amplification was performed on the V4 region of 16S ribosomal RNA (rRNA) gene in duplicate, generating amplicons with a length of around 290 bp.Citation82 Each PCR reaction comprised of 10 µl of 5x Phusion Green HF Buffer (Thermo Scientific, US), 1 µl of 10 µM barcoded primers 515 F-n(5’-GTGYCAGCMGCCGCGGTAA-3’) and 806 R-n(5’- GGACTACNVGGGTWTCTAAT-3’),Citation83,Citation84 1 µl of 10 mM dNTPs mix (Promega Corporation, US), 0.5 µl of 2 U/µl Phusion Green Hot Start II High-Fidelity DNA polymerase (Thermo Scientific, US), 36.5 µl of Nuclease-free water and 1 µl of 20 ng/µl DNA template. PCR was carried out as previously described,Citation82 with modification: initial denaturation (98°C, 30 s), 25 cycles of denaturation (98°C, 10 s), annealing (50°C, 10 s), extension (72°C, 10s), and elongation (72°C, 7 min). The presence and length of PCR products was then verified by gel electrophoresis. PCR products were purified by the HighPrep® PCR kit (MagBio Genomics, Alphen aan den Rijn, Netherlands), according to the instructions of the kit. DNA concentration of purified samples was measured using a fluorometer (DS-11; DeNovix) with Qubit® dsDNA BR Assay Kit (Life Technologies, Leusden, Netherlands). Two hundred nanograms of barcoded samples was pooled in libraries comprising 69 uniquely tagged samples, 2 of which were artificial control communities representative of human gut microbiota.Citation85 The mixture was purified again by HighPrep® PCR kit to a final volume of 40 µl.
16S rRNA gene sequencing was completed on the Illumina sequencing platform at Eurofins Genomics, Germany. NG-Tax was used for processing of 16S rRNA gene sequence data.Citation85,Citation86 Only reads with matching barcodes were kept. Subsequently, amplicon sequence variants (ASVs) were identified on a per sample basis. Taxonomic assignment of ASVs was performed referring to SILVA_132_SSU 16S rRNA gene reference database.Citation87 A total of 113,413,327 reads were obtained from the sequencing. Basic descriptions of reads, ASVs and genera numbers were displayed in Table S16.
Behavioral measures
CBCL
The Child Behavior Checklist 4–18 (CBCL) is a 118-item questionnaire, assessing problem behaviors of children from ages 4 to 18, scored on a 3-point scale.Citation88 The CBCL includes internalizing and externalizing subscales. Higher scores indicate more behavioral problems. Mothers were required to complete the CBCL when their children were 6 years old.
SDQ
The Strengths and Difficulties Questionnaire (SDQ) is a 25-item scale, evaluating problem behaviors in children from ages 4 to 16, and scored on a 3-point scale (Table S17).Citation89 The SDQ includes internalizing and externalizing subscales. Higher scores represent more behavioral problems. Although the SDQ is shorter than the CBCL, it has verified equivalent ability to assess problem behaviors.Citation90 Due to practical reasons, children were asked to complete the SDQ rather than the CBCL when they were 10 years old. Mothers also completed the SDQ when their children were 10. Considering known discrepancies between mothers and children in assessing problem behaviors at this age,Citation91 we included both maternal and child reports in the current study.
Questionnaire reliability
To check the internal consistency of the questionnaires, we calculated ωtotal estimates by using the R package psych.Citation92,Citation93 Given ωtotal estimates were incalculable for the CBCL, we computed Cronbach’s α values for this questionnaire instead. The resulting internal consistency estimates were as follows: the maternal CBCL, αinternalizing = 0.82, αexternalizing = 0.84; the maternal SDQ, ωtotal-internalizing = 0.72, ωtotal-externalizing = 0.80; the child SDQ, ωtotal-internalizing = 0.63, ωtotal-externalizing = 0.59. Hence, most estimates indicated acceptable or good internal consistency of the subscales. The estimates of the child SDQ were considered questionable, but in line with earlier Dutch studies, and thus used in the analyses.Citation94
Extrinsic factors
Extrinsic factors included (1) Child age when stool samples were collected; (2) Delivery mode (i.e., assisted vaginal delivery, non-assisted vaginal delivery and C-section); (3) Birth weight; (4) Breastfeeding (for samples collected at age 1, 3 and 4 months, breastfeeding = average number of daily breastfeedings with respect to total number of daily milk feedings (in percentage) until stool collection day; for samples collected at age 6 and 10 years, breastfeeding = average number of daily breastfeedings with respect to total number of daily milk feedings (in percentage) in the first 27 weeks.); (5) Child age when solid food was first introduced; (6) Child sex (female or male); (7) Total number of antibiotic treatments from birth to stool collection day (infants and children); (8) Whether a child at age 6 or 10 took antibiotics in the past 1 year (yes or no).
Statistical analyses
All analyses were performed in R (version 3.6.1).Citation95
First aim: Gut microbiota development in the first 10 years of life
Gut bacterial clusters and transition patterns
To investigate normative development of the gut microbiota, we identified gut bacterial clusters based on their compositional features at the genus level by Dirichlet multinomial mixtures (DMM) models, known for their superior advantage of handling sparse data.Citation96 Considering the reproducibility and stability of the optimal clusters, we split the samples into two parts, infancy (i.e., 1, 3 and 4 months) and childhood (6 and 10 years), and performed separate DMM models afterward. The optimal number of clusters was determined by lowest Laplace approximation scores. As the combination of clusters varied between runnings, we repeated DMM models multiple times and then selected the combinations that appeared the most frequently (Tables S18 and S19).
Characteristics of gut bacterial clusters
The relative abundances of the top 15 predominant genera in infancy and childhood were displayed in heatmaps by the ComplexHeatmap package.Citation97 Phylogenetic alpha diversity was computed by using the picante packageCitation98 and compared between bacterial clusters by Wilcoxon rank sum tests. Obtained p values from the comparisons were then adjusted by FDR. Beta diversity was compared between bacterial clusters by using unweighted or weighted Unifrac distance of genera relative abundances via the vegan package.Citation99
Additionally, the functional potential of the microbial community was predicted by Picrust2 (phylogenetic investigation of communities by reconstruction of unobserved states) approach.Citation47,Citation48 Predicted gene family counts (i.e., Kyoto Encyclopedia of Genes and Genomes (KEGG) orthologs and MetaCyc pathways) for each sample were transferred into relative abundance data. Kruskal–Wallis tests for multiple-group comparisons were first performed on relative abundances of predicted functions between bacterial clusters in infancy and childhood, respectively. The predicted function, with an FDR-corrected p value less than 0.05 and the average relative abundance more than 0.5%, was further compared between every two bacterial clusters by Wilcoxon rank sum tests.
Effects of extrinsic factors
First, Redundancy Analysis (RDA) was used to measure simple effects of extrinsic factors on the gut microbiota for each of five ages (i.e., 1, 3 and 4 months, and 6 and 10 years), and then infancy (i.e., 1, 3 and 4 months) and childhood (i.e., 6 and 10 years). Child age, delivery mode, birth weight, breastfeeding and child sex were considered in infancy. Because only two infants took antibiotics in the first 4 months of life, we did not consider this factor in infancy RDA models. Similarly, as only one child started consuming solids before the stool collection at 4 months, this factor was not considered in infancy RDA models. As for samples in childhood, all extrinsic factors mentioned before were included. Quantitative extrinsic factors were converted to z-scores before use. Second, RDA was performed to measure conditional effects for extrinsic factors with significant simple effects. To avoid potential strong multicollinearity in RDA when assessing conditional effects, we required variance inflation factors (VIFs) of all extrinsic factors to be less than three.Citation100 Third, RDA tri-plots were drawn by the ggplot package.Citation101 All RDA models were built based on Bray-Curtis dissimilarity matrices calculated from log-transformed relative abundances at the genus level, via the vegan package.Citation99 Permutation tests with 1000 permutations were used to determine the significance of variance explained by extrinsic factors.
Second aim: Associations of the gut microbiota with internalizing and externalizing behavior in middle childhood
Behavioral differences between bacterial clusters
To compare behavioral measures (i.e., internalizing and externalizing behavior) between bacterial clusters, we conducted Wilcoxon rank sum tests with FDR adjustment.
RDA models
RDA models were established to determine how much variance in microbial composition could be explained by behavioral measures (i.e., internalizing and externalizing behavior) with and without accounting for extrinsic factors with significant conditional effects. Internalizing and externalizing behavior scores were standardized to z-scores before use. Then, RDA tri-plots were drawn by the ggplot package.Citation101 The same VIF requirements, matrices type and permutation tests as for extrinsic factors were also adopted here.
PRC models
Principal Response Curves (PRC) analysis is a method that enables contrasting time series of experimental groups with a time series of a reference group.Citation102 Therefore, it was used to select the genera with relatively large differences in relative abundance across ages between behavior groups. Two behavior groups were set for each of the behavior types (internalizing and externalizing behavior). The experimental group (H) included the individuals with behavior scores in the top quartile, while the reference group (L + M) consisted of all remaining individuals. Relative abundance data were preprocessed with log-transformation. PRC models were generated using the vegan package.Citation99 PRC diagrams were visualized by the ggplot package.Citation101 The first principal component of the variance explained by behavior groups in time, called canonical coefficient, was displayed on the y-axis. The age points were shown on the x-axis. Another vertical axis, named taxon weight, was drawn to elucidate the affinity of the different genera with the response. Wilcoxon rank sum tests with FDR adjustment were further applied for comparing the differences of selected genera from PRC models between behavior groups at individual time points.
MLM models
Multilevel modelling (MLM) models were conducted to measure the associations of internalizing and externalizing behavior with diversity and selected genera when accounting for extrinsic factors. Selected genera included bacteria with absolute values of taxon weights more than 0.6 and prevalence above 0.2. For MLM models including samples in infancy, extrinsic factors consisted of age, breastfeeding, delivery mode, birth weight and gender. For MLM models in childhood, these factors, as well as antibiotics and age when solid food was introduced, were included. Quantitative extrinsic factors, behavior scores and diversity were converted to z-scores before use. Log transformation was applied to relative abundance data at the genus level. To avoid strong multicollinearity, generalized variance inflation factors (GVIFs) were required to be less than 3. MLM models were built by the lmerTest package.Citation103
Significance
Statistically significant level was required with p value less than 0.05.
Supplemental Material
Download Zip (256.7 KB)Acknowledgments
The authors would like to thank the BIBO study children and their parents for their participation, as well as all the students and assistants that collected the data over the years. Also, thanks to Merlijn van Gaal, Steven Aalvink, Ineke Heikamp-de Jong, Henrik Eckermann and Irene van Kroonenburg for research assistance. This research was supported by a Netherlands Organization for Scientific Research VIDI grant (575-25-009, to C de Weerth), and VICI grant (016.Vici.185.038, to C de Weerth). YO was financially supported by a fellowship of the China Scholarship Council. Other support came from the Eat2beNICE project, received funding from the European Union’s Horizon 2020 research and innovation program (grant agreement No. 728018).
Disclosure statement
No potential conflict of interest was reported by the author(s).
Data availability statement
Due to the BIBO datasets are parts of an ongoing longitudinal study, the data that support the findings of this study cannot be made publicly available but are available upon request from C de Weerth ([email protected]; https://doi.org/10.5281/zenodo.5500644).
Supplementary material
Supplemental data for this article can be accessed on the publisher’s website.
Additional information
Funding
References
- Hillman ET, Lu H, Yao T, Nakatsu CH. Microbial ecology along the gastrointestinal tract. Microbes Env. 2017;32(4):300–22. doi:10.1264/jsme2.ME17017.
- Nicholson JK, Holmes E, Kinross J, Burcelin R, Gibson G, Jia W, Pettersson S. Host-gut microbiota metabolic interactions. Science. 2012;336(6086):1262–1267. doi:10.1126/science.1223813.
- Valdes AM, Walter J, Segal E, Spector TD. Role of the gut microbiota in nutrition and health. BMJ. 2018;361:k2179. doi:10.1136/bmj.k2179
- Round JL, Mazmanian SK. The gut microbiota shapes intestinal immune responses during health and disease. Nat Rev Immunol. 2009;9(5):313–323. doi:10.1038/nri2515.
- Cryan JF, O’Riordan KJ, Cowan CSM, Kv S, Bastiaanssen TFS, Boehme M, Codagnone MG, Cussotto S, Fulling C, AV G, et al. The microbiota-gut-brain axis. Physiol Rev. 2019;99(4):1877–2013. doi:10.1152/physrev.00018.2018
- Martin R, Makino H, Cetinyurek Yavuz A, Ben-Amor K, Roelofs M, Ishikawa E, Kubota H, Swinkels S, Sakai T, Oishi K, et al. Early-life events, including mode of delivery and type of feeding, siblings and gender, shape the developing Gut Microbiota Suchodolski JS, editor. PLOS ONE. 2016;11(6):e0158498. doi:10.1371/journal.pone.0158498
- Milani C, Duranti S, Francesca Bottacini B, Eoghan Casey B, Turroni F, Jennifer Mahony B, Clara Belzer SDP, Silvia Arboleya Montes E, Mancabelli L, Gabriele Andrea Lugli A, et al. The first microbial colonizers of the human gut: composition. Act health implications of the infant gut microbiota. Microbiol Mol Biol Rev. 2017;81:1–67.
- Borewicz K, Suarez-Diez M, Hechler C, Beijers R, de Weerth C, Arts I, Penders J, Thijs C, Nauta A, Lindner C, et al. The effect of prebiotic fortified infant formulas on microbiota composition and dynamics in early life. Sci Rep. 2019;9(1):2434. doi:10.1038/s41598-018-38268-x
- Matsuki T, Yahagi K, Mori H, Matsumoto H, Hara T, Tajima S, Ogawa E, Kodama H, Yamamoto K, Yamada T, et al. A key genetic factor for fucosyllactose utilization affects infant gut microbiota development. Nat Commun. 2016;7(1):11939. doi:10.1038/ncomms11939
- Dogra S, Sakwinska O, Soh S-E, Ngom-Bru C, Brück WM, Berger B, Brüssow H, Lee YS, Yap F, Chong Y-S, et al. Dynamics of infant gut microbiota are influenced by delivery mode and gestational duration and are associated with subsequent adiposity de Vos WM, Dominguez Bello MG, editors. mBio. 2015;6(1):1–9. doi:10.1128/mBio.02419-14
- Jaggar M, Rea K, Spichak S, Dinan TG, Cryan JF. You’ve got male: sex and the microbiota-gut-brain axis across the lifespan. Front Neuroendocrinol. 2020;56(December 2019):100815. doi:10.1016/j.yfrne.2019.100815.
- Unger S, Stintzi A, Shah P, Mack D, O’Connor DL. Gut microbiota of the very-low-birth-weight infant. Pediatr Res. 2015;77(1–2):205–213. doi:10.1038/pr.2014.162.
- Rutayisire E, Huang K, Liu Y, Tao F. The mode of delivery affects the diversity and colonization pattern of the gut microbiota during the first year of infants’ life: a systematic review. BMC Gastroenterol. 2016;16(1):86. doi:10.1186/s12876-016-0498-0.
- Scott KP, Gratz SW, Sheridan PO, Flint HJ, Duncan SH. The influence of diet on the gut microbiota. Pharmacol Res. 2013;69(1):52–60. doi:10.1016/j.phrs.2012.10.020.
- Ianiro G, Tilg H, Gasbarrini A. Antibiotics as deep modulators of gut microbiota: between good and evil. Gut. 2016;65(11):1906–1915. doi:10.1136/gutjnl-2016-312297.
- Wang J, Thingholm LB, Skiecevičienė J, Rausch P, Kummen M, Hov JR, Degenhardt F, Heinsen F-A, Rühlemann MC, Szymczak S, et al. Genome-wide association analysis identifies variation in vitamin D receptor and other host factors influencing the gut microbiota. Nat Genet. 2016;48(11):1396–1406. doi:10.1038/ng.3695
- Morais LH, AV G, Moloney GM, Moya-Pérez A, Ventura-Silva AP, Arboleya S, Bastiaanssen TFS, O’Sullivan O, Rea K, Borre Y, et al. Enduring behavioral effects induced by birth by caesarean section in the mouse. Curr Biol. 2020 Aug:1–14. doi:10.1016/j.cub.2020.07.044
- Stewart CJ, Ajami NJ, O’Brien JL, Hutchinson DS, Smith DP, Wong MC, Ross MC, Lloyd RE, Doddapaneni H, Metcalf GA, et al. Temporal development of the gut microbiome in early childhood from the TEDDY study. Nature. 2018 Oct 24;5627728:583–588. 10.1038/s41586-018-0617-x
- Cox LM, Yamanishi S, Sohn J, AV A, Leung JM, Cho I, Kim SG, Li H, Gao Z, Mahana D, et al. Altering the intestinal microbiota during a critical developmental window has lasting metabolic consequences. Cell. 2014;158(4):705–721. doi:10.1016/j.cell.2014.05.052
- Derrien M, Alvarez A-S, de Vos WM. The gut microbiota in the first decade of life. Trends Microbiol. 2019;27(12):997–1010. doi:10.1016/j.tim.2019.08.001.
- Yatsunenko T, Rey FE, Manary MJ, Trehan I, Dominguez-Bello MG, Contreras M, Magris M, Hidalgo G, Baldassano RN, Anokhin AP, et al. Human gut microbiome viewed across age and geography. Nature. 2012;486(7402):222–227. doi:10.1038/nature11053
- Koenig JE, Spor A, Scalfone N, Fricker AD, Stombaugh J, Knight R, Angenent LT, Ley RE. Succession of microbial consortia in the developing infant gut microbiome. Proc Natl Acad Sci. 2011;108(Supplement_1):4578–4585. doi:10.1073/pnas.1000081107.
- Ringel-Kulka T, Cheng J, Ringel Y, Salojärvi J, Carroll I, Palva A, de Vos Wm, Satokari R, de Vos WM. Intestinal microbiota in healthy U.S. young children and adults—a high throughput microarray analysis Neu J, editor. PLoS ONE. 2013;8(5):e64315. doi:10.1371/journal.pone.0064315.
- Hollister EB, Riehle K, Luna RA, Weidler EM, Rubio-Gonzales M, Mistretta T-A, Raza S, Hv D, Metcalf GA, Muzny DM, et al. Structure and function of the healthy pre-adolescent pediatric gut microbiome. Microbiome. 2015;3(1):36. doi:10.1186/s40168-015-0101-x
- Agans R, Rigsbee L, Kenche H, Michail S, Khamis HJ, Paliy O. Distal gut microbiota of adolescent children is different from that of adults. FEMS Microbiol Ecol. 2011;77(2):404–412. doi:10.1111/j.1574-6941.2011.01120.x.
- Aizawa E, Tsuji H, Asahara T, Takahashi T, Teraishi T, Yoshida S, Ota M, Koga N, Hattori K, Kunugi H. Possible association of Bifidobacterium and Lactobacillus in the gut microbiota of patients with major depressive disorder. J Affect Disord. 2016;202:254–257. doi:10.1016/j.jad.2016.05.038
- Crumeyrolle-Arias M, Jaglin M, Bruneau A, Vancassel S, Cardona A, Daugé V, Naudon L, Rabot S. Absence of the gut microbiota enhances anxiety-like behavior and neuroendocrine response to acute stress in rats. Psychoneuroendocrinology. 2014;42:207–217. doi:10.1016/j.psyneuen.2014.01.014
- Lin P, Ding B, Feng C, Yin S, Zhang T, Qi X, Lv H, Guo X, Dong K, Zhu Y, et al. Prevotella and Klebsiella proportions in fecal microbial communities are potential characteristic parameters for patients with major depressive disorder. J Affect Disord. 2017;207(April 2016):300–304. doi:10.1016/j.jad.2016.09.051
- Hu S, Li A, Huang T, Lai J, Li J, Sublette ME, Lu H, Lu Q, Du Y, Hu Z, et al. Gut microbiota changes in patients with bipolar depression. Adv Sci. 2019;6(14):1900752. doi:10.1002/advs.201900752
- Painold A, Mörkl S, Kashofer K, Halwachs B, Dalkner N, Bengesser S, Birner A, Fellendorf F, Platzer M, Queissner R, et al. A step ahead: exploring the gut microbiota in inpatients with bipolar disorder during a depressive episode. Bipolar Disord. 2019;21(1):40–49. doi:10.1111/bdi.12682
- Wallace CJK, Milev R. The effects of probiotics on depressive symptoms in humans: a systematic review. Ann Gen Psychiatry. 2017;16(1):14. doi:10.1186/s12991-017-0138-2.
- Liu RT, Walsh RFL, Sheehan AE. Prebiotics and probiotics for depression and anxiety: a systematic review and meta-analysis of controlled clinical trials. Neurosci Biobehav Rev. 2019;102(January):13–23. doi:10.1016/j.neubiorev.2019.03.023.
- Taylor AM, Holscher HD. A review of dietary and microbial connections to depression, anxiety, and stress. Nutr Neurosci. 2020;23(3):237–250. doi:10.1080/1028415X.2018.1493808.
- Kelly JR, Borre Y, O’ Brien C, Patterson E, El Aidy S, Deane J, Kennedy PJ, Beers S, Scott K, Moloney G, et al. Transferring the blues: depression-associated gut microbiota induces neurobehavioural changes in the rat. J Psychiatr Res. 2016;82:109–118. doi:10.1016/j.jpsychires.2016.07.019
- Zheng P, Zeng B, Zhou C, Liu M, Fang Z, Xu X, Zeng L, Chen J, Fan S, Du X, et al. Gut microbiome remodeling induces depressive-like behaviors through a pathway mediated by the host’s metabolism. Mol Psychiatry. 2016;21(6):786–796. doi:10.1038/mp.2016.44
- Liu J. Childhood externalizing behavior: theory and implications. J Child Adolesc Psychiatric Nurs. 2004;17(3):93–103. doi:10.1111/j.1744-6171.2004.tb00003.x.
- Mason WA, Kosterman R, Hawkins JD, Herrenkohl TI, Lengua LJ, Mccauley E. Predicting depression, social phobia, and violence in early adulthood from childhood behavior problems. J Am Acad Child Adolesc Psychiatry. 2004;43(3):307–315. doi:10.1097/00004583-200403000-00012.
- Jokela M, Ferrie J, Kivimäki M. Childhood problem behaviors and death by midlife: the British National Child Development Study. J Am Acad Child Adolesc Psychiatry. 2009;48(1):19–24. doi:10.1097/CHI.0b013e31818b1c76.
- von Stumm S, Deary IJ, Kivimäki M, Jokela M, Clark H, Batty GD. Childhood behavior problems and health at midlife: 35-year follow-up of a Scottish birth cohort. J Child Psychol Psychiatry. 2011;52(9):992–1001. doi:10.1111/j.1469-7610.2011.02373.x.
- Copeland WE, Wolke D, Angold A, Costello EJ. Adult psychiatric outcomes of bullying and being bullied by peers in childhood and adolescence. JAMA Psychiatry. 2013;70(4):419. doi:10.1001/jamapsychiatry.2013.504.
- Strati F, Cavalieri D, Albanese D, De Felice C, Donati C, Hayek J, Jousson O, Leoncini S, Renzi D, Calabrò A, et al. New evidences on the altered gut microbiota in autism spectrum disorders. Microbiome. 2017;5(1):24. doi:10.1186/s40168-017-0242-1
- Coretti L, Paparo L, Riccio MP, Amato F, Cuomo M, Natale A, Borrelli L, Corrado G, De Caro C, Comegna M, et al. Gut microbiota features in young children with autism spectrum disorders. Front Microbiol. 2018;9(December):1–12. doi:10.3389/fmicb.2018.03146
- Jiang H, Zhou Y, Zhou G, Li Y, Yuan J, Li X, Ruan B. Gut microbiota profiles in treatment-naïve children with attention deficit hyperactivity disorder. Behav Brain Res. 2018;347(March):408–413. doi:10.1016/j.bbr.2018.03.036.
- Aatsinki A-K, Lahti L, Uusitupa H-M, Munukka E, Keskitalo A, Nolvi S, O’Mahony S, Pietilä S, Elo LL, Eerola E, et al. Gut microbiota composition is associated with temperament traits in infants. Brain Behav Immun. 2019;80(January):849–858. doi:10.1016/j.bbi.2019.05.035
- Carlson AL, Xia K, Azcarate-Peril MA, Goldman BD, Ahn M, Styner MA, Thompson AL, Geng X, Gilmore JH, Knickmeyer RC. Infant gut microbiome associated with cognitive development. Biol Psychiatry. 2018;83(2):148–159. doi:10.1016/j.biopsych.2017.06.021.
- Loughman A, Ponsonby A-L, O’Hely M, Symeonides C, Collier F, Tang MLK, Carlin J, Ranganathan S, Allen K, Pezic A, et al. Gut microbiota composition during infancy and subsequent behavioural outcomes. EBioMedicine. 2020;52:102640. doi:10.1016/j.ebiom.2020.102640
- Douglas GM, Maffei VJ, Zaneveld JR, Yurgel SN, Brown JR, Taylor CM, Huttenhower C, Langille MGI. PICRUSt2 for prediction of metagenome functions. Nat Biotechnol. 2020;38(6):685–688. doi:10.1038/s41587-020-0548-6.
- Langille MGI, Zaneveld J, Caporaso JG, McDonald D, Knights D, Reyes JA, Clemente JC, Burkepile DE, Vega Thurber RL, Knight R, et al. Predictive functional profiling of microbial communities using 16S rRNA marker gene sequences. Nat Biotechnol. 2013;31(9):814–821. doi:10.1038/nbt.2676
- Hill CJ, Lynch DB, Murphy K, Ulaszewska M, Jeffery IB, O’Shea CA, Watkins C, Dempsey E, Mattivi F, Tuohy K, et al. Evolution of gut microbiota composition from birth to 24 weeks in the INFANTMET Cohort. Microbiome. 2017;5(1):4. doi:10.1186/s40168-016-0213-y
- Zhong H, Penders J, Shi Z, Ren H, Cai K, Fang C, Ding Q, Thijs C, Blaak EE, Stehouwer CDA, et al. Impact of early events and lifestyle on the gut microbiota and metabolic phenotypes in young school-age children. Microbiome. 2019;7(1):2. doi:10.1186/s40168-018-0608-z
- Odamaki T, Kato K, Sugahara H, Hashikura N, Takahashi S, Xiao J, Abe F, Osawa R. Age-related changes in gut microbiota composition from newborn to centenarian: a cross-sectional study. BMC Microbiol. 2016;16(1):90. doi:10.1186/s12866-016-0708-5.
- Arumugam M, Raes J, Pelletier E, Le Paslier D, Yamada T, Mende DR, Fernandes GR, Tap J, Bruls T, Batto J-M, et al. Enterotypes of the human gut microbiome. Nature. 2011;473(7346):174–180. doi:10.1038/nature09944
- De Filippo C, Cavalieri D, Di Paola M, Ramazzotti M, Poullet JB, Massart S, Collini S, Pieraccini G, Lionetti P. Impact of diet in shaping gut microbiota revealed by a comparative study in children from Europe and rural Africa. Proc Natl Acad Sci. 2010;107(33):14691–14696. doi:10.1073/pnas.1005963107.
- Wu GD, Chen J, Hoffmann C, Bittinger K, Chen -Y-Y, Keilbaugh SA, Bewtra M, Knights D, Walters WA, Knight R, et al. Linking long-term dietary patterns with gut microbial enterotypes. Science. 2011;334(6052):105–108. doi:10.1126/science.1208344
- Hsu CA, Yu RC, Chou CC. Production of β-galactosidase by Bifidobacteria as influenced by various culture conditions. Int J Food Microbiol. 2005;104(2):197–206. doi:10.1016/j.ijfoodmicro.2005.02.010.
- Dalile B, Van Oudenhove L, Vervliet B, Verbeke K. The role of short-chain fatty acids in microbiota–gut–brain communication. Nat Rev Gastroenterol Hepatol. 2019;16(8):461–478. doi:10.1038/s41575-019-0157-3.
- Laroute V, Yasaro C, Narin W, Mazzoli R, Pessione E, Cocaign-Bousquet M, Loubière P. GABA production in Lactococcus lactis is enhanced by arginine and co-addition of malate. Front Microbiol. 2016;7(JUL):1–11. doi:10.3389/fmicb.2016.01050.
- Zijlmans MAC, Korpela K, Riksen-Walraven JM, de Vos WM, de Weerth C. Maternal prenatal stress is associated with the infant intestinal microbiota. Psychoneuroendocrinology. 2015;53:233–245. doi:10.1016/j.psyneuen.2015.01.006
- Lawson MAE, O’Neill IJ, Kujawska M, Gowrinadh Javvadi S, Wijeyesekera A, Flegg Z, Chalklen L, Hall LJ. Breast milk-derived human milk oligosaccharides promote Bifidobacterium interactions within a single ecosystem. ISME J. 2020;14(2):635–648. doi:10.1038/s41396-019-0553-2.
- O’Callaghan A, van Sinderen D. Bifidobacteria and their role as members of the human gut microbiota. Front Microbiol. 2016;7(JUN). doi:10.3389/fmicb.2016.00925
- Kovatcheva-Datchary P, Nilsson A, Akrami R, Lee YS, De Vadder F, Arora T, Hallen A, Martens E, Björck I, Bäckhed F. Dietary fiber-induced improvement in glucose metabolism is associated with increased abundance of prevotella. Cell Metab. 2015;22(6):971–982. doi:10.1016/j.cmet.2015.10.001.
- Willemsen Y, Beijers R, Arias Vasquez A, de Weerth C. Do breastfeeding history and diet quality predict inhibitory control at preschool age? -Supp. Nutrients. 2021;13(8):2752. doi:10.3390/nu13082752.
- Slykerman RF, Thompson J, Waldie KE, Murphy R, Wall C, Mitchell EA. Antibiotics in the first year of life and subsequent neurocognitive outcomes. Acta Paediatrica. 2017;106(1):87–94. doi:10.1111/apa.13613.
- Slykerman RF, Coomarasamy C, Wickens K, Thompson JMD, Stanley TV, Barthow C, Kang J, Crane J, Mitchell EA. Exposure to antibiotics in the first 24 months of life and neurocognitive outcomes at 11 years of age. Psychopharmacology. 2019;236(5):1573–1582. doi:10.1007/s00213-019-05216-0.
- Lavebratt C, Yang LL, Giacobini M, Forsell Y, Schalling M, Partonen T, Gissler M. Early exposure to antibiotic drugs and risk for psychiatric disorders: a population-based study. Transl Psychiatry. 2019;9(1):317. doi:10.1038/s41398-019-0653-9.
- Baker JK, Fenning RM, Erath SA, Baucom BR, Moffitt J, Howland MA. Sympathetic under-arousal and externalizing behavior problems in children with autism spectrum disorder. J Abnorm Child Psychol. 2018;46(4):895–906. doi:10.1007/s10802-017-0332-3.
- De Angelis M, Piccolo M, Vannini L, Siragusa S, De Giacomo A, Serrazzanetti DI, Cristofori F, Guerzoni ME, Gobbetti M, Francavilla R. Fecal microbiota and metabolome of children with autism and pervasive developmental disorder not otherwise specified Heimesaat MM, editor. PLoS ONE. 2013;8(10):e76993. doi:10.1371/journal.pone.0076993.
- Kang D-W, Park JG, Ilhan ZE, Wallstrom G, LaBaer J, Adams JB, Krajmalnik-Brown R, Gilbert JA. Reduced incidence of prevotella and other fermenters in intestinal microflora of autistic children Gilbert JA, editor. PLoS ONE. 2013;8(7):e68322. doi:10.1371/journal.pone.0068322.
- Kuja-Halkola R, Lichtenstein P, D’Onofrio BM, Larsson H. Codevelopment of ADHD and externalizing behavior from childhood to adulthood. J Child Psychol Psychiatry. 2015;56(6):640–647. doi:10.1111/jcpp.12340.
- Wang L-J, Yang C-Y, Chou W-J, Lee M-J, Chou M-C, Kuo H-C, Yeh Y-M, Lee S-Y, Huang L-H, Li S-C. Gut microbiota and dietary patterns in children with attention-deficit/hyperactivity disorder. Eur Child Adolesc Psychiatry. 2020;29(3):287–297. doi:10.1007/s00787-019-01352-2.
- Prehn-Kristensen A, Zimmermann A, Tittmann L, Lieb W, Schreiber S, Baving L, Fischer A, Yao Y-G. Reduced microbiome alpha diversity in young patients with ADHD Yao Y-G, editor. PLoS ONE. 2018;13(7):e0200728. doi:10.1371/journal.pone.0200728.
- Ley RE. Prevotella in the gut: choose carefully. Nat Rev Gastroenterol Hepatol. 2016;13(2):69–70. doi:10.1038/nrgastro.2016.4.
- Cheung SG, Goldenthal AR, Uhlemann AC, Mann JJ, Miller JM, Sublette ME. Systematic review of gut microbiota and major depression. Front Psychiatry. 2019;10(FEB). doi:10.3389/fpsyt.2019.00034
- Li L, Su Q, Xie B, Duan L, Zhao W, Hu D, Wu R, Liu H. Gut microbes in correlation with mood: case study in a closed experimental human life support system. Neurogastroenterology & Motil. 2016;28(8):1233–1240. doi:10.1111/nmo.12822.
- McConaughy SH, Skiba RJ. Comorbidity of externalizing and internalizing problems. School Psych Rev. 1993;22(3):421–436. doi:10.1080/02796015.1993.12085664.
- Aronen ET, Soininen M. Childhood depressive symptoms predict psychiatric problems in young adults. Can J Psychiatry. 2000;45(5):465–470. doi:10.1177/070674370004500507.
- Zoccolillo M. Co-occurrence of conduct disorder and its adult outcomes with depressive and anxiety disorders: a review. J Am Acad Child Adolesc Psychiatry. 1992;31(3):547–556. doi:10.1097/00004583-199205000-00024.
- Lawson RA, Papadakis AA, Higginson CI, Barnett JE, Wills MC, Strang JF, Wallace GL, Kenworthy L. Everyday executive function impairments predict comorbid psychopathology in autism spectrum and attention deficit hyperactivity disorders. Neuropsychology. 2015;29(3):445–453. doi:10.1037/neu0000145.
- Beijers R, Jansen J, Riksen-Walraven M, de Weerth C. Attachment and infant night waking: a longitudinal study from birth through the first year of life. J Dev Behav Pediatr. 2011;32(9):635–643. doi:10.1097/DBP.0b013e318228888d.
- Zijlmans MAC, Beijers R, Riksen-Walraven MJ, de Weerth C. Maternal late pregnancy anxiety and stress is associated with children’s health: a longitudinal study. Stress. 2017;20(5):495–504. doi:10.1080/10253890.2017.1348497.
- Beijers R, Riksen-Walraven JM, de Weerth C. Cortisol regulation in 12-month-old human infants: associations with the infants’ early history of breastfeeding and co-sleeping. Stress. 2013;16(3):267–277. doi:10.3109/10253890.2012.742057.
- Gu F, Borewicz K, Richter B, van der Zaal Ph, Smidt H, Buwalda PL, Schols HA, der Zaal PH. In vitro fermentation behavior of isomalto/malto-polysaccharides using human fecal inoculum indicates prebiotic potential. Mol Nutr Food Res. 2018;62(12):1800232. doi:10.1002/mnfr.201800232.
- Parada AE, Needham DM, Fuhrman JA. Every base matters: assessing small subunit rRNA primers for marine microbiomes with mock communities, time series and global field samples. Environ Microbiol. 2016;18(5):1403–1414. doi:10.1111/1462-2920.13023.
- Apprill A, McNally S, Parsons R, Weber L. Minor revision to V4 region SSU rRNA 806R gene primer greatly increases detection of SAR11 bacterioplankton. Aquat Microb Ecol. 2015;75(2):129–137. doi:10.3354/ame01753.
- Ramiro-Garcia J, Hermes GDA, Giatsis C, Sipkema D, Zoetendal EG, Schaap PJ, Smidt H. NG-Tax, a highly accurate and validated pipeline for analysis of 16S rRNA amplicons from complex biomes. F1000Research. 2018;5(May):1791. doi:10.12688/f1000research.9227.2.
- Poncheewin W, Hermes GDA, van Dam Jcj, Koehorst JJ, Smidt H, Schaap PJ, van Dam JCJ. NG-Tax 2.0: a semantic framework for high-throughput amplicon analysis. Front Genet. 2020;10(January):1–12. doi:10.3389/fgene.2019.01366.
- Quast C, Pruesse E, Yilmaz P, Gerken J, Schweer T, Yarza P, Peplies J, Glöckner FO. The SILVA ribosomal RNA gene database project: improved data processing and web-based tools. Nucleic Acids Res. 2012;41(D1):D590–D596. doi:10.1093/nar/gks1219.
- Achenbach TM. Integrative guide for the 1991 CBCL/4-18. Burlington: YSR, and TRF profiles; 1991.
- Goodman R. The strengths and difficulties questionnaire: a research note. J Child Psychol Psychiatry. 1997;38(5):581–586. doi:10.1111/j.1469-7610.1997.tb01545.x.
- Goodman R, Scott S. Comparing the strengths and difficulties questionnaire and the child behavior checklist: is small beautiful? J Abnorm Child Psychol. 1999;27(1):17–24. doi:10.1023/a:1022658222914.
- Van Roy B, Groholt B, Heyerdahl S, Clench-Aas J. Understanding discrepancies in parent-child reporting of emotional and behavioural problems: effects of relational and socio-demographic factors. BMC Psychiatry. 2010;10(1):56. doi:10.1186/1471-244X-10-56.
- Revelle, WR psych: Procedures for Psychological, Psychometric, and Personality Research. R package. https://cran.r-project.org/web/packages/psych/index.html. 2021.
- Revelle W, Condon DM. Reliability from α to ω: a tutorial. Psychol Assess. 2019;31(12):1395–1411. doi:10.1037/pas0000754.
- Maurice-Stam H, Haverman L, Splinter A, van Oers Ha, Schepers SA, Grootenhuis MA, van Oers HA. Dutch norms for the Strengths and Difficulties Questionnaire (SDQ) - parent form for children aged 2-18years. Health Qual Life Outcomes. 2018;16(1):1–11. doi:10.1186/s12955-018-0948-1.
- R Core Team. R: A language and environment for statistical computing . R Foundation for Statistical Computing : Vienna, Austria; 2013. http://www.R-project.org/
- Holmes I, Harris K, Quince C, Gilbert JA. Dirichlet multinomial mixtures: generative models for microbial metagenomics Gilbert JA, editor. PLoS ONE. 2012;7(2):e30126. doi:10.1371/journal.pone.0030126.
- Gu Z, Eils R, Schlesner M. Complex heatmaps reveal patterns and correlations in multidimensional genomic data. Bioinformatics. 2016;32(18):2847–2849. doi:10.1093/bioinformatics/btw313.
- Kembel SW. picante: Integrating Phylogenies and Ecology. R package; 2020. https://cran.r-project.org/web/packages/picante/index.html
- Oksanen J . vegan: Community Ecology Package. R package; 2020. https://cran.r-project.org/web/packages/vegan/index.html
- Zuur AF, Ieno EN, Elphick CS. A protocol for data exploration to avoid common statistical problems. Methods Ecol Evol. 2010;1(1):3–14. doi:10.1111/j.2041-210X.2009.00001.x.
- Wickham H. ggplot2: Elegant Graphics for Data Analysis New York: Springer; 2016. 978-3-319-24277-4. https://ggplot2.tidyverse.org
- van den Brink Pj, den Besten Pj, bij de Vaate A, ter Braak Cjf, van den Brink PJ, den Besten PJ, bij de Vaate A, ter Braak CJF. Principal response curves technique for the analysis of multivariate biomonitoring time series. Environ Monit Assess. 2009;152(1–4):271–281. doi:10.1007/s10661-008-0314-6.
- Kuznetsova A, Brockhoff PB, Christensen RHB, Jensen SP. lmerTest package: tests in linear mixed effects models. Journal of Statistical Software. 2017;82(13). doi:10.18637/jss.v082.i13