
ABSTRACT
Helicobacter pylori is the major risk factor for gastric cancer. H. pylori harboring the type IV secretion system (T4SS) and its effector CagA encoded on the cag pathogenicity Island (cagPAI) increases the risk. H. pylori PMSS1 has a multi-cagA genotype, modulating cagA copy number dynamically from zero to four copies. To examine the effect of the immune response on cagA copy number change, we utilized a mouse model with different immune status. PMSS1 recovered from Rag1−/− mice, lacking functional T or B cells, retained more cagA copies. PMSS1 recovered from Il10−/− mice, showing intense inflammation, had fewer cagA copies compared to those recovered from wild-type mice. Moreover, cagA copy number of PMSS1 recovered from wild-type and Il10−/− mice was positively correlated with the capacity to induce IL-8 secretion at four weeks of infection. Since recombination in cagY influences T4SS function, including CagA translocation and IL-8 induction, we constructed a multiple linear regression model to predict H. pylori-induced IL-8 expression based on cagA copy number and cagY recombination status; H. pylori induces more IL-8 secretion when the strain has more cagA copies and intact cagY. This study shows that H. pylori PMSS1 in mice with less intense immune response possess higher cagA copy number than those infected in mice with more intense immune response and thus the multi-cagA genotype, along with cagY recombination, functions as an immune-sensitive regulator of H. pylori virulence.
Introduction
Helicobacter pylori causes chronic gastritis and is the major risk factor for peptic ulcers, gastric adenocarcinoma, and mucosa-associated lymphoid tissue lymphoma.Citation1,Citation2 The fact that this bacterial species colonizes over half the human population,Citation3 and gastric cancer is the third most frequent cause of cancer-related death,Citation4 suggests the importance of H. pylori in human health. To achieve a successful lifelong colonization in the human stomach, the bacteria must adapt to highly variable host environments, which change with age and health conditions. In fact, genetic variation among H. pylori strains is sufficient to reflect genetic differences in human populations from which they were isolated.Citation5,Citation6 This suggests that H. pylori and human hosts have undergone coevolution, interacting with each other, which affects disease development.Citation7 This H. pylori genomic evolution has been demonstrated not only in cross-sectional population studies, but also in real time during natural infection of humans, as well as experimental infection of humans and laboratory animals.Citation8–14
It has long been reported that H. pylori strains harboring a genomic locus termed the cag pathogenicity Island (cagPAI) are associated with a higher risk of developing gastric adenocarcinoma.Citation15 The cagPAI is a ~40-kb region containing 27-31 genes that encode a bacterial type IV secretion system (T4SS) and its effector protein, CagA,Citation16 a 120 to 145-kDa protein that is injected into host gastric epithelial cells.Citation17 Once inside the host cells, CagA is phosphorylated by host kinasesCitation18,Citation19 and influences various host cellular processes in a phosphorylation-dependent and independent manner.Citation20,Citation21 CagA induces nuclear translocation of β-catenin,Citation22 which induces the expression of genes involved in carcinogenesis, such as vascular endothelial growth factor, NANOG, OCT4, and CDX1.Citation23–25 CagA also promotes survival and proliferation of gastric epithelial cells by activating ERK/MAPK and JAK/STAT3 pathways.Citation26–28
CagA can be both beneficial and detrimental to the survival of H. pylori in the stomach. On the one hand, CagA induces loss of tight junctions and epithelial cell polarity by disrupting proper localization of junctional adhesion molecule and zona occludens-1,Citation29,Citation30 and inhibiting activity of partitioning-defective 1/microtubule affinity-regulating kinase.Citation31,Citation32 By disrupting epithelial cell polarity and modulating the transferrin-recycling pathway, CagA induces leakage of iron across the epithelial barrier, which is beneficial for growth and colonization of H. pylori.Citation33,Citation34 On the other hand, CagA mediates inflammation by inducing expression of pro-inflammatory cytokines in gastric epithelial cells.Citation35–37 In vitro, CagA-expressing H. pylori strains induce higher levels of interleukin (IL) -8 secretion in gastric epithelial cells.Citation35 CagA is also highly immunogenic, and seropositivity of antibody against CagA is associated with a higher degree of inflammation in stomach tissue,Citation38,Citation39 which is detrimental to survival and proliferation of H. pylori.Citation40,Citation41 Mongolian gerbils infected with cagA-deleted 7.13 H. pylori mutant strain showed increased colonization density and attenuated inflammation compared to those infected with 7.13 wild-type strain.Citation42 CagA is associated with a Th1-polarized immune response,Citation43 which mediates protection against H. pylori and clearance of infection.Citation44,Citation45 The beneficial and detrimental effects of CagA suggest that H. pylori needs to regulate CagA during colonization of H. pylori in the human stomach.
H. pylori has relatively few two-component regulatory systems, and instead often uses DNA recombination or slipped strand synthesis to regulate gene expression.Citation46–52 For example, H. pylori modulates T4SS function, including CagA translocation and IL-8 induction, via recombination in cagY.Citation53 CagY is an approximately 220-kDa protein that is an essential component of the T4SS core complex.Citation54–56 cagY contains variable numbers of direct DNA repeats in its 5′ and middle regions, yielding variant CagY proteins by in-frame DNA recombination.Citation57,Citation58 Recombination in the middle repeat region of cagY was observed in H. pylori strains recovered from mice, gerbils, and monkeys.Citation53,Citation59,Citation60 Typically, cagY recombination reduced T4SS function and decreased the host inflammatory response, although the recombination could occasionally increase T4SS function.Citation53,Citation59,Citation60
Another potential DNA-based mechanism to regulate CagA expression is alteration of cagA gene copy number. About 7.5% of clinical H. pylori isolates in the United States carry a multi-cagA genotype, including strain PMSS1, which was shown to modulate cagA copy number dynamically from zero to four cagA copies in vitro.Citation61–63 In H. pylori strains with multi-cagA genotype, cagA is flanked with ~0.5-kb direct repeats referred to as cagA homologous area (CHA)-ud and recombination between CHA-ud repeats is thought to be responsible for cagA copy number change.Citation62,Citation63 Among isogenic PMSS1 mutants with different cagA copy number, mutants with the higher cagA copy number expressed more CagA protein and translocated more CagA into gastric epithelial cell lines, which induced more cell elongation and IL-8 secretion,Citation62 suggesting an association between cagA copy number and virulence.
To examine the association among changes in cagA copy number, virulence potential of H. pylori, and the intensity of host immune response, we measured cagA copy number in H. pylori strains isolated from experimental infection of wild-type, immunodeficient and hyper-immunosensitive mice. The results demonstrated an immune-sensitive change in the multi-cagA genotype. We conclude that modulating cagA gene copy number may play a role in regulating virulence during the colonization of H. pylori in stomach.
Results
Host immune response mediates changes in cagA copy number
To investigate the effect of host immunity on H. pylori cagA copy number, C57BL/6 wild-type (WT) or Rag1−/− mutant mice were infected with PMSS1 H. pylori for 8 weeks. After the infection period, the pattern of cagA copy number in H. pylori was examined by Southern blot using chromosomal DNA isolated from PMSS1 populations (sweeps) recovered from each mouse. As shown previously,Citation61,Citation62 input strain PMSS1 showed bands of 21.0 kbp, 15.9 kbp, 10.8 kbp, and 5.8 kbp; these sizes match those predicted for 4, 3, 2 and 1 copies of cagA, respectively (), ()). This suggests that strain PMSS1 consists of a heterogeneous population in terms of cagA copy number ()). Interestingly, PMSS1 populations recovered from each WT or Rag1−/− mouse showed different patterns of Southern blot, indicating various cagA copy numbers. Populations isolated from WT1 and WT6 mice had four cagA genes as their most common genotype; populations from WT2 and WT3 showed three cagA genes as the major genotype; WT4 and WT5 showed two cagA genes; and WT7 carried a single cagA gene (), left panel). H. pylori populations isolated from Rag1−/− 3, 4, and 7 mice showed four cagA genes as their most common cagA copy number; isolates from Rag1−/− 1, 2, and 6 mice showed three cagA genes as the major cagA copy number; and strains from Rag1−/− 5 mouse showed similar intensities of 3 bands for two, three, and four cagA copies (), right panel). Although not all PMSS1 populations in each mouse showed the same patterns of cagA copy number, populations from WT mice contained more variable Southern blot profiles and decreased cagA copy number compared to those from Rag1−/− mice. These results suggest that host immune response in mice affects cagA copy number in the colonizing H. pylori population.
Figure 1. Variation of cagA copy number in mice output H. pylori populations. (a) Schematic diagram showing the principle of measuring cagA copy number in H. pylori strain PMSS1 by Southern blot. cagA gene and its flanking sequences [cagA homologous area (CHA)], SspI restriction sites, and probe binding sites were shown (modified from Jang, et al. 2017Citation62). (b) cagA copy number of H. pylori populations isolated from 7 WT and 7 Rag1−/− mice was analyzed by Southern blot. (c) The agreement between Southern blot and qPCR was evaluated by two-way mixed, single measure intraclass correlation coefficient (ICC). ICC was represented at the bottom of the plot with 95% confidence interval in parentheses. F statistic was represented with degrees of freedom in parentheses. Average cagA copy numbers of H. pylori populations isolated from each mouse were measured by densitometry analysis of Southern blot (horizontal axis) and those of 6 selected colonies were measured by qPCR (vertical axis). Each circle indicates a single H. pylori population and a number inside the circle indicates the mouse from which the population was isolated. Diagonal line indicates points where qPCR and Southern blot values are equal. (d) cagA copy number was measured in colonies isolated from WT and Rag1−/− mice after 8 weeks from infection and described in a scatterplot. Each circle indicates individual colony. A dashed horizontal line on the plot background indicates mean cagA copy number of input population (2.93). Three lines in the scatterplot indicate mean ± standard deviations.
![Figure 1. Variation of cagA copy number in mice output H. pylori populations. (a) Schematic diagram showing the principle of measuring cagA copy number in H. pylori strain PMSS1 by Southern blot. cagA gene and its flanking sequences [cagA homologous area (CHA)], SspI restriction sites, and probe binding sites were shown (modified from Jang, et al. 2017Citation62). (b) cagA copy number of H. pylori populations isolated from 7 WT and 7 Rag1−/− mice was analyzed by Southern blot. (c) The agreement between Southern blot and qPCR was evaluated by two-way mixed, single measure intraclass correlation coefficient (ICC). ICC was represented at the bottom of the plot with 95% confidence interval in parentheses. F statistic was represented with degrees of freedom in parentheses. Average cagA copy numbers of H. pylori populations isolated from each mouse were measured by densitometry analysis of Southern blot (horizontal axis) and those of 6 selected colonies were measured by qPCR (vertical axis). Each circle indicates a single H. pylori population and a number inside the circle indicates the mouse from which the population was isolated. Diagonal line indicates points where qPCR and Southern blot values are equal. (d) cagA copy number was measured in colonies isolated from WT and Rag1−/− mice after 8 weeks from infection and described in a scatterplot. Each circle indicates individual colony. A dashed horizontal line on the plot background indicates mean cagA copy number of input population (2.93). Three lines in the scatterplot indicate mean ± standard deviations.](/cms/asset/140911e8-6dcf-43cc-b1cf-9246410dc017/kgmi_a_2044721_f0001_oc.jpg)
To confirm these cagA copy number results, we performed densitometry analysis of the Southern blot profiles from each mouse. Next, we measured the cagA copy number of 6 randomly selected colonies from each mouse using qPCR as previously described.Citation62 The average cagA copy number of the 6 selected colonies was compared to the cagA copy number of the H. pylori population calculated by densitometry analysis of Southern blot profiles. The agreement between the two measurements was evaluated by a two-way mixed, single measure intraclass correlation coefficient (ICC). ICC showed a good absolute agreement between Southern blot and qPCR analysis (ICC = 0.846, P < .001, )), suggesting that the selected six colonies could effectively represent the mouse output H. pylori population from which they were isolated. Considering the heterogeneity of H. pylori sweeps, analysis of single colonies is required to further examine the changes in cagA copy number and its role in virulence. Thus, approximately six H. pylori colonies from each mouse were used for subsequent quantitative analyses.
Using this single colony approach, we first compared average cagA copy number in 5–6 colonies isolated from each of 16 C57BL/6 WT (N = 96) and 15 Rag1−/− mice (N = 89) and compared the results to input strain PMSS1. WT mice output colonies carried an average of 2.41 (± 1.11) copies of cagA, while Rag1−/− mice-output colonies had 2.96 (± 0.82) cagA copies, similar to input PMSS1, which was 2.93 (± 0.07) ()). Average cagA copy number of output colonies from WT mice was significantly lower than that of the input population (P < .001, one-sample t-test for lower tail), while Rag1−/− output colonies carried similar number of cagA copies to the input population (P = .799, one-sample two-tailed t-test). Average cagA copy number was higher in Rag1−/− output colonies than WT mice output colonies (P < .001). These results suggest that the immune response in WT mice selects for a reduced cagA copy number, which is unaffected in Rag1−/− mice.
Effect of host immune response on association among cagA copy number change, cagY recombination, and IL-8 induction
It has been reported that the host immune response induces variation of CagY function, which is caused by recombination in repeat regions of cagY.Citation53,Citation57,Citation59 This variation of CagY can alter T4SS function, which typically reduces virulence potential that is often evaluated by measuring the induction of IL-8 secretion.Citation53,Citation59 Therefore, we next examined the association between cagA copy number and cagY recombination in WT and Rag1−/− mice output colonies. Recombination of cagY was determined by cagY PCR-RFLP pattern as described previously.Citation53,Citation59 Based on the PCR-RFLP pattern, cagY in mouse output colonies was classified as same (cagY-S) or different (cagY-D), compared with that of the input strain. RFLP result of input strain and representative RFLP results of cagY-S and cagY-D colonies are shown in Figure S1. Among 96 colonies recovered from WT mice, 41 (42.7%) were cagY-D, significantly higher than only 7 of 89 (7.9%) recovered from Rag1−/− mice (P < .001, )). This difference in the distribution of cagY-S and -D is consistent with previous results.Citation59 Next, to examine how cagY recombination and cagA copy number are associated, we compared cagA copy number of strains according to whether they were cagY-S or cagY-D in strains from WT mice that yielded sufficient number of both cagY-S and -D colonies. Average cagA copy number of cagY-S and cagY-D colonies in WT mice was 2.24 (± 1.21) and 2.63 (± 0.93), respectively ()). cagY-S colonies carried fewer cagA copies than cagY-D colonies, though the P-value was slightly above the significance threshold (P = .081). On the other hand, WT-output colonies carrying more cagA copies were likely to have recombined cagY (P = .044, )).
Figure 2. Effect of host immune response on IL-8 induction and cagA copy number. (a) Colonies recovered from WT or Rag1−/− mice 8 weeks PI were classified according to cagY recombination status and number of colonies was indicated. (b) cagA copy number was measured in cagY-S and cagY-D colonies isolated from WT mice 8 weeks PI. (c) WT mice-output colonies were classified according to their cagA copy number and cagY recombination status, and the number of colonies in each group was described. Group 1: 0 ≤ cagA copy number < 1.5; Group 2: 1.5 ≤ cagA copy number < 2.5; Group 3: 2.5 ≤ cagA copy number < 3.5; Group 4: 3.5 ≤ cagA copy number. Association between cagY recombination and cagA copy number was examined using chi-square test for trend in proportions.(d) Induction of IL-8 was measured in colonies isolated from WT and Rag1−/− mice and described in a scatterplot. (e) WT mice-output colonies were classified according to their cagY recombination status and virulence potential, and the number of colonies in each group was described. A colony was classified to be ‘hypovirulent’ if it induced less IL-8 than half of that induced by input strain PMSS1, otherwise classified to be ‘virulent’. (f) cagA copy number was measured in ‘virulent’ and ‘hypovirulent’ WT-output colonies. Each circle in scatterplots (panels b, d, and f) indicates individual colony. Three lines in the scatterplot indicates mean ± standard deviations.
The function of the H. pylori T4SS is governed not only by cagY recombination but also by other genes located inside or outside cagPAI.Citation64–70 Thus, cagY-S strains may have a nonfunctional T4SS, and cagY-D strains may have a functional T4SS, as reported previously.Citation53 Secretion of IL-8 from H. pylori-infected cells has been used to measure the capacity of H. pylori to induce host inflammation. We therefore measured the relative amount of IL-8 secretion induced by each single colony compared to that induced by the input strain and used it to evaluate the virulence potential of each single colony isolate. As a result, average IL-8 induction of WT output colonies [0.44 (± 0.37)] was lower than that of Rag1−/− output colonies [0.90 (± 0.30)] (P < .001, )). Since relative induction of IL-8 showed a bimodal distribution centered around 0.5, we classified strains inducing IL-8 less than half of that induced by input strain PMSS1 as ‘hypovirulent’ and the rest as ‘virulent’. Among WT output colonies, 65 (67.7%) were ‘hypovirulent’, while only 8 colonies (9.0%) isolated from Rag1−/− mice were ‘hypovirulent’. Among 96 colonies isolated from WT mice, 31 out of 55 cagY-S colonies (56.4%) nevertheless were ‘hypovirulent’, while 34 out of 41 (82.9%) cagY-D colonies were ‘hypovirulent’ ()). Though there was an association between recombination of cagY and low virulence potential (P = .011, )), our results imply that cagY recombination was not the sole cause of reduction of virulence potential, as recently reported.Citation65 Strains classified as ‘virulent’ carried fewer cagA copies than ‘hypovirulent’ strains (P = .019, )).
Stronger immune response is associated with lower cagA copy number
Since a functional immune response is necessary to select for reduced cagA copy number, we next asked whether the intensity of the immune response is associated with cagA copy number reduction. It has been reported that H. pylori represses immune response by inducing expression of IL-10, an anti-inflammatory cytokine,Citation71–73 and therefore mice deficient with IL-10 (Il10−/−) show a more intense immune response against H. pylori than WT mice.Citation74 Thus, we analyzed the cagA copy number in colonies isolated from WT and Il10−/− mice, which were previously demonstrated to have markedly increased gastric inflammation.Citation59 Because the H. pylori load in Il10−/− mice rapidly decreases as the infection duration prolongs,Citation59 the experimental period was shortened to 4 weeks to obtain sufficient number of colonies for examination. This enables evaluating the effect of intense inflammatory response on cagA copy number change, while data obtained from Rag1−/− and Il10−/− mice cannot be directly compared due to the difference in experiment duration. At 4 weeks post-infection (PI), 72 colonies were isolated from 12 WT mice, and 82 colonies were isolated from 15 Il10−/− mice. Colonies from Il10−/− mice carried an average of 2.12 (± 1.20) copies of cagA, which was significantly fewer than colonies from WT mice (2.85 ± 0.98, P < .001, )). In 11 colonies from 2 Il10−/− mice, cagA was undetectable. These results suggest that cagA copy number tends to decrease as the intensity of host immune response increases.
Figure 3. Changes of cagA copy number in WT and Il10−/− mice-derivedH. pylori colonies according to cagY recombination status. cagA copy number was measured in colonies isolated from WT and Il10−/− mice 4 weeks PI. Colonies were further classified according to cagY recombination status. cagA copy number of each colony was described in a scatterplot. (a) All colonies, (b) cagY-S colonies, and (c) cagY-D colonies. Each circle indicates an individual colony. A dashed horizontal line on the plot background indicates mean cagA copy number of input population (2.93). Three lines in the scatterplot indicate mean ± standard deviations.
Next, to examine whether the recombination in cagY is associated with change of cagA copy number in an intense inflammatory environment, we analyzed cagA copy number of H. pylori colonies isolated from WT and Il10−/− mice separately according to the recombination status in cagY. Among WT output colonies, 9 of 72 (12.5%) were classified as cagY-D, compared to 22 of 82 (26.8%) from Il10−/− mice. When cagY-S output colonies of WT and Il10−/− mice were compared, Il10−/− mice output colonies had fewer cagA copies [2.46 (± 0.88)] than WT output colonies [2.85 (± 1.04)] (P = .027, )). More drastic decrease in cagA copy number was observed in cagY-D colonies isolated from Il10−/− mice. Average cagA copy number of cagY-D colonies isolated from Il10−/− mice was 1.20 (± 1.48), while that of cagY-D colonies isolated from WT mice was 2.88 (± 0.35) (P < .001, )). All colonies that lost all cagA genes were classified as cagY-D. Overall, both cagY-S and cagY-D colonies showed a tendency to have fewer cagA copies in a more intense inflammatory environment. However, in colonies that underwent recombination in cagY, change of cagA copy number might be more intensively affected by the intensity of inflammation.
Association of cagA copy number with IL-8 induction
Since PMSS1 strains carrying more cagA copies induce more IL-8 secretion in vitro,Citation62 we next asked whether the association between cagA copy number and IL-8 induction would be maintained during in vivo mouse infection in a situation where recombination in cagY and change of cagA copy number are allowed to occur. To address this, we measured induction of IL-8 in 4-week mouse output colonies from WT and Il10−/− mice and analyzed the correlation between cagA copy number and secretion of IL-8. We found a positive correlation between cagA copy number and IL-8 secretion in 72 colonies isolated from WT mice (r = 0.472, P < .001, )), but the relationship held only among colonies in which cagY did not undergo recombination (r = 0.586, P < .001 for cagY-S colonies and r = 0.500, P = .171 for cagY-D colonies, Figure S2 a,b). A positive correlation between cagA copy number and IL-8 was also observed in 82 colonies isolated from Il10−/− mice (r = 0.551, P < .001, )). Similar to the WT output colonies, correlation between cagA copy number and IL-8 secretion was maintained only in cagY-S colonies (r = 0.469, P < .001 for cagY-S colonies and r = 0.160, P = .477 for cagY-D colonies, Figure S2 c,d). These results demonstrate that cagA copy number and capacity to induce IL-8 are positively correlated in vivo, a relationship that is driven primarily by colonies that have not undergone cagY recombination.
Figure 4. Correlation between cagA copy number and induction of IL-8 secretion in AGS cells was measured in WT and Il10−/− mice-derivedH. pylori colonies. Correlation between cagA copy number and induction of IL-8 secretion in AGS cells was analyzed by calculating Pearson correlation coefficient. cagA copy number and induction of IL-8 secretion of each colony were plotted. Each circle indicates individual colony. (a) WT mice-output colonies, and (b) Il10−/− mice-output colonies.
In Rag1−/− mice-output colonies 8 weeks PI, the induction level of IL-8 secretion was hardly correlated with cagA copy number (Figure S3a), and the biased distribution of colonies to cagY-S made it problematic to compare cagY-S and cagY-D colonies (Figure S3b,c). In colonies isolated from WT mice, the more dispersed distribution of relative IL-8 expression resulted in a weak negative correlation between cagA copy number and IL-8 secretion (Figure S3d). A similar correlation pattern was observed when cagY-D colonies were examined while no correlation pattern was observed in cagY-S colonies (Figure S3e,f). These results suggest that unrevealed changes occurred in H. pylori during prolonged infection may lower the impact of cagA copy number on virulence.
Modeling the association of cagA copy number, cagY recombination, and IL-8 induction
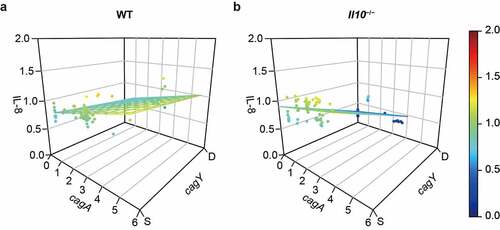
Since both cagY recombination and cagA copy number affect the capacity to induce IL-8 in mouse output colonies, we sought to model the association by employing multiple linear regression (, ). The overall model suggests that relative IL-8 secretion will increase 0.073 units per 1 copy increase of cagA gene and decrease 0.189 units with cagY recombination in WT output colonies (R2 = 0.383, P < .001, ), , left panel). Similar but more robust relationships were observed in colonies isolated from Il10−/− mice (R2 = 0.818, P < .001, ), , right panel). This analysis demonstrates that change in cagA copy number and recombination in cagY each contribute to the capacity to induce IL-8 in mouse output colonies, particularly in colonies from Il10−/− mice.
Table 1. Effect of cagA copy number and cagY recombination on induction of IL-8 secretion in AGS cells, in 4-week mice output colonies
Figure 5. Effect of cagA copy number and cagY recombination on IL-8 secretion in AGS cells was measured in WT and Il10−/− mice-derivedH. pylori colonies. Induction of IL-8 secretion was predicted by multiple linear regression, based on cagA copy number and cagY recombination status of each mouse output colony. 3D scatterplot describing cagA copy number, cagY recombination status, and induction of IL-8 secretion of colonies isolated from (a) WT mice, and (b) Il10−/− mice. Each circle indicates individual colony and colored plane indicates a regression plane.
Discussion
Previous studies reported that multi-cagA genotype was found in about 7.5% of clinical H. pylori isolates in the United States.Citation62,Citation63 H. pylori strain PMSS1, possessing multi-cagA genotype, was shown to consist of organisms with varying number of cagA genes, ranging from zero to four copies in vitro.Citation61,Citation62 Strains with more cagA copies expressed more CagA protein and translocated more CagA into gastric epithelial cell lines, which induced more cell elongation and IL-8 secretion.Citation62 These results suggest an association between cagA copy number and virulence. Furthermore, increase of cagA copy number up to seven copies from single cagA was reported in a recent experimental H. pylori infection study on human subjects, which was conducted to examine bacterial adaptation during early stages of infection.Citation14 Among the reisolates, some showed loss of ability to induce IL-8 secretion, which was assumed to be due to a mutation in cagE or cagY. Nonsynonymous mutations and sequence variations in genes encoding other cagPAI proteins or outer membrane proteins were also discovered in other reisolates. This implies that, during colonization of a new host, virulence potential of H. pylori may be altered by various factors including change in cagA copy number. Here, we have further investigated the immunologic basis and functional significance for the change in cagA copy number in multi-cagA genotype during H. pylori infection of mice.
Our results suggest that the host immune response affects cagA copy number. Rag1−/− mice-output colonies carried more cagA copies than WT mice-output colonies, and Il10−/− mice-output colonies carried fewer cagA copies than WT mice-output colonies (). Thus, a weaker immune response is associated with higher cagA copy number, while a stronger immune response is associated with lower cagA copy number. H. pylori colonies isolated from all groups except Rag1−/− showed decrease in cagA copy number during infection, compared to average cagA copy number of input population. There were 11 strains isolated from 2 Il10−/− mice that completely lost their cagA. In addition to an effect of host immune response toward a decrease in cagA copy number, a host-specific factor might affect this striking decrease of cagA in strains isolated from specific mice. It is known that the host immune response in mice exerts a driving force against H. pylori infection, and that strains colonizing robustly tend to have a less functional T4SS and to induce low IL-8 secretion.Citation59 Although it has been reported that the recombination in cagY leads to the reduction of H. pylori virulence by lowering T4SS function,Citation53,Citation59 many other genes in which mutations affect virulence were also reported.Citation65 Since CagA induces an immune response that is detrimental to bacterial survival,Citation38,Citation39 a decrease in cagA copy number might be a response of H. pylori to lower the host inflammatory response. Alternatively, decreased cagA copy might result from selection against strains expressing high cagA copy number. Our results do not permit us to distinguish between these two mechanistic explanations, but the latter seems more likely.
The positive correlation between cagA copy number and the virulence of laboratory-grown and mouse-output H. pylori strains has been shown in a previous studyCitation62 and this study (, S2), respectively. In this study, we showed that the positive correlation between cagA copy number and the virulence of H. pylori strain was prominent among cagY-S colonies (Figure S2). Because CagA is translocated into host cells via the T4SS,Citation16,Citation17,Citation75 it can be easily assumed that T4SS may also have an important role in regulating CagA-mediated host inflammatory response. It is notable that no or weak correlation between cagA copy number and virulence was observed in mice-output colonies at 8 weeks PI (Figure S3). This suggests that genetic changes related to T4SS function may occur during prolonged infection and result in a weakening of correlation between cagA copy number and the virulence of H. pylori.
Multiple linear regression analysis showed that IL-8 secretion of infected cells can be explained by cagA copy number and cagY recombination status better in H. pylori colonies isolated from Il10−/− than from WT mice (). This suggests that modulation of H. pylori virulence via cagA copy number and cagY recombination is more critical in a harsh host environment. However, recombination in cagY does not always lead to a loss of T4SS function, and cagY-mediated change of T4SS function may occur gradually rather than in an on-and-off fashion.Citation53,Citation59 Thus, even though binary modeling of cagY recombination status we used here provides a useful model to analyze changes in cagA copy number according to the host environment and strain capacity for IL-8 secretion, it should be interpreted cautiously.
Multiple linear regression analysis also showed that cagA and cagY play a role in an inflammatory response induced by H. pylori (, ). Our results imply that virulence of H. pylori might be regulated not only by a combined effect of change of cagA copy number and recombination in cagY but also by additional mechanisms that affect T4SS function. Many components of T4SS or other virulence factors of H. pylori have been reported to interact with CagA or affect T4SS function. For example, in addition to CagY, other T4SS components such as CagI, CagL, and CagQ were reported to interact with CagA,Citation69,Citation70 and to be indispensable for the formation of T4SS pilus.Citation76 Hansen et al.Citation65 also identified mutations in cagPAI genes including cag5, cag10, cagA, and cagY from mouse-passaged strains which lost T4SS function. On the other hand, outer membrane proteins such as OipA, BabA, and HopQ can affect CagA translocation and IL-8 secretion via T4SS.Citation66–68 Thus, these proteins may also influence host inflammatory response by affecting T4SS function. Investigating genetic and phenotypic variations of other components of H. pylori and how those variations affect T4SS function and host inflammatory response can be an interesting topic for future study.
In conclusion, changes in cagY and in cagA copy number mediate H. pylori persistence in the face of the host inflammatory response. Whether these changes result from bacterial regulation or selective killing is unknown and remains a topic for further study.
Materials and methods
H. pylori strains and culture conditions
H. pylori strain PMSS1Citation77 and its mouse-passaged derivatives acquired in a previous studyCitation59 were used in this study. A total of 339 mouse-passaged PMSS1 isolates recovered from 58 mice were examined for cagA copy number, cagY recombination, and capacity to induce IL-8 in AGS human gastric adenocarcinoma cells (ATCC #CRL-1739). Briefly, 10- to 12-week-old female C57BL/6 WT, Rag1−/−, or Il10−/− mice were challenged with 2.5 × 10⁹ CFU of H. pylori PMSS1. All mice were purchased from The Jackson Laboratory. Stock numbers for C57BL/6 WT, Rag1−/−, or Il10−/− mice were 000664, 002216, and 002251, respectively. Mice were euthanized at 4 or 8 weeks PI. Stomachs were taken and half of each stomach was homogenized, serially diluted, and plated onto brucella agar (BD BBL) plates supplemented with 5% heat-inactivated newborn calf serum (Invitrogen) and antibiotics (20 μg/ml amphotericin B, 200 μg/ml bacitracin, 3.3 μg/ml polymyxin B, 10.7 μg/ml nalidixic acid, and 100 μg/ml vancomycin).Citation53 After the initial culture, brucella agar plates supplemented with 5% heat-inactivated newborn calf serum, 5 μg/ml trimethoprim, 10 μg/ml vancomycin, 2.5 units/ml polymyxin B, and 2.5 μg/ml amphotericin B were used for further passage.Citation53 Cultures were incubated at 37°C under microaerophilic atmosphere (5% O2, 7.6% CO2, and 7.6% H2) generated by Anoxomat (Advanced Instruments), as previously described.Citation53
Southern blot analysis
To identify variation of cagA copy number in H. pylori population isolated from mice, Southern blot was performed as previously described.Citation61 Briefly, H. pylori genomic DNA was digested with restriction enzyme SspI (New England Biolabs) for 2 h, then separated on a 0.5% agarose gel overnight at 0.75 V/cm. Separated DNA fragments were then transferred to a nylon membrane. Part of cagA gene of H. pylori strain PMSS1 was PCR-amplified using primers D008 and R008 (). The resulting 298-bp fragment was labeled with biotin using a North2South biotin Random Prime Labeling kit (Thermo Scientific) and used as a probe for Southern blot. Hybridization and detection were performed using North2South chemiluminescent hybridization and detection kit according to the manufacturer’s instructions. cagA copy numbers were determined based on fragment size and the known restriction map of the cagA locus.
Table 2. Primers used in this study
To determine the cagA copy number of H. pylori population, Southern blot profiles were densitometrically analyzed using ImageJ software (National Institute of Health, USA). Density of individual Southern blot bands corresponding 4, 3, 2, and 1 cagA copy was respectively measured, and these values were called ‘raw density’. Since an isolate carrying multiple cagA genes will have multiple probe-binding sites, raw densities were divided with cagA copy number of each band from which the raw density was measured, and these values were called ‘calibrated density’. Then, the sum of all raw densities of a population was divided with the sum of all calibrated densities of the population to get an average cagA copy number of the H. pylori population. This process is summarized in Figure S4.
Quantitative polymerase chain reaction (qPCR)
cagA copy number of each mouse output colony was measured by qPCR using the 2−ΔΔCT method.Citation78,Citation79 ureA was used as a reference gene and H. pylori strain PMSS1/cagA-SF-1,Citation62 which has a single copy of cagA, was used as a calibrator. Briefly, −ΔΔCT can be obtained by calculating ΔCT of target − ΔCT of calibrator, where ΔCT = CT of cagA − ΔCT of ureA, and CT means a threshold cycle. Thus, 2−ΔΔCT of a certain single colony isolate is a multiple of cagA copy number compared to that of calibrator strain, so it can be regarded as a cagA copy number of a certain single colony isolate. Primers used for amplification of cagA or ureA are described in . Genomic DNA was isolated from each H. pylori strain using Nucleospin 96 Tissue kit (Machery-Nagel) under the manufacturer’s instruction. qPCR reaction mixtures contained 1 ng of template DNA, 10 μl of SYBR Premix Ex Taq (Tli RNaseH Plus; Takara Bio), 0.4 μl of ROX reference dye, and 200 nM of each primer, in a total reaction volume of 20 μl. Reaction mixtures were transferred into a MicroAmp optical 96-well plate (Applied Biosystems), which was sealed with MicroAmp optical adhesive film (Applied Biosystems). qPCR was performed as follows: 95°C for 30 s, 40 cycles of 95°C for 5 s and 60°C for 30 s. After the amplification was finished, melting curve was analyzed to ensure proper annealing of primers and amplification of target sequence. QuantStudio 6 Flex Real-Time PCR System (ThermoFisher Scientific) was used to perform qPCR and data were analyzed using QuantStudio Real-Time PCR Software v1.0. All samples were run in triplicate for each primer pair. Results obtained from different qPCR runs were calibrated as previously described.Citation80 Mean cagA copy numbers were presented with standard deviation in parentheses.
cagY PCR-restriction fragment length polymorphism (RFLP)
Genomic DNA isolated from each mouse output colony was subjected to PCR-RFLP to detect the recombination in cagY, as described previously.Citation53 The region containing cagY was amplified using a previously described primer pair () with Expand Long Template PCR System (Roche Diagnostics). PCR reaction mixtures contained 100 ng of genomic DNA, 0.3 μM of each primer, 0.35 mM of each dNTP, 3.75 U of Expand Taq DNA polymerase, and 1× buffer containing 1.75 mM MgCl2 in total volume of 50 μl. PCR products were purified using QIAquick PCR purification kit (QIAGEN Sciences) and 840 μg of each purified DNA was separately digested overnight with DdeI or BfucI (New England Biolabs) at 37°C. After digestion, DNA was electrophoresed in a 5% agarose gel and stained with ethidium bromide. Size of the amplicon and two RFLP patterns of each mouse output colony were compared with those of the PMSS1 input strain. If cagY from an output colony differed in size or RFLP pattern from that of PMSS1, it was considered to have undergone cagY recombination.
IL-8 enzyme-linked immunosorbent assay (ELISA)
IL-8 secretion from AGS cells was measured by ELISA as previously described.Citation81 AGS cells were maintained in RPMI 1640 (Gibco BRL) supplemented with 10% FBS (Invitrogen) and 1% penicillin/streptomycin (Invitrogen). For IL-8 ELISA, AGS cells were seeded on a 6-well cell culture plate with a density of 5 × 10⁵ cells/well in 1.8 ml of RPMI 1640 with 10% FBS, and then incubated 24 h at 37°C. H. pylori strains were diluted in 200 μl of brucella broth (BD BBL) and added to AGS cells with a multiplicity of infection of 100. H. pylori strain PMSS1 and its isogenic ΔcagY mutantCitation53 were used as positive and negative controls, respectively. IL-8 induction of output colonies was expressed as a relative unit compared to that induced by PMSS1.
Statistical analysis
Statistical analyses were conducted using IBM SPSS version 23.0 software (IBM, Armonk, NY), and R version 3.5.3 (R core team) with packages ggplot2 (https://ggplot2.tidyverse.org/), ggbeeswarm (https://CRAN.R-project.org/package=ggbeeswarm), and plot3D (https://CRAN.R-project.org/package=plot3D). Intraclass correlation coefficient (ICC, two-way mixed, single measure) was used to examine agreement between cagA copy number measured by densitometry analysis of Southern blot and by qPCR. Average cagA copy number of mouse output colonies was compared to that of the input PMSS1 population using a one-sample t test and compared to each other using a two-sample t test. Homogeneity of variances across each group was analyzed by Levene’s test. Correlation between cagA copy number and relative IL-8 induction was measured by calculating Pearson correlation coefficient. Multiple linear regression was calculated based on cagA copy number and cagY recombination status. Adjusted R2 values were used to evaluate the explanatory power of regression models. All analyses were considered to be statistically significant when P value is less than 0.05.
Data availability
All data are contained in the article and the supporting information.
Author contributions
J.V.S. and J.-H.C. designed the study. S.J. and L.M.H. performed the experiments and analyzed the data. S.J. wrote the manuscript. H.S., J.V.S. and J.-H.C. supervised and edited the manuscript. All authors reviewed and approved the manuscript.
Supplemental Material
Download Zip (11.9 MB)Acknowledgments
This work was supported by the National Natural Science Foundation of China (No. 31870124), and National Institutes of Health (R01 AI108713 to JVS). The content is solely the responsibility of the authors and does not necessarily represent the official views of the National Institutes of Health. This work was supported by the National Research Foundation of Korea (NRF) grant funded by the Korea government (Ministry of Science and ICT) (2021R1A2C1003270).
Disclosure statement
No potential conflict of interest was reported by the author(s).
Supplemental data
Supplemental data for this article can be accessed on the publisher’s website
Additional information
Funding
References
- Blaser MJ. Science, medicine, and the future: Helicobacter pylori and gastric diseases. BMJ. 1998;316(7143):1507–17. doi:10.1136/bmj.316.7143.1507.
- IARC Working Group on the Evaluation of Carcinogenic Risks to Humans. Schistosomes, liver flukes and Helicobacter pylori. Lyon (FR): International Agency for Research on Cancer. 1994; Vol. 61: 177–241.
- Hooi JKY, Lai WY, Ng WK, Suen MMY, Underwood FE, Tanyingoh D, Malfertheiner P, Graham DY, Wong VWS, and Wu JCY, et al. Global prevalence of Helicobacter pylori infection: systematic review and meta-analysis. Gastroenterology. 2017;153(2):420–429. doi:10.1053/j.gastro.2017.04.022.
- Ferlay J, Soerjomataram I, Dikshit R, Eser S, Mathers C, Rebelo M, Parkin DM, Forman D, Bray F. Cancer incidence and mortality worldwide: sources, methods and major patterns in GLOBOCAN 2012. Int J Cancer. 2015;136(5):E359–86. doi:10.1002/ijc.29210.
- Falush D, Wirth T, Linz B, Pritchard JK, Stephens M, Kidd M. Traces of human migrations in Helicobacter pylori populations. Science. 2003;299:1582–1585. doi:10.1126/science.1080857.
- Wirth T, Wang X, Linz B, Novick RP, Lum JK, Blaser M, Morelli G, Falush D, Achtman M. Distinguishing human ethnic groups by means of sequences from Helicobacter pylori: lessons from Ladakh. Proc Natl Acad Sci U S A. 2004;101(14):4746–4751. doi:10.1073/pnas.0306629101.
- Kodaman N, Pazos A, Schneider BG, Piazuelo MB, Mera R, Sobota RS, Sicinschi LA, Shaffer CL, Romero-Gallo J, de Sablet T, et al. Human and Helicobacter pylori coevolution shapes the risk of gastric disease. Proc Natl Acad Sci U S A. 2014;111(4):1455–1460. doi:10.1073/pnas.1318093111.
- Didelot X, Nell S, Yang I, Woltemate S, van der Merwe S, Suerbaum S. Genomic evolution and transmission of Helicobacter pylori in two South African families. Proc Natl Acad Sci U S A. 2013;110:13880–13885. doi:10.1073/pnas.1304681110.
- Falush D, Kraft C, Taylor NS, Correa P, Fox JG, Achtman M, Suerbaum S. Recombination and mutation during long-term gastric colonization by Helicobacter pylori: estimates of clock rates, recombination size, and minimal age. Proc Natl Acad Sci U S A. 2001;98:15056–15061. doi:10.1073/pnas.251396098.
- Furuta Y, Konno M, Osaki T, Yonezawa H, Ishige T, Imai M, Shiwa Y, Shibata-Hatta M, Kanesaki Y, Yoshikawa H, et al. Microevolution of virulence-related genes in Helicobacter pylori familial infection. PLoS One. 2015;10:e0127197. doi:10.1371/journal.pone.0127197.
- Kennemann L, Didelot X, Aebischer T, Kuhn S, Drescher B, Droege M, Reinhardt R, Correa P, Meyer TF, Josenhans C, et al. Helicobacter pylori genome evolution during human infection. Proc Natl Acad Sci U S A. 2011;108(12):5033–5038. doi:10.1073/pnas.1018444108.
- Linz B, Windsor HM, McGraw JJ, Hansen LM, Gajewski JP, Tomsho LP, Hake CM, Solnick JV, Schuster SC, Marshall BJ. A mutation burst during the acute phase of Helicobacter pylori infection in humans and rhesus macaques. Nat Commun. 2014;5(1):4165. doi:10.1038/ncomms5165.
- Morelli G, Didelot X, Kusecek B, Schwarz S, Bahlawane C, Falush D, Suerbaum S, Achtman M. Microevolution of Helicobacter pylori during prolonged infection of single hosts and within families. PLoS Genet. 2010;6(7):e1001036. doi:10.1371/journal.pgen.1001036.
- Nell S, Estibariz I, Krebes J, Bunk B, Graham DY, Overmann J, Song Y, Sproer C, Yang I, Wex T, et al. Genome and methylome variation in Helicobacter pylori with a cag pathogenicity island during early stages of human infection. Gastroenterology. 2018;154(3):612–623 e7. doi:10.1053/j.gastro.2017.10.014.
- Blaser MJ, Perez-Perez GI, Kleanthous H, Cover TL, Peek RM, Chyou PH, Stemmermann GN, Nomura A. Infection with Helicobacter pylori strains possessing cagA is associated with an increased risk of developing adenocarcinoma of the stomach. Cancer Res. 1995;55:2111–2115.
- Censini S, Lange C, Xiang Z, Crabtree JE, Ghiara P, Borodovsky M, Rappuoli R, Covacci A. cag, a pathogenicity Island of Helicobacter pylori, encodes type I-specific and disease-associated virulence factors. Proc Natl Acad Sci U S A. 1996;93(25):14648–14653. doi:10.1073/pnas.93.25.14648.
- Odenbreit S, Puls J, Sedlmaier B, Gerland E, Fischer W, Haas R. Translocation of Helicobacter pylori CagA into gastric epithelial cells by type IV secretion. Science. 2000;287:1497–1500. doi:10.1126/science.287.5457.1497.
- Poppe M, Feller SM, Romer G, Wessler S. Phosphorylation of Helicobacter pylori CagA by c-Abl leads to cell motility. Oncogene. 2007;26(24):3462–3472. doi:10.1038/sj.onc.1210139.
- Selbach M, Moese S, Hauck CR, Meyer TF, Backert S. Src is the kinase of the Helicobacter pylori CagA protein in vitro and in vivo. J Biol Chem. 2002;277(9):6775–6778. doi:10.1074/jbc.C100754200.
- Jones KR, Whitmire JM, and Merrell DS. A tale of two toxins: Helicobacter pylori CagA and VacA modulate host pathways that impact disease. Front Microbiol. 2010;1:115. doi:10.3389/fmicb.2010.00115.
- Yong X, Tang B, Li BS, Xie R, Hu CJ, Luo G, Qin Y, Dong H, Yang S-M. Helicobacter pylori virulence factor CagA promotes tumorigenesis of gastric cancer via multiple signaling pathways. Cell Commun Signal. 2015;13(1):30. doi:10.1186/s12964-015-0111-0.
- Franco AT, Israel DA, Washington MK, Krishna U, Fox JG, Rogers AB, Neish AS, Collier-Hyams L, Perez-Perez GI, and Hatakeyama M. Activation of β-catenin by carcinogenic Helicobacter pylori. Proc Natl Acad Sci U S A. 2005;102(30):10646–10651. doi:10.1073/pnas.0504927102.
- Liu N, Zhou N, Chai N, Liu X, Jiang H, Wu Q, Li Q. Helicobacter pylori promotes angiogenesis depending on Wnt/beta-catenin-mediated vascular endothelial growth factor via the cyclooxygenase-2 pathway in gastric cancer. BMC Cancer. 2016;16(1):321. doi:10.1186/s12885-016-2351-9.
- Murata-Kamiya N, Kurashima Y, Teishikata Y, Yamahashi Y, Saito Y, Higashi H, Aburatani H, Akiyama T, Peek RM, Azuma T. Helicobacter pylori CagA interacts with E-cadherin and deregulates the beta-catenin signal that promotes intestinal transdifferentiation in gastric epithelial cells. Oncogene. 2007;26(32):4617–4626. doi:10.1038/sj.onc.1210251.
- Yong X, Tang B, Xiao YF, Xie R, Qin Y, Luo G, Hu C-J, Dong H, Yang S-M. Helicobacter pylori upregulates Nanog and Oct4 via Wnt/β-catenin signaling pathway to promote cancer stem cell-like properties in human gastric cancer. Cancer Lett. 2016;374(2):292–303. doi:10.1016/j.canlet.2016.02.032.
- Bronte-Tinkew DM, Terebiznik M, Franco A, Ang M, Ahn D, Mimuro H. Helicobacter pylori cytotoxin-associated gene A activates the signal transducer and activator of transcription 3 pathway in vitro and in vivo. Cancer Res. 2009;69:632–639. doi:10.1158/0008-5472.CAN-08-1191.
- Chang YJ, Wu MS, Lin JT, Pestell RG, Blaser MJ, Chen CC. Mechanisms for Helicobacter pylori CagA-induced cyclin D1 expression that affect cell cycle. Cell Microbiol. 2006;8(11):1740–1752. doi:10.1111/j.1462-5822.2006.00743.x.
- Lee IO, Kim JH, Choi YJ, Pillinger MH, Kim SY, Blaser MJ, Lee YC. Helicobacter pylori CagA phosphorylation status determines the gp130-activated SHP2/ERK and JAK/STAT signal transduction pathways in gastric epithelial cells. J Biol Chem. 2010;285(21):16042–16050. doi:10.1074/jbc.M110.111054.
- Amieva MR, Vogelmann R, Covacci A, Tompkins LS, Nelson WJ, Falkow S. Disruption of the epithelial apical-junctional complex by Helicobacter pylori CagA. Science. 2003;300:1430–1434. doi:10.1126/science.1081919.
- Bagnoli F, Buti L, Tompkins L, Covacci A, Amieva MR. Helicobacter pylori CagA induces a transition from polarized to invasive phenotypes in MDCK cells. Proc Natl Acad Sci U S A. 2005;102:16339–16344.
- Saadat I, Higashi H, Obuse C, Umeda M, Murata-Kamiya N, Saito Y, Lu H, Ohnishi N, Azuma T, Suzuki A. Helicobacter pylori CagA targets PAR1/MARK kinase to disrupt epithelial cell polarity. Nature. 2007;447(7142):330–333. doi:10.1038/nature05765.
- Zeaiter Z, Huynh HQ, Kanyo R, Stein M. CagA of Helicobacter pylori alters the expression and cellular distribution of host proteins involved in cell signaling. FEMS Microbiol Lett. 2008;288:227–234. doi:10.1111/j.1574-6968.2008.01356.x.
- Tan S, Noto JM, Romero-Gallo J, Peek RM Jr., and Amieva MR. Helicobacter pylori perturbs iron trafficking in the epithelium to grow on the cell surface. PLoS Pathog. 2011;7(5):e1002050. doi:10.1371/journal.ppat.1002050.
- Tan S, Tompkins LS, Amieva MR. Helicobacter pylori usurps cell polarity to turn the cell surface into a replicative niche. PLoS Pathog. 2009;5(5):e1000407. doi:10.1371/journal.ppat.1000407.
- Brandt S, Kwok T, Hartig R, Konig W, and Backert S. NF-ϰB activation and potentiation of proinflammatory responses by the Helicobacter pylori CagA protein. Proc Natl Acad Sci U S A. 2005;102(26):9300–9305. doi:10.1073/pnas.0409873102.
- Kim SY, Lee YC, Kim HK, Blaser MJ. Helicobacter pylori CagA transfection of gastric epithelial cells induces interleukin-8. Cell Microbiol. 2006;8(1):97–106. doi:10.1111/j.1462-5822.2005.00603.x.
- Li N, Tang B, Jia YP, Zhu P, Zhuang Y, Fang Y, Li Q, Wang K, Zhang W-J, Guo G, et al. Helicobacter pylori CagA protein negatively regulates autophagy and promotes inflammatory response via c-Met-PI3K/Akt-mTOR signaling pathway. Front Cell Infect Microbiol. 2017;7:417. doi:10.3389/fcimb.2017.00417.
- Bhat N, Gaensbauer J, Peek RM, Bloch K, Tham KT, Blaser MJ, Perez-Perez G. Local and systemic immune and inflammatory responses to Helicobacter pylori strains. Clin Diagn Lab Immunol. 2005;12(12):1393–1400. doi:10.1128/CDLI.12.12.1393-1400.2005.
- Covacci A, Censini S, Bugnoli M, Petracca R, Burroni D, Macchia G, Massone A, Papini E, Xiang Z, Figura N. Molecular characterization of the 128-kDa immunodominant antigen of Helicobacter pylori associated with cytotoxicity and duodenal ulcer. Proc Natl Acad Sci U S A. 1993;90(12):5791–5795. doi:10.1073/pnas.90.12.5791.
- Blanchard TG, Yu F, Hsieh CL, and Redline RW. Severe inflammation and reduced bacteria load in murine Helicobacter infection caused by lack of phagocyte oxidase activity. J Infect Dis. 2003;187:1609–1615. doi:10.1086/374780.
- Ismail HF, Zhang J, Lynch RG, Wang Y, Berg DJ. Role for complement in development of Helicobacter-induced gastritis in interleukin-10-deficient mice. Infect Immun. 2003;71:7140–7148. doi:10.1128/IAI.71.12.7140-7148.2003.
- Franco AT, Johnston E, Krishna U, Yamaoka Y, Israel DA, Nagy TA, Wroblewski LE, Piazuelo MB, Correa P, Peek RM. Regulation of gastric carcinogenesis by Helicobacter pylori virulence factors. Cancer Res. 2008;68:379–387. doi:10.1158/0008-5472.CAN-07-0824.
- Wang SK, Zhu HF, He BS, Zhang ZY, Chen ZT, Wang ZZ, Wu GL. CagA+ H pylori infection is associated with polarization of T helper cell immune responses in gastric carcinogenesis. World J Gastroenterol. 2007;13:2923–2931. doi:10.3748/wjg.v13.i21.2923.
- Akhiani AA, Pappo J, Kabok Z, Schon K, Gao W, Franzen LE, Lycke N. Protection against Helicobacter pylori infection following immunization is IL-12-dependent and mediated by Th1 cells. J Immunol. 2002;169:6977–6984. doi:10.4049/jimmunol.169.12.6977.
- Larussa T, Leone I, Suraci E, Imeneo M, and Luzza F. Helicobacter pylori and T helper cells: mechanisms of immune escape and tolerance. J Immunol Res. 2015;2015:981328. doi:10.1155/2015/981328.
- Appelmelk BJ, Martin SL, Monteiro MA, Clayton CA, McColm AA, Zheng P, Verboom T, Maaskant JJ, van den Eijnden DH, Hokke CH, et al. Phase variation in Helicobacter pylori lipopolysaccharide due to changes in the lengths of poly(C) tracts in alpha3-fucosyltransferase genes. Infect Immun. 1999;67:5361–5366. doi:10.1128/IAI.67.10.5361-5366.1999.
- Beier D, Frank R. Molecular characterization of two-component systems of Helicobacter pylori. J Bacteriol. 2000;182:2068–2076. doi:10.1128/JB.182.8.2068-2076.2000.
- Josenhans C, Eaton KA, Thevenot T, Suerbaum S. Switching of flagellar motility in Helicobacter pylori by reversible length variation of a short homopolymeric sequence repeat in fliP, a gene encoding a basal body protein. Infect Immun. 2000;68:4598–4603. doi:10.1128/IAI.68.8.4598-4603.2000.
- Peck B, Ortkamp M, Diehl KD, Hundt E, Knapp B. Conservation, localization and expression of HopZ, a protein involved in adhesion of Helicobacter pylori. Nucleic Acids Res. 1999;27(16):3325–3333. doi:10.1093/nar/27.16.3325.
- Tannaes T, Dekker N, Bukholm G, Bijlsma JJ, Appelmelk BJ. Phase variation in the Helicobacter pylori phospholipase A gene and its role in acid adaptation. Infect Immun. 2001;69:7334–7340. doi:10.1128/IAI.69.12.7334-7340.2001.
- Tomb JF, White O, Kerlavage AR, Clayton RA, Sutton GG, Fleischmann RD, Ketchum KA, Klenk HP, Gill S, Dougherty BA, et al. The complete genome sequence of the gastric pathogen Helicobacter pylori. Nature. 1997;388(6642):539–547. doi:10.1038/41483.
- Yamaoka Y, Kwon DH, Graham DY. A Mr 34,000 proinflammatory outer membrane protein (oipA) of Helicobacter pylori. Proc Natl Acad Sci U S A. 2000;97(13):7533–7538. doi:10.1073/pnas.130079797.
- Barrozo RM, Cooke CL, Hansen LM, Lam AM, Gaddy JA, Johnson EM, Cariaga TA, Suarez G, Peek RM, Cover TL, et al. Functional plasticity in the type IV secretion system of Helicobacter pylori. PLoS Pathog. 2013;9(2):e1003189. doi:10.1371/journal.ppat.1003189.
- Backert S, Tegtmeyer N, Fischer W. Composition, structure and function of the Helicobacter pylori cag pathogenicity Island encoded type IV secretion system. Future Microbiol. 2015;10:955–965. doi:10.2217/fmb.15.32.
- Hu B, Khara P, Song L, Lin AS, Frick-Cheng AE, Harvey ML, Cover TL, Christie PJ. In situ molecular architecture of the Helicobacter pylori Cag type IV secretion system. mBio. 2019; 10(3): e00849–19. doi:10.1128/mBio.00849-19.
- Tegtmeyer N, Wessler S, and Backert S. Role of the cagpathogenicity island encoded type IV secretion system in Helicobacter pylori pathogenesis. FEBS J. 2011;278(8):1190–1202. doi:10.1111/j.1742-4658.2011.08035.x.
- Aras RA, Fischer W, Perez-Perez GI, Crosatti M, Ando T, Haas R, Blaser MJ. Plasticity of repetitive DNA sequences within a bacterial (Type IV) secretion system component. J Exp Med. 2003;198(9):1349–1360. doi:10.1084/jem.20030381.
- Delahay RM, Balkwill GD, Bunting KA, Edwards W, Atherton JC, Searle MS. The highly repetitive region of the Helicobacter pylori CagY protein comprises tandem arrays of an α-helical repeat module. J Mol Biol. 2008;377(3):956–971. doi:10.1016/j.jmb.2008.01.053.
- Barrozo RM, Hansen LM, Lam AM, Skoog EC, Martin ME, Cai LP, Lin Y, Latoscha A, Suerbaum S, Canfield DR, et al. CagY is an immune-sensitive regulator of the Helicobacter pylori type IV secretion system. Gastroenterology. 2016;151(6):1164–75 e3. doi:10.1053/j.gastro.2016.08.014.
- Suarez G, Romero-Gallo J, Sierra JC, Piazuelo MB, Krishna US, Gomez MA, Wilson KT, Peek RM. Genetic manipulation of Helicobacter pylori virulence function by host carcinogenic phenotypes. Cancer Res. 2017;77:2401–2412. doi:10.1158/0008-5472.CAN-16-2922.
- Draper JL, Hansen LM, Bernick DL, Abedrabbo S, Underwood JG, Kong N, Huang BC, Weis AM, Weimer BC, van Vliet AHM, et al. Fallacy of the unique genome: sequence diversity within single Helicobacter pylori strains. mBio. 2017;8(1): e02321–16. doi:10.1128/mBio.02321-16.
- Jang S, Su H, Blum FC, Bae S, Choi YH, Kim A, Hong YA, Kim J, Kim JH, Gunawardhana N, et al. Dynamic expansion and contraction of cagA copy number in Helicobacter pylori impact development of gastric disease. mBio. 2017;8(1): e01779–16. doi:10.1128/mBio.01779-16.
- Su H, Tissera K, Jang S, Choi YH, Kim A, Cho YJ, Li M, Gunawardhana N, Merrell DS, Ge L, et al. Evolutionary mechanism leading to the multi-cagA genotype in Helicobacter pylori. Sci Rep. 2019;9(1):11203. doi:10.1038/s41598-019-47240-2.
- Fischer W, Puls J, Buhrdorf R, Gebert B, Odenbreit S, Haas R. Systematic mutagenesis of the Helicobacter pylori cag pathogenicity Island: essential genes for CagA translocation in host cells and induction of interleukin-8. Mol Microbiol. 2001;42(5):1337–1348. doi:10.1046/j.1365-2958.2001.02714.x.
- Hansen LM, Dekalb DJ, Cai LP, and Solnick JV. Identification of pathogenicity island genes associated with loss of type IV secretion function during murine infection with Helicobacter pylori. Infect Immun. 2020;88(6):e00801–19. doi:10.1128/IAI.00801-19.
- Horridge DN, Begley AA, Kim J, Aravindan N, Fan K, Forsyth MH. Outer inflammatory protein a (OipA) of Helicobacter pylori is regulated by host cell contact and mediates CagA translocation and interleukin-8 response only in the presence of a functional cag pathogenicity Island type IV secretion system. Pathog Dis. 2017;75. doi:10.1093/femspd/ftx113.
- Ishijima N, Suzuki M, Ashida H, Ichikawa Y, Kanegae Y, Saito I, Boren T, Haas R, Sasakawa C, and Mimuro H. BabA-mediated adherence is a potentiator of the Helicobacter pylori type IV secretion system activity. J Biol Chem. 2011;286(28):25256–25264. doi:10.1074/jbc.M111.233601.
- Javaheri A, Kruse T, Moonens K, Mejias-Luque R, Debraekeleer A, Asche CI, Tegtmeyer N, Kalali B, Bach NC, Sieber SA. Helicobacter pylori adhesin HopQ engages in a virulence-enhancing interaction with human CEACAMs. Nat Microbiol. 2016;2(1):16189. doi:10.1038/nmicrobiol.2016.189.
- Koelblen T, Berge C, Cherrier MV, Brillet K, Jimenez-Soto L, Ballut L, Takagi J, Montserret R, Rousselle P, Fischer W. Molecular dissection of protein-protein interactions between integrin α5β1 and the Helicobacter pylori Cag type IV secretion system. FEBS J. 2017;284:4143–4157. doi:10.1111/febs.14299.
- Yao Y, Shen Y, Zhu L, Ni Y, Wang H, and Shao S. Microb Pathog116, ;Preliminary study and bioinformatics analysis on the potential role of CagQ in type IV secretion system of H.pylori. 2018;1–7. doi: 10.1016/j.micpath.2017.12.076.
- Bodger K, Bromelow K, Wyatt JI, Heatley RV. Interleukin 10 in Helicobacter pylori associated gastritis: immunohistochemical localisation and in vitro effects on cytokine secretion. J Clin Pathol. 2001;54(4):285–292. doi:10.1136/jcp.54.4.285.
- Kaebisch R, Mejias-Luque R, Prinz C, Gerhard M. Helicobacter pylori cytotoxin-associated gene A impairs human dendritic cell maturation and function through IL-10-mediated activation of STAT3. J Immunol. 2014;192:316–323. doi:10.4049/jimmunol.1302476.
- Rizzuti D, Ang M, Sokollik C, Wu T, Abdullah M, Greenfield L, Fattouh R, Reardon C, Tang M, and Diao J, et al. Helicobacter pylori inhibits dendritic cell maturation via interleukin-10-mediated activation of the signal transducer and activator of transcription 3 pathway. J Innate Immun. 2015;7(2):199–211. doi:10.1159/000368232.
- Berg DJ, Lynch NA, Lynch RG, Lauricella DM. Rapid development of severe hyperplastic gastritis with gastric epithelial dedifferentiation in Helicobacter felis-infected IL-10−/− mice. Am J Pathol. 1998;152:1377–1386.
- Wallden K, Rivera-Calzada A, Waksman G. Type IV secretion systems: versatility and diversity in function. Cell Microbiol. 2010;12(9):1203–1212. doi:10.1111/j.1462-5822.2010.01499.x.
- Shaffer CL, Gaddy JA, Loh JT, Johnson EM, Hill S, Hennig EE, McClain MS, McDonald WH, and Cover TL. Helicobacter pylori exploits a unique repertoire of type IV secretion system components for pilus assembly at the bacteria-host cell interface. PLoS Pathog. 2011;7(9):e1002237. doi:10.1371/journal.ppat.1002237.
- Arnold IC, Lee JY, Amieva MR, Roers A, Flavell RA, Sparwasser T, Müller A. Tolerance rather than immunity protects from helicobacter pylori–induced gastric preneoplasia. Gastroenterology. 2011;140(1):199–209. doi:10.1053/j.gastro.2010.06.047.
- Livak KJ, Schmittgen TD. Analysis of relative gene expression data using real-time quantitative PCR and the 2−∆∆CT Method. Methods. 2001;25(4):402–408. doi:10.1006/meth.2001.1262.
- Schmittgen TD, Livak KJ. Analyzing real-time PCR data by the comparative CT method. Nat Protoc. 2008;3(6):1101–1108. doi:10.1038/nprot.2008.73.
- Hellemans J, Mortier G, De Paepe A, Speleman F, Vandesompele J. qBase relative quantification framework and software for management and automated analysis of real-time quantitative PCR data. Genome Biol. 2007;8(2):R19. doi:10.1186/gb-2007-8-2-r19.
- Israel DA, Salama N, Arnold CN, Moss SF, Ando T, Wirth HP, Tham KT, Camorlinga M, Blaser MJ, Falkow S. Helicobacter pylori strain-specific differences in genetic content, identified by microarray, influence host inflammatory responses. J Clin Invest. 2001;107(5):611–620. doi:10.1172/JCI11450.