
ABSTRACT
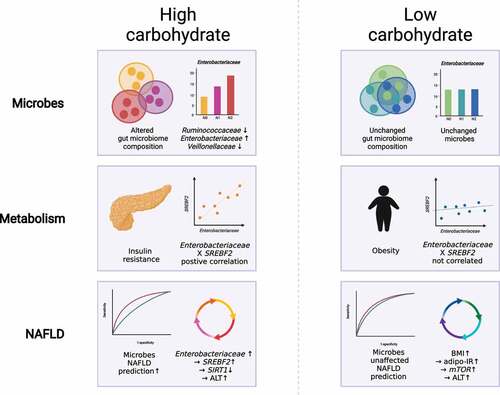
Nonalcoholic fatty liver disease (NAFLD) is associated with high carbohydrate (HC) intake. We investigated whether the relationship between carbohydrate intake and NAFLD is mediated by interactions between gut microbial modulation, impaired insulin response, and hepatic de novo lipogenesis (DNL). Stool samples were collected from 204 Korean subjects with biopsy-proven NAFLD (n = 129) and without NAFLD (n = 75). The gut microbiome profiles were analyzed using 16S rRNA amplicon sequencing. Study subjects were grouped by the NAFLD activity score (NAS) and percentage energy intake from dietary carbohydrate. Hepatic DNL-related transcripts were also analyzed (n = 90). Data from the Korean healthy twin cohort (n = 682), a large sample of individuals without NAFLD, were used for comparison and validation. A HC diet rather than a low carbohydrate diet was associated with the altered gut microbiome diversity according to the NAS. Unlike individuals from the twin cohort without NAFLD, the abundances of Enterobacteriaceae and Ruminococcaceae were significantly different among the NAS subgroups in NAFLD subjects who consumed an HC diet. The addition of these two microbial families, along with Veillonellaceae, significantly improved the diagnostic performance of the predictive model, which was based on the body mass index, age, and sex to predict nonalcoholic steatohepatitis in the HC group. In the HC group, two crucial regulators of DNL (SIRT1 and SREBF2) were differentially expressed among the NAS subgroups. In particular, kernel causality analysis revealed a causal effect of the abundance of Enterobacteriaceae on SREBF2 upregulation and of the surrogate markers of insulin resistance on NAFLD activity in the HC group. Consuming an HC diet is associated with alteration in the gut microbiome, impaired glucose homeostasis, and upregulation of hepatic DNL genes, altogether contributing to NAFLD pathogenesis.
Graphical abstract
Introduction
Nonalcoholic fatty liver disease (NAFLD) is associated with metabolic syndrome, obesity, and diabetes mellitus (DM)Citation1. In addition, NAFLD has genetic and dietary risk factors.Citation2 Patients with nonalcoholic steatohepatitis (NASH) and advanced fibrosis present more adverse clinical outcomes,Citation3 and should be potentially targeted for pharmacotherapy. However, in NAFLD patients, lifestyle modification is primarily pursued as a cost-effective intervention to control metabolic dysfunction.Citation4 As a result, further investigation of the underlying mechanisms by which dietary patterns affect NAFLD progression are merited to elucidate its complex pathogenesis.
Sources of lipid influx contributing to NAFLD development include lipid biosynthesis, mostly from carbohydrate (through de novo lipogenesis [DNL]Citation5), free fatty acids (FFAs) derived from lipolysis of adipose tissue,Citation6 and excessive dietary fat in the form of chylomicrons absorbed from the intestine.Citation7 Among them, DNL contributes up to 26% of the total triglycerides (TG) synthesis in NAFLD patients with hyperinsulinemia, while serum-derived non-esterified fatty acids account for approximately 59% and the diet account for 15%;Citation8 the rate of DNL is three times higher in NAFLD patients than in body mass index (BMI)-matched healthy controls.Citation5 Circulating glucose and insulin levels can also induce hepatic DNL in NAFLD patients.Citation9 Thus, elucidating the contribution of carbohydrates, the primary source of DNL, to NAFLD progression is crucial for optimizing effective dietary interventions that ameliorate NAFLD.
A growing body of evidence suggests that altered gut microbial ecology is associated with the development and progression of NAFLD.Citation10–12 Specifically, the diversity and composition of the gut microbiome are significantly different in non-obese NAFLD subjects, resulting in the depletion of Ruminococcaceae and the enrichment of Veillonellaceae.Citation11 Changes in the gut microbiome are closely linked with host-microbe-nutrient interactions, such as dietary patterns; in turn, dietary patterns are associated with NAFLD progression.Citation13,Citation14 Indeed, a 2-week dietary intervention involving an extremely carbohydrate-restricted diet (4% of total energy intake from carbohydrate) improved fat metabolism in the liver by modulating the folate-producing gut microbiome.Citation15 A 4-week dietary intervention that increased fiber intake also led to the modulation of gut microbiome-mediated glucose homeostasis in an overweight population.Citation16 Despite the evident interaction among macronutrients, the gut microbiome, and NAFLD, further mechanistic studies that investigate these relationships in humans are needed.
In this study, we attempted to elucidate the effect of dietary patterns on NAFLD pathogenesis using a multi omics approach in a well-characterized biopsy-proven NAFLD cohort. We aimed to provide new insights into the pathomechanism of NAFLD as related to dietary carbohydrate patterns, alterations of the gut microbiome, and hepatic DNL.
Results
Study population characteristics
This study included 129 Korean individuals with biopsy-proven NAFLD (NAFL, n = 70; NASH, n = 59) and 75 controls without NAFLD (Supplementary Table 1). Subjects were divided into two groups according to their carbohydrate intake (high carbohydrate [HC] group, energy intake from carbohydrates ≥70%; low carbohydrate [LC] group, energy intake from carbohydrates <70%).Citation17,Citation18 Baseline characteristics did not significantly differ between the HC and LC groups (). Subjects were then subdivided into three subgroups (N0–2) according to their NAFLD activity score (NAS). The subgroups were categorized as non-NASH (N0), borderline NASH (N1), and definite NASH (N2) ( and Supplementary Table 2).
Table 1. Clinical characteristics of all study subjects stratified by carbohydrate intake and the NAFLD activity score.
Associations between nutrient intake and NAFLD-associated clinical markers according to carbohydrate intake
On average, the HC group consumed 76.83% of daily total energy from carbohydrate, 11.28% from fat, and 11.89% from protein, while the LC group consumed 63.56% of daily total energy from carbohydrate, 20.16% from fat, and 16.28% from protein (). In terms of the absolute amount of each nutrient consumed, the LC group consumed higher amounts of fat, animal fat, plant fat, protein, animal protein, and plant protein than the HC group (, Supplementary Table 3).
Figure 1. Stratification of the study population into high carbohydrate (HC) and low carbohydrate (LC) intake groups by carbohydrate intake and associations between nutrient intake and clinical markers in these groups. (a) Percentage of energy intake from carbohydrates, fats, and proteins in the HC and LC groups. (b) Absolute amounts of nutrient intake (in kcals) in each group, stratified by carbohydrate intake (%) and the NAFLD activity score (NAS). (c) The proportion of participants classified as obese population in each group (non-obese, BMI <25; obese, BMI ≥25 kg/m2), stratified by carbohydrate intake (%) and NAS. (d) Linear regression models (with 95% confidence interval bands highlighted in gray) between the levels of alanine transaminase (ALT) and carbohydrate intake (in kcals) with and without adjustment for BMI, age, and sex (HC, upper panel, red line; LC, lower panel, blue line). (e) Heatmap displaying the significant correlations between clinical markers and the intake of nutrients (*P < .05, **P < .01, ***P < .001). Positive correlations are expressed in red and negative correlations are in blue (HC, upper panel; LC, lower panel). (f) Linear regression models (with 95% confidence interval bands highlighted in gray) between clinical markers and the intake of carbohydrates (in kcals) after adjusting for BMI, age, and sex (HC, upper panel, red line; LC, lower panel, blue line).
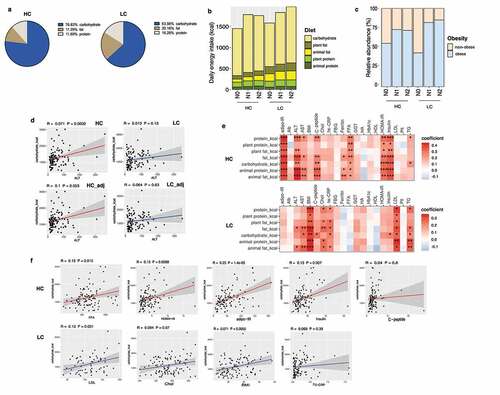
BMI did not significantly differ between the HC and LC groups (); The percentage of obese NASH individuals was higher in the LC group (N0 [43%], N1 [81%], and N2 [85%]) than the HC group (N0 [55%], N1 [72%], and N2 [71%]) (). In the LC group, body fat mass and visceral, subcutaneous, and total abdominal adipose tissue areas significantly increased with worsening the histological severity of NAFLD (Supplementary Figure 1).
Carbohydrate consumption was positively correlated with serum alanine transaminase (ALT), a liver damage marker only in the HC group. After adjusting for potential confounding factors, the positive correlation between carbohydrate intake and ALT in the HC group remained marginally significant (P = .053) (). Significant positive correlations between the surrogate markers of insulin resistance (homeostasis model assessment of insulin resistance [HOMA-IR] and adipose tissue insulin resistance [adipo-IR]) with carbohydrate consumption were found only in the HC group. In contrast, obesity and lipid metabolism-associated clinical markers (low density lipoprotein [LDL]-cholesterol and TG) were significantly correlated with carbohydrate consumption in the LC group (). These results were confirmed by a linear regression model adjusted for BMI, age, and sex. Carbohydrate intake significantly predicted FFA concentrations, HOMA-IR, adipo-IR, and insulin levels in the HC group, whereas carbohydrate intake significantly predicted LDL-cholesterol levels and BMI in the LC group ().
NAFLD activity-associated alterations in gut microbial diversity and composition in the HC group
In the HC group, the composition of gut microbiota varied significantly according to the NAS (P = .009), but this pattern was not exhibited in the LC group (P = .742) (). Subsequent analysis of nonmetric multidimensional scaling (NMDS) scores showed a significant difference between the N1 and N2 groups (P = .0195) ().
Figure 2. Alterations in the diversity and composition of the gut microbiome according to NAFLD severity in the high carbohydrate (HC) and low carbohydrate (LC) intake groups. (a) Non-metric multidimensional scaling (NMDS) plot based on the Bray-Curtis distance showing the beta diversity of the gut microbiome composition at the genus level (HC: N0, yellow; N1, Orange; N2, red and LC: N0, light sky blue; N1, dark blue; N2, navy). (b) NMDS plot from (A) visualized as Tukey’s box and whisker plot, showing the median and upper and lower quantiles. The nonparametric Kruskal-Wallis test and Dunn’s multiple comparisons test were used for statistical analysis. (c) Alpha diversity in each group (upper left, Simpson’s diversity index; upper right, Pielou’s evenness index; lower left, Shannon diversity index; lower right, species richness). (d) Relative abundances of the top 10 family taxa in the total, HC, and LC groups stratified by the NAFLD activity score.
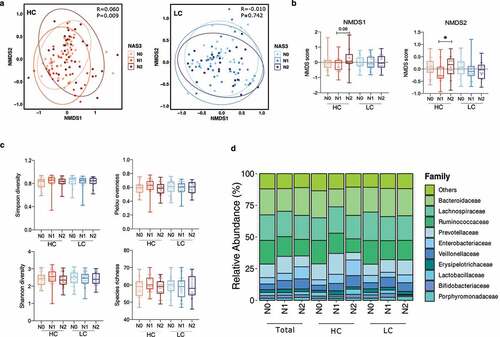
However, alpha diversity, measured using four indices (Simpson’s diversity index, Pielou’s evenness index, the Shannon diversity index, and species richness), did not significantly differ among the NAS subgroups in either the HC or LC group (). The top 10 microbial taxa enriched or depleted by NAFLD severity in all participants, the HC group, and the LC group were visualized using stacked bar plots ().
NAFLD activity-associated alterations in the relative abundances of gut microbial taxa in the HC group
Univariate analysis revealed a significant decrease in the abundance of Ruminococcaceae family (P = .006) and a significant increase in the abundance of Enterobacteriaceae family (P = .010) with increasing NAFLD activity (N2 vs. N0) in the HC group, and a marginally significant increase in the abundance of Veillonellaceae in individuals with definite NASH (N2) compared to non-NASH individuals (N0) (P = .06). No significant alterations in the abundance of microbial taxa were found in the LC group (). These trends were maintained at the genus level in the HC group (): compared with subjects without NASH, NASH subjects had a significant decrease in the abundance of Faecalibacterium (N2 vs. N0), and a significant increase in the abundance of unclassified Enterobacteriaceae (N2 vs. N0) and Dialister (N1 vs. N0).
Figure 3. Changes in the relative abundance of the gut microbial taxa according to NAFLD severity in the high carbohydrate (HC) and low carbohydrate (LC) intake groups. (a) The abundance of three representative family taxa and (b) three representative genus taxa are depicted. Nonparametric Kruskal-Wallis tests and Dunn’s multiple comparisons tests were used in the statistical analysis. (c) Ranking of the family taxa according to the mean decrease in the Gini coefficient in the random forest model to predict the NAFLD activity score. (red circle, top 3 families defined by the random forest model; blue pentagon, three representative family taxa) (d–f) Regression analysis was used to determine the abundance of the Ruminococcaceae, Enterobacteriaceae, and Veillonellaceae families after adjusting for confounding factors including BMI, age, and sex. Multivariate association analysis was performed using MaAsLin2 with adjustment for multiple comparisons. (d) Total: P = .0001, q = 0.034; P = .001, q = 0.140; P = .011, q = 0.419. (e) HC: P = .002, q = 0.035; P = .005, q = 0.202; P = .014, q = 0.341. (f) LC: P = .102, q = 0.71; P = .264, q = 0.84; P = .149, q = 0.026. (*P < .05, **P < .01, ***P < .001, †FDR<0.25).
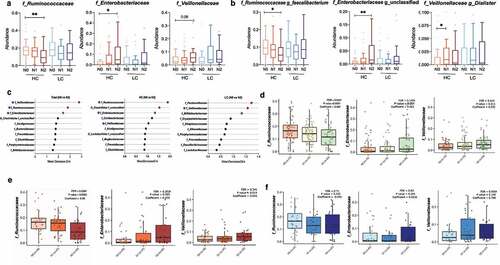
The predictive validity of microbial taxa for NAFLD was tested using a random forest model (). The most critical microbial variables in the total population were the Veillonellaceae, Ruminococcaceae, and Enterobacteriaceae families. The Ruminococcaceae and Enterobacteriaceae families were also crucial microbial variables in the HC group. Microbial variables selected for the prediction of NAFLD in the LC group were not significantly altered by NAFLD activity. Multivariate analysis was performed using MaAsLin2Citation19 after adjustment for BMI, age, and sex. Similar to the unadjusted data, in the HC group, the abundance of Ruminococcaceae was significantly depleted with increasing NAFLD activity, while the abundance of Enterobacteriaceae was significantly enriched (). Similar significant associations were not found in the LC group.
To analyze the functional changes in the gut microbiome in the HC and LC groups according to NAFLD severity, the functional prediction analysis was conducted. As a result of linear discriminant analysis effect size (LEfSe), a total of 287 Kyoto Encyclopedia of Genes and Genomes (KEGG) categories and 16 KEGG pathways were identified as significantly differing between the non-NASH (N0) and NASH (N1 and N2) subgroups within the HC group. On the other hand, no differences in the functional changes in KEGG categories between the non-NASH and NASH subgroups were observed, and 6 KEGG pathways were identified as significant in the LC group. The KEGG pathways found to be significant in the HC group are visualized in supplementary figure 2. Notably, the majority of KEGG pathways that were enriched in the NASH subgroup within the HC group were related to microbial carbohydrate metabolism, such as ‘phosphotransferase system PTS’, ‘glycerolipid metabolism’ and ‘fructose and mannose metabolism’.
Effect of carbohydrate intake on microbial diversity and composition in the non-NAFLD population
To investigate the effect of an HC diet on the gut microbiome in the non-NAFLD population, gut microbiome data from the Korean healthy twin cohort were analyzed (n = 682) (). Study subjects were divided into the HC and LC groups using a cutoff of 70% energy intake from carbohydrates (HC group, n = 382; LC group, n = 300) (Supplementary Figure 3A). Furthermore, both groups were subdivided into two subgroups according to the hepatic steatosis index (HSI) (HC group: HSI ≥30, n = 246; HSI <30, n = 135 and LC group: HSI ≥30, n = 211; HSI <30, n = 88). The population characteristics of the HC and LC groups in the healthy twin cohort are described in supplementary information (Supplementary Table 5, Supplementary Figure 3).
Figure 4. Alterations in the diversity and composition of the gut microbiome according to nonalcoholic fatty liver disease (NAFLD) risk in high carbohydrate (HC) and low carbohydrate (LC) intake groups from the Health Twin cohort. A hepatic steatosis index (HSI) of 30 IU/L was used as the cutoff for determining NAFLD risk in the HC and LC groups (HC, n = 382; LC, n = 300). (a) NMDS plot showing the beta diversity of the gut microbiome composition in subjects with and without liver injury. NMDS scores were calculated using Bray-Curtis distance (HC group: HSI <30, pink; HSI ≥30, purple; LC group: HSI <30, yellow-green; HSI ≥30, dark green). (b) Alpha diversity was calculated using four indices (upper left, Simpson’s diversity index; upper right, the Shannon diversity; lower left, Pielou’s evenness index; lower right, species richness). (c) Relative abundances of the top 10 families are visualized in stacked bar plots for all patients as well as the HC and LC groups, stratified by liver injury severity. (d) Univariate analysis of three key microbial families using nonparametric Mann-Whitney tests and Dunn’s multiple comparisons tests (*P < .05, **P < .01, ***P < .001).
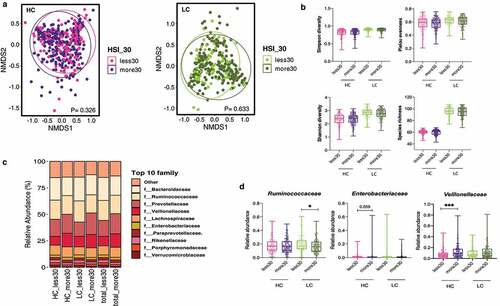
The composition and alpha diversity of the gut microbiome did not significantly differ by the HSI in the healthy twin cohort, regardless of carbohydrate intake ( A and b). Among the three crucial microbial families (Ruminococcaceae, Enterobacteriaceae, and Veillonellaceae), the enrichment of the abundance of Veillonellaceae in individuals with high HSI was evident in all participants as well as in the HC and LC groups (). This observation was also confirmed in the HC group by univariate analysis ().
Differential regulation of DNL-related liver transcripts in the HC and LC groups
NAFLD-associated single nucleotide polymorphisms (SNPs) were analyzed to understand the genetic background of subjects (Supplementary Table 6). Of the five major SNPs (PNPLA3_rs738409 C > G, TM6SF2_rs58542926 C > T, SREBF2_rs133291 C > T, MBOAT7_rs641738 C > T, and HSD17B13_rs72613567 adenine insertion [A-INS]), only the prevalence of PNPLA3_rs738409 C > G significantly differed among the NAS subgroups in both the HC and LC groups. There were no significant differences in the minor allele frequency of PNPLA3_rs738409 between the HC and LC groups (P = .612), suggesting that the differences between the HC and LC groups were not attributable to genetic factors.
Next, we analyzed liver transcripts related to hepatic DNL in the biopsy-proven NAFLD cohort (n = 90) (). We investigated whether an HC diet was associated with upregulation of DNL due to increased glucose availability in the liver. A total of 37 DEseq2-normalized transcripts were selected and compared between the HC and LC groups according to NAFLD activity (Supplementary Table 7). We performed Spearman’s rank correlation analysis to analyze the relationship between the selected transcripts and the NAS in the HC and LC groups. In the HC group, G6PC and SIRT1 were negatively correlated with the NAS (P = .049 and P = .001), while HCFC1 and SREBF2 were positively correlated with the NAS (P = .016 and P = .041). In the LC group, USF1, NR1H3, and MLXIPL were inversely correlated with the NAS (P = .021, P = .008, and P = .037), whereas SCD and mTOR were positively correlated with the NAS (P = .009 and P = .017) ().
Figure 5. Changes in de novo lipogenesis (DNL)-related transcripts in the high carbohydrate (HC) intake group. (a) Heatmap displaying the correlation between DNL-related genes and the NAFLD activity score (NAS) in the HC and LC groups. Statistical analysis was performed using transformed z scores and Spearman’s rank correlation analysis. (b) Z score-transformed expression levels of predefined transcripts were compared between the HC and LC groups according to NAFLD severity using an one-way analyses of variance and the FDR correction for multiple comparisons. (c) Differentially expressed genes were defined using the R package DEseq2. The upper panel indicates log10 transformed P values and the lower panel indicates log2 transformed fold changes. (d) The linear regression model depicts the relationship between SREBF2 and Enterobacteriaceae after adjustment for BMI, age, and sex (*P < .05, **P < .01, ***P < .001).
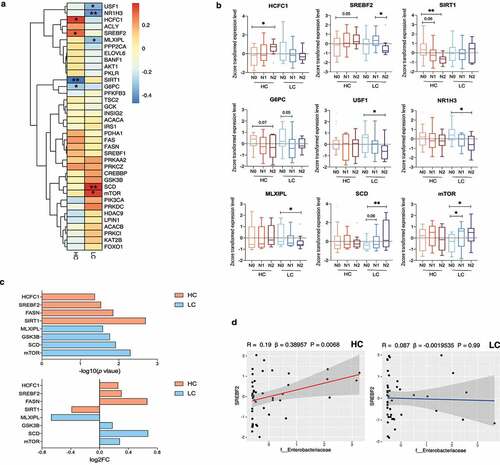
Significant correlations were confirmed by comparing z score-transformed expression levels of the corresponding genes (). In the HC group, HCFC1 expression was higher and SIRT1 expression was lower in N2 subjects than in N0 subjects (P = .018 and P = .001, respectively). Although differences in the expression of SREBF2 and G6PC did not reach statistical significance, higher SREBF2 expression and lower G6PC expression were observed with increasing NAFLD activity (N2 vs. N0; P = .057 and P = .072, respectively). The expression of USF1, NR1H3, and MLXIPL was lower (P = .022, P = .009, and P = .045, respectively) and the expression of SCD and mTOR was higher with increasing NAFLD activity in the LC group (SCD, P = .009 [N2 vs. N0]; mTOR, P = .035 [N0 vs. N1]; and P = .022 [N0 vs. N2]). Among the corresponding transcripts in the HC group, SREBF2, SIRT1 and HCFC1 significantly differed between the HC and LC groups in the definite NASH subgroup (N2) (Supplementary Figure 4).
We identified differentially expressed genes between the N0 vs. N1+ N2 subgroups (). Specifically, SIRT1, FASN, SREBF2, and HCFC1 were differentially expressed in the HC group (P = .002, P = .014, P = .029, and P = .042, respectively) and the expression of mTOR, SCD, GSK3B, and MLXIPL were differentially expressed in the LC group (P = .005, P = .012, P = .017, and P = .026, respectively). Among the analyzed transcripts, we focused on the association between SREBF2 and the abundance of Enterobacteriaceae (, Supplementary Figure 5). A linear regression model adjusted for BMI, age, and sex revealed that the expression of SREBF2 was predictive of Enterobacteriaceae abundance in the HC group (P = .006). This suggests a close relationship between NAFLD activity, DNL, and the gut microbiome community under HC diet conditions.
Prediction of NASH using three gut microbial families in the HC group
We performed the area under the receiver-operating characteristic curve (AUROC) analysis to evaluate whether specific gut microbial families predict the presence of NASH among subjects with biopsy-proven NAFLD. Three microbial families, Enterobacteriaceae, Ruminococcaceae, and Veillonellaceae, which were present in differing amounts according to NAFLD activity in the HC group, were incorporated into the prediction model (). For NASH diagnosis, the addition of these microbial families to the prediction model including BMI, age, and sex yielded an AUC of 0.861 in the HC group (95% CI, 0.774–0.940), which was significantly higher than that of the prediction model including only BMI, age, and sex (AUC = 0.743; 95% CI, 0.625–0.860; P = .018 by DeLong test) (). However, the addition of those microbial families did not significantly improve the predictive validity of the model for detecting NASH in the LC group (AUC = 0.874 [microbes-BMI-age-sex]; AUC = 0.872 [BMI-age-sex]; 95% CI, 0.735–0.937; P = .883 by DeLong test) ().
Figure 6. Noninvasive multidimensional prediction of nonalcoholic steatohepatitis (NASH) using three microbial families and potential clinical variables in all subjects as well as the high carbohydrate (HC), and low carbohydrate (LC) intake groups (non-NASH vs. NASH). The receiver-operating characteristic (ROC) curve was designed for detecting NASH among study subjects with biopsy-proven NAFLD. Area under receiver-operating characteristic curves (AUROC) analyses including clinical variables (BMI, age, and sex) (blue) vs. those also including the three microbial families (Enterobacteriaceae, Ruminococcaceae, and Veillonellaceae) in addition to clinical variables (BMI, age, and sex) (red) plotted for the diagnosis of NASH in (a)all subjects as well as, (b) the HC, and (c) LC groups. P values were calculated using the DeLong test.

Causal effects of clinical markers, gut microbes, and gene expression on NAFLD pathogenesis
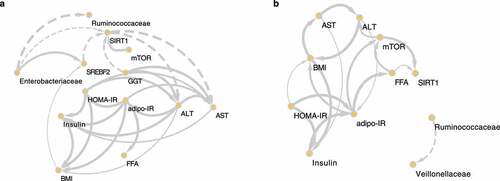
To determine causality among several variables, we used kernel causality analysis, which identifies plausible causal pathways between two variables using generalized correlation coefficientsCitation20(). The descriptive source data are shown in Supplementary Table 8. Differences in the causality of variables between the HC and LC groups were observed. In the HC group, we identified positive causation between insulin resistance-related markers, such as HOMA-IR and adipo-IR, and liver damage markers, such as ALT, aspartate transaminase (AST), and gamma-glutamyl transferase (GGT). Additionally, there was positive causation between the abundance of Enterobacteriaceae and a DNL regulator, SREBF2; both Enterobacteriaceae and SREBF2 were involved in reducing SIRT1, a lipid biosynthesis suppressor gene.
Figure 7. The causal relationships among nonalcoholic steatohepatitis (NASH)-related microbes, transcripts, and clinical factors in the high carbohydrate (HC) and low carbohydrate (LC) intake groups. Causal inference of inverse, normally transformed microbiome families (Ruminococcaceae and Enterobacteriaceae), transcripts (SREBF2, SIRT1, and mTOR), and clinical variables (ALT, AST, adipo-IR, HOMA-IR, insulin, FFA, and BMI) were calculated using kernel causality analysis; significant causal correlations were visualized using Cytoscape. Causality of variables in the (a) HC and (b) LC groups. Solid line indicates a positive correlation and the dashed lines indicates a negative correlation. The thickness of the line indicates the degree of statistical significance (thin: less significant P values; thick: more-significant P values).
Discussion
The current study demonstrated that in individuals with NAFLD who consume an HC diet (but not a LC diet), alterations in the composition of the gut microbiome are associated with NAFLD activity. In particular, the abundances of three key microbial families (Veillonellaceae, Ruminococcaceae, and Enterobacteriaceae) differed among the NAS subgroups within the HC group, such that a set of these microbes served as an accurate tool for diagnosing NASH in the HC group. However, HC consumption did not impact the gut microbiome composition in the absence of NAFLD, according to an independent non-NAFLD cohort. In the transcriptomic analysis of human liver tissues from the subjects with biopsy-proven NAFLD, we found four differentially expressed genes (G6PC, SIRT1, HCFC1, and SREBF2) between non-NAFLD controls and NASH subjects who consumed HC. We then explored the direction of causality of the three microbial families, eight clinical markers, and three transcriptomes using kernel causality analysis.
HC consumption was positively correlated with an insulin resistance phenotype in subjects with biopsy-proven NAFLD. Given the very high proportion of energy intake from carbohydrates in the HC group, it is plausible that chronic high consumption of carbohydrates worsens insulin resistance.Citation21 According to a Japanese population-based study, high consumption of white rice, a primary carbohydrate source in East Asia, was positively associated with the risk of type 2 DM.Citation22In addition, a high HC-intake-to-energy ratio was positively associated with a high prevalence of NAFLD.Citation23 Mechanistically, several studies have reported a close relationship between hepatic steatosis and hepatic insulin resistance.Citation24–26 Although a causal relationship among HC consumption, NAFLD, and DM remains to be elucidated, the results from our kernel causality analysis offer some clues to the relationship among these conditions.
In the current study, differences in three NAFLD-associated microbial taxa were identified in the HC group by multivariate analysis. In a recent study, we reported that the Veillonellaceae and Ruminococcaceae families contribute to significant fibrosis in nonobese subjects with NAFLD,Citation11 while the Enterobacteriaceae family was not significantly altered by fibrosis severity after adjustment for DM.Citation11 This relationship identified among the Enterobacteriaceae family, DM, and an HC diet was supported by the current study findings that the surrogate markers of diabetes were associated with HC consumption in NAFLD subjects. Indeed, several studies have found that the abundance of Enterobacteriaceae is enriched in adipose tissue and plasma samples from individuals with DMCitation27 and in feces from NAFLD subjects.Citation28,Citation29 Our results led to the conclusion that Enterobacteriaceae forms a close multifactorial association with DM and NAFLD. In addition, the functional analysis indicated that the microbial carbohydrate uptake system (specifically, the phosphotransferase system) was enriched in the NAFLD subgroup within the HC group. This result was consistent with a recent study that two strains belonging to the family Enterobacteriaceae strongly compete for carbohydrate, even leading to colonization resistance.Citation30 Thus, the enrichment of the abundance of Enterobacteriaceae with worsening NAFLD severity observed in the HC group might be attributed to ample opportunities for carbohydrate utilization.
An association between the Ruminococcaceae family and NASH has been identified in several human studies.Citation29,Citation31 Children with NASH showed a significant reduction in the abundance of Ruminococcaceae compared with healthy children;Citation29 additionally, a UK study also found that the abundance of Ruminococcaceae decreased in patients with biopsy-proven NASH.Citation31 In the current study, the genus faecalibacterium in the family Ruminococcaceae may largely account for the decreased abundance of Ruminococcaceae in patients with advanced NAFLD in the HC group. Indeed, hepatic DNL is significantly decreased by the short-chain fatty acids produced by faecalibacteriumCitation32 and the abundance of Faecalibacterium prausnitzii has been linked to liver fat accumulation as measured by magnetic resonance spectroscopy.Citation33 These results highlight the dynamic crosstalk between Ruminococcaceae, DNL, and NAFLD severity.
Alterations in the gut microbiome according to NAFLD severity in the HC group were confirmed by comparing the gut microbiome composition of the NAFLD cohort with that of the non-NAFLD cohort. The gut microbiome composition of the non-NAFLD cohort, unlike that of the NAFLD cohort, stratified by the HSI in the HC group was not significantly altered by the HSI. This indicates that the contributing factor to the alteration of the gut microbiome composition is the interaction between NAFLD severity and an HC diet rather than their individual effects. On the other hand, univariate and multivariate analyses of the gut microbiome in the NAFLD cohort showed that the abundance of Veillonellaceae was not significantly enriched with worsening NAFLD severity in the HC group. However, the abundance of Veillonellaceae significantly increased with high HSI (>30) in the HC group of the non-NAFLD twin cohort. Thus, we speculate that the enrichment of the abundance of Veillonellaceae in the HC group is related with hepatic steatosis but not with severe NASH. Although several previous studies reported the association between Veillonellaceae and NAFLD,Citation11,Citation34 further studies on the colonization of Veillonellaceae during the certain stages of NAFLD under HC consumption are warranted.
To investigate whether HC consumption alters hepatic DNL-related gene expression, we performed liver transcriptomic analysis in 90 subjects with biopsy-proven NAFLD. Among the 37 genes that encode proteins involved in DNL, we identified three central DNL regulators (SREBF2, SIRT1, and mTOR) that are significantly associated with NASH pathogenesis as well as carbohydrate metabolism. Compared with non-NASH patients (the N0 subgroup), definite NASH patients (N2) in the HC group showed higher expression of SREBF2 and lower expression of SIRT1; overall, NASH patients (N1 and N2 subgroups) in the LC group showed higher expression of mTOR.
The expression of SREBF2, the gene encoding sterol regulatory element-binding protein 2 (SREBP2), was upregulated upon increasing NAFLD severity in the HC group. SREBPs can activate the transcription of genes involved in the synthesis of cholesterol, fatty acids, and phospholipids.Citation35,Citation36 The association between SREBF2 and NASH is well established: SREBF2 mRNA levels are three times higher in NASH patients than in healthy controls, and acyl-CoA cholesterol acyltransferase was 1.5-fold increased.Citation37 Thus, chronic carbohydrate consumption may stimulate SREBP expression and the subsequent upregulation of hepatic DNL, leading to excessive lipid accumulation and the onset of NAFLD. We also demonstrated that the diet-induced increase in hepatic SREBF2 expression was positively associated with the abundance of Enterobacteriaceae. Although a direct interaction between SREBP2 and Enterobacteriaceae has not yet been established, our results provide novel insights into the gut microbe mediation of DNL, which occurs via regulation of hepatic gene expression in relation to an HC diet.
The expression of SIRT1, a potential inhibitor of hepatic DNL, decreased with increasing NASH severity in the HC group. The function of SIRT1 in preventing liver fat accumulation is well established in both mice and humans.Citation38,Citation39 A loss-of-function model using SIRT1-knockout mice displayed hepatic insulin resistance as well as increased hepatic lipogenesis;Citation38 hepatocytes differentiated from human induced pluripotent stem cells with deletion of SIRT1 exhibited a NASH phenotype, including steatosis and inflammation.Citation39 Due to its responsiveness to hepatic insulin, SIRT1 is regarded as a potential therapeutic target for treating type 2 DM.Citation40 Thus, reduced expression of SIRT1 may be derived from impaired hepatic lipid and glucose homeostasis.
In the current study, mTOR, an insulin-signaling regulatorCitation41and a key player in adipogenesis,Citation42 was expressed at higher levels in patients with advanced NAFLD in the LC group. The LC group consumed a relatively high-fat diet and contained a higher proportion of obese people than the HC group. An in vivo study using adipose tissue-specific mTORC1-knockout mice revealed that loss of mTORC1 induces resistance to high-fat diet-induced obesity.Citation43 Moreover, mTORC1 is highly activated in the liver of diet-induced obese animals with impaired insulin signaling.Citation44,Citation45 Activation of mTOR is associated with the development of metabolic syndrome and NASH in humans and animals.Citation46Thus, there seems to be an intricate relationship among mTOR, obesity, and NASH, suggesting that the increased mTOR expression observed in individuals with NASH in the LC group might be attributed to the high prevalence of obesity in this group.
Finally, we integrated clinical, microbial, and transcriptomic data to identify causality among variables involved in the etiology of NAFLD associated with HC and LC diets. As expected, the surrogate markers of insulin resistance displayed positive causal effects on NASH biomarkers. Moreover, GGT was the causal agent that reduced SIRT1 expression in the HC group. GGT is inversely associated with insulin sensitivity,Citation47 and insulin resistance induces hepatic DNL in NAFLD.Citation9 In addition, Enterobacteriaceae play a central role in regulating DNL-associated genes by stimulating SREBF2 and inhibiting SIRT1 expression. A previous study using germ-free and specific pathogen-free mice demonstrated that intestinal microbes promote hepatic fatty acid metabolism via the transcription of DNL-associated genes, including SCD1 and ELOVL5, which are modulated by SREBP1C.Citation48 Moreover, knockdown removal of SIRT1 in mice alters the gut microbiota, leading to intestinal inflammation,Citation49 which may partly explain the crosstalk between the hepatic transcriptome and the intestinal microbiota. Thus, impaired insulin sensitivity due to extreme HC consumption and lipid accumulation-associated liver damage may result from the inactivation of DNL suppressors through microbial reshaping.
The current study utilized the nested case-control data from a well-characterized biopsy-proven NAFLD cohort, providing the unique insight that the progression of NAFLD in the HC group is a modulating factor for the alteration of the gut microbiome and that these changes in the gut microbiome contribute to host hepatic metabolism in an Asian population. Nevertheless, this study has several limitations. First, the cross-sectional design of our study may preclude us from drawing a number of causal mechanistic insights between nutrition and NAFLD. However, we adopted the robust statistical methods to address this issue. We compared the gut microbiome data obtained from 16S rRNA amplicon sequencing between subjects with HC and LC diets and also scrutinized hepatic transcriptomic data to identify underlying mechanisms. Moreover, we attempted to verify the causality of defined factors using kernel causality analysis. Although kernel causality analysis is a useful method to gain an insight into nonexperimental causality and has been used for a long time in various fields including the field of microbiology,Citation50further interventional studies, including animal experiments and human clinical trials, are warranted to validate our findings on the macronutrient-centered gut-liver axis. Second, the pathogenesis of NAFLD in the LC group remains unclear. Due to the typical dietary pattern of an Asian NAFLD population,Citation51,Citation52 even the LC group in the current study consumed a relatively high level of carbohydrates (63.7%) compared with Western NAFLD populations (~44–46%).Citation53,Citation54 Thus, it was difficult to clearly distinguish between the effects of HC and LC diets in the current study; nevertheless, we identified obesity as the main contributing factor to NAFLD severity in the LC group.
In summary, based on a multidisciplinary approach, we highlight that habitual HC consumption may be associated with adverse hepatic metabolism and NAFLD severity, which result from alterations in the gut microbiome. In particular, we demonstrated that HC intake is significantly associated with insulin resistance markers and may lead to a prominent shift in microbial diversity and the abundance of specific taxa according to NAFLD activity. We also confirmed that the addition of microbial taxa may significantly improve the prediction of NASH in the HC group. Therefore, the enrichment of pathogenic intestinal microbiota and the depletion of protective gut microbiota by increased NAFLD severity in the HC group seem to be associated with host hepatic metabolism through the transcriptional activation of hepatic DNL.
Methods
Study population and liver histology
This cross-sectional study was performed using the ongoing Boramae NAFLD cohort (NCT02206841).Citation11,Citation55,Citation56 This study was performed in accordance with the ethical guidelines of the 1975 Declaration of Helsinki for the participation of human subjects. This study protocol was approved by the Institutional Review Board of Boramae Medical Center (IRB No. 26–2017-48). All study subjects provided written informed consent. The liver specimens were obtained using 16 G disposable needles, then fixed in 4% formalin and embedded in paraffin. The specimens with 20 mm in length and 3 mm in thickness were stained with hematoxylin and eosin and Masson’s trichrome. Liver histology was assessed using the NAFLD activity scoring system.Citation57 The combination of scored steatosis, lobular inflammation, and ballooning was considered for categorizing study subjects. Patients with an NAS of 0–2 were classified as non-NASH (N0), those with an NAS of 3–4 were classified as having borderline NASH (N1), and those with an NAS of 5–8 were classified as having definite NASH (N2).Citation58 Participants with type 1 DM and advanced fibrosis (≥F3) were excluded from this study. Clinical, biochemical, and genetic parameters were evaluated as previously described elsewhere.Citation11,Citation55,Citation56
Dietary analysis
Usual dietary intake was assessed using 103 items from a food frequency questionnaire (FFQ).Citation59 The frequency of servings during the last year was classified into nine categories: never, once a month, 2–3 times a month, 1–2 times a week, 3–4 times a week, 5–6 times a week, once a day, twice a day, and three times a day. Portion size was categorized as small, medium, or large. Each individual’s daily nutrient intake was calculated using CAN-Pro 5.0 (The Korean Nutrition Society, Seoul, Korea). The calculated daily absolute amount of carbohydrate intake (g) was converted to energy consumed from carbohydrate by multiplying by four calories. Carbohydrate consumption as a proportion of daily energy intake was determined by dividing calories from carbohydrate by the total energy intake.
Biomarker measurements
The HOMA-IR and adipo-IR were measured as described in previous studies.Citation60,Citation61 Liver biopsy was only indicated for study subjects who had at least two risk factors. The risk factors included high TG levels, low high-density lipoprotein cholesterol levels, abdominal obesity, hypertension, DM or insulin resistance, and clinically suspected NASH or hepatic fibrosis.Citation55,Citation56
Microbiome data extraction from external cohorts
Curated metagenomic data from the NAFLD cohort were utilized in this study.Citation11 Raw data sequencing was processed using the QIIME pipeline (v 1.8.0).Citation62 Selection and assignment of operational taxonomic unit (OTU) were performed using the gg_13_5 Greengenes database at 97% similarity level.Citation63 Representative sequences were selected and aligned using the UCLUST software and the PyNAST algorithm.Citation64 OTUs were assigned to taxa using the ribosomal database project classifier.Citation65, Citation66 Chimeric sequences were removed using the ChimeraSlayer algorithm.66 The relative abundance tables at the family and genus levels were used for the microbiome analysis. All of the relative abundance tables were filtered at the 0.001% abundance level and 50% persistence level.
Non-NAFLD cohort analysis
A total of 682 subjects were recruited from the Healthy Twin study, which was part of the Korean Genome Epidemiology study.Citation67 The HC and LC groups in this current study were created in concordance with the main study. Control and NAFLD risk groups were determined according to the HSI.Citation68 Detailed information on the sample collection, 16S rRNA sequencing targeting the V4 region, and bioinformatics processing is described elsewhere.Citation69 In the current study, processed operational taxonomic unit tables at the family and genus levels were utilized for comparing the compositions of the gut microbiomes.
Host genotyping
Single nucleotide polymorphisms (SNP) genotyping of the entire study population was performed using TaqMan 50 nuclease assays (Life Technologies, Carlsbad, CA) or Sanger sequencing (Macrogen, Inc, Seoul, South Korea) according to the manufacturer’s protocol. Hardy-Weinberg equilibrium was analyzed using the chi-square test. The following SNPs were selected and have been previously described:Citation55,Citation70 PNPLA3_rs738409 C > G,Citation71 TM6SF2_rs58542926 C > T,Citation72SREBF2_rs133291 C > T,Citation70 MBOAT7_rs641738 C > T,Citation73 and HSD17B13_rs72613567 adenine insertion (A-INS).Citation74
Liver transcriptome analysis
Total hepatic RNA was extracted using TRIzol reagent (Invitrogen, Carlsbad, CA), according to the manufacturer’s protocol. RNA quality was determined using the BioAnalyzer (Agilent Technologies, Inc., Santa Clara, CA). The mean RNA integrity number (RIN) was 8.35 (4.5–9.5). cDNA library construction was performed using a TruSeq Stranded Total RNA Sample Prep Kit (Illumina, Inc., San Diego, CA). Libraries were sequenced using the Illumina platform. Raw data in fastq format were processed using STARCitation75 and HTseq.Citation76 After performing a quality control of the raw counts, normalization of raw count data was undertaken using DESeq2.Citation77
Bioinformatic and statistical analyses
Statistical comparisons between the HC and LC groups were conducted with the Kruskal-Wallis test and Dunn’s multiple comparisons test using GraphPad Prism software ver 8.0d (GraphPad Software, San Diego, CA). Four indices of alpha diversity were calculated with OTU tables at the genus level using the Vegan package in R.Citation78 This package was also used to display NMDS plots of beta diversity. The distance between genera was calculated using the Bray-Curtis distance method, and differences between subgroups were evaluated using the analysis of similarities (ANOSIM) function. Random forest analysis was conducted using the RandomForestUtils package in RCitation79 to determine which microbial families were predictive of NASH. To exclude the potential confounding factors (age, BMI, and sex) for identifying specific taxa associated with NASH at the family level associated with NASH in the HC and LC groups, multivariate association analysis was performed using the MaAsLin2 package in R.Citation19 The functional pathway analysis was conducted using PICRUSt2, and the KEGG database was used to infer the metagenomes.Citation80 LEfSe with a threshold LDA score of 2.0 was performed to identify the pathways that significantly differed between the non-NASH (N0) and NASH (N1 and N2) subgroups in the HC and LC groups, respectively (Galaxy platform, https://huttenhower.sph.harvard.edu/galaxy)Citation81. To estimate the predictive power of the three microbial families (Ruminococcaceae, Veillonellaceae, and Enterobacteriaceae), AUROC analysis was performed using the pROC and multipleROC package in R.Citation82 For causal inference between variables, kernel causality analysis was used. The principal concept of the kernel causality method is to invest kernel regression in both directions of two variables; the variable with the larger correlation coefficient is considered the ‘kernel cause’.Citation83 This kernel cause was measured using the generalCorr package in RCitation84 and visualized using Cytoscape (v3.8.0).Citation85
Data availability
The V4 16S rDNA metagenome sequence datasets obtained in this study have been deposited in the European Nucleotide Archive databases under the accession number ERP109777 (https://www.ebi.ac.uk/ena/browser/view/PRJEB27662). The sequences from the Twin cohort study used in this study were deposited in the European Nucleotide Archive under the study accession number ERP010289. (https://www.ebi.ac.uk/ena/browser/view/PRJEB9205).
All other metadata that support the findings of this study are available from the corresponding author upon reasonable request.
Author contributions
H.K. and H.J.Y. conducted the human microbiome analysis and wrote the manuscript. G.L. performed the human microbiome sequencing. S.H.L contributed to the writing and statistical analysis during the revision process. T.Y. and M.C conducted the human liver transcriptome analysis. S.K.J., M.S.C., D.H.L., S.L., and W.K. collected specimens from Korean NAFLD subjects and conducted the clinical analysis. J.H.P. and J.H.K. analyzed the liver histology. H.J.Y., W.K., and G.P.K. designed the study, analyzed the data, and reviewed the paper. All authors read and commented on the manuscript.
Supplemental Material
Download Zip (3.2 MB)Acknowledgments
The draft of this manuscript was edited using Bioedit (https://www.bioedit.com) and AJE (https://www.aje.com). The graphical abstract was created using BioRender.com.
Funding
This work was funded by the National Research Foundation of Korea(NRF) Grant under (2021R1A2C2005820, 2021M3A9E4021818, 2021R1A2B5B03086637 and 2015M3C9A4053391), and the Korea Health Industry development institute (KHIDI) funded by the Ministry of Health & Welfare, Republic of Korea under (HI21C0538).
Disclosure statement
G.P.K. is a founder of KoBioLabs, Inc., a company that characterizing the role of host–microbiome interactions in individuals with chronic diseases. The other authors declare no competing interests.
Supplementary material
Supplemental data for this article can be accessed online at https://doi.org/10.1080/19490976.2022.2078612
Correction Statement
This article has been corrected with minor changes. These changes do not impact the academic content of the article.
References
- Chalasani N, Younossi Z, Lavine JE, Diehl AM, Brunt EM, Cusi K, Charlton M, Sanyal AJ . The diagnosis and management of non-alcoholic fatty liver disease: practice guideline by the American association for the study of liver diseases, American college of gastroenterology, and the American gastroenterological association. Hepatology. 2012;55:1–20. doi:10.1002/hep.25762.
- Younossi ZM, Rinella ME, Sanyal AJ, Harrison SA, Brunt EM, Goodman Z, Cohen DE, Loomba R. From NAFLD to MAFLD: implications of a Premature Change in Terminology. 2021;73(3):1194–1198. doi:10.1002/hep.31420.
- Taylor RS, Taylor RJ, Bayliss S, Hagström H, Nasr P, Schattenberg JM, Ishigami M, Toyoda H, Wai-Sun Wong V, Peleg N, et al. Association between fibrosis stage and outcomes of patients with nonalcoholic fatty liver disease: a systematic review and meta-analysis. Gastroenterology. 2020;158(6):1611–25.e12. doi:10.1053/j.gastro.2020.01.043.
- Rinella ME, Sanyal AJ. Management of NAFLD: a stage-based approach. Nat Rev Gastroenterol Hepatol. 2016;13(4):196–205. doi:10.1038/nrgastro.2016.3.
- Lambert JE, Ramos–Roman MA, Browning JD, Parks EJ. Increased De Novo Lipogenesis Is a Distinct Characteristic of Individuals With Nonalcoholic Fatty Liver Disease. Gastroenterology. 2014;146(3):726–735. doi:10.1053/j.gastro.2013.11.049.
- Azzu V, Vacca M, Virtue S, Allison M, Vidal-Puig A. Adipose Tissue-Liver Cross Talk in the Control of Whole-Body Metabolism: implications in Nonalcoholic Fatty Liver Disease. Gastroenterology. 2020;158(7):1899–1912. doi:10.1053/j.gastro.2019.12.054.
- Mansbach, Siddiqi S, Charles M, Siddiqi S, Siddiqi S. Control of chylomicron export from the intestine. Am J Physiol Gastrointest Liver Physiol. 2016;310(9):G659–G68. doi:10.1152/ajpgi.00228.2015.
- Donnelly KL, Smith CI, Schwarzenberg SJ, Jessurun J, Boldt MD, Parks EJ. Sources of fatty acids stored in liver and secreted via lipoproteins in patients with nonalcoholic fatty liver disease. J Clin Invest. 2005;115(5):1343–1351. doi:10.1172/JCI23621.
- Smith GI, Shankaran M, Yoshino M, Schweitzer GG, Chondronikola M, Beals JW, Okunade AL, Patterson BW, Nyangau E, Field T, et al. Insulin resistance drives hepatic de novo lipogenesis in nonalcoholic fatty liver disease. J Clin Invest. 2020;130(3):1453–1460. doi:10.1172/JCI134165.
- Byrne CD, Targher G. What’s new in NAFLD pathogenesis, biomarkers and treatment? Nat Rev Gastroenterol Hepatol. 2020;17(2):70–71. doi:10.1038/s41575-019-0239-2.
- Lee G, You HJ, Bajaj JS, Joo SK, Yu J, Park S, Kang H, Park JH, Kim JH, Lee DH, et al. Distinct signatures of gut microbiome and metabolites associated with significant fibrosis in non-obese NAFLD. Nat Commun. 2020;11(1):4982. doi:10.1038/s41467-020-18754-5.
- Aron-Wisnewsky J, Vigliotti C, Witjes J, Le P, Holleboom AG, Verheij J, Nieuwdorp M, Clément K. Gut microbiota and human NAFLD: disentangling microbial signatures from metabolic disorders. Nat Rev Gastroenterol Hepatol. 2020;17(5):279–297. doi:10.1038/s41575-020-0269-9.
- Valdes AM, Walter J, Segal E, Spector TD. Role of the gut microbiota in nutrition and health. BMJ. 2018;361:k2179. doi:10.1136/bmj.k2179.
- Luukkonen PK, Dufour S, Lyu K, Zhang X-M, Hakkarainen A, Lehtimäki TE, Cline GW, Peterson KF, Shulman GI, Yki-Järvinen H . Effect of a ketogenic diet on hepatic steatosis and hepatic mitochondrial metabolism in nonalcoholic fatty liver disease. 2020; 117:7347–7354 doi:10.1073/pnas.1922344117.
- Mardinoglu A, Wu H, Bjornson E, Zhang C, Hakkarainen A, Räsänen SM, Lee S, Mancina RM, Bergentall M, Pietiläinen KH, et al. An integrated understanding of the rapid metabolic benefits of a carbohydrate-restricted diet on hepatic steatosis in humans. Cell Metab. 2018;27(3):559–71.e5. doi:10.1016/j.cmet.2018.01.005.
- Benítez-Páez A, Kjølbæk L, Gómez Del Pulgar EM, Brahe LK, Astrup A, Matysik S, Schött H-F, Krautbauer S, Liebisch G, Boberska J, et al. A multi-omics approach to unraveling the microbiome-mediated effects of arabinoxylan oligosaccharides in overweight humans. mSystems. 2019;4(4):e00209–19. doi:10.1128/mSystems.00209-19.
- Anderson JW, Zeigler JA, Deakins DA, Floore TL, Dillon DW, Wood CL, Oeltgen PR, Whitley RJ . Metabolic effects of high-carbohydrate, high-fiber diets for insulin-dependent diabetic individuals. Am J Clin Nutr. 1991;54(5):936–943. doi:10.1093/ajcn/54.5.936.
- Kwon OW, Jun DW, Lee SM, Lee KN, Lee HL, Lee OY, Yoon BC, Choi HS . Carbohydrate but not fat is associated with elevated aminotransferases. Aliment Pharmacol Ther. 2012;35:1064–1072 doi:10.1111/j.1365-2036.2012.05061.x.
- Mallick H, Rahnavard A, McIver LJ, Ma S, Zhang Y, Nguyen LH, Tickle TL, Weingart G, Ren B, Schwager EHet al, Multivariable Association Discovery in Population-scale Meta-omics Studies. PLoS computational biology. 2021;17(11): e1009442.https://doi.org/10.1371/journal.pcbi.1009442.
- Vinod HD. Generalized correlation and kernel causality with applications in development economics. Commun Stat - Simul Comput. 2017;46(6):4513–4534. doi:10.1080/03610918.2015.1122048.
- McKeown NM, Meigs JB, Liu S, Saltzman E, Wilson PWF, Jacques PF. Carbohydrate nutrition, insulin resistance, and the prevalence of the metabolic syndrome in the Framingham offspring cohort. Diabetes Care. 2004;27(2):538–546. doi:10.2337/diacare.27.2.538.
- Nanri A, Mizoue T, Noda M, Takahashi Y, Kato M, Inoue M, Tsugane S, Japan Public Health Center-based Prospective Study Group. Rice intake and type 2 diabetes in Japanese men and women: the Japan Public Health Center–based Prospective Study. Am J Clin Nutr. 2010;92(6):1468–1477. doi:10.3945/ajcn.2010.29512.
- Tajima R, Kimura T, Enomoto A, Yanoshita K, Saito A, Kobayashi S, Masuda K, Lida K. Association between rice, bread, and noodle intake and the prevalence of non-alcoholic fatty liver disease in Japanese middle-aged men and women. Clin Nutr. 2017;36(6):1601–1608. doi:10.1016/j.clnu.2016.09.034.
- Farese Robert V, Zechner R, Newgard Christopher B, Walther Tobias C. The problem of establishing relationships between hepatic steatosis and hepatic insulin resistance. Cell Metab. 2012;15(5):570–573. doi:10.1016/j.cmet.2012.03.004.
- Adams LA, Lymp JF, St. Sauver J, Sanderson SO, Lindor KD, Feldstein A, Angulo P. The natural history of nonalcoholic fatty liver disease: a population-based cohort study. Gastroenterology. 2005;129(1):113–121. doi:10.1053/j.gastro.2005.04.014.
- Finck BN. Targeting Metabolism, Insulin Resistance, and Diabetes to Treat Nonalcoholic Steatohepatitis. Diabetes. 2018;67(12):2485–2493. doi:10.2337/dbi18-0024.
- Anhê FF, Jensen BAH, Varin TV, Servant F, Van Blerk S, Richard D, Marceau S, Surette M, Biertho L, Lelouvier B, et al. Type 2 diabetes influences bacterial tissue compartmentalisation in human obesity. Nat Metab. 2020;2(3):233–242. doi:10.1038/s42255-020-0178-9.
- Fei N, Bruneau A, Zhang X, Wang R, Wang J, Rabot S, Gérard P, Zhao L. Endotoxin producers overgrowing in human gut microbiota as the causative agents for nonalcoholic fatty liver disease. mBio. 2020;11(1):e03263–19. doi:10.1128/mBio.03263-19.
- Zhu L, Baker SS, Gill C, Liu W, Alkhouri R, Baker RD, Gill SR. Characterization of gut microbiomes in nonalcoholic steatohepatitis (NASH) patients: a connection between endogenous alcohol and NASH. Hepatology. 2013;57(2):601–609. doi:10.1002/hep.26093.
- Osbelt L, Wende M, Almasi E, Derksen E, Muthukumarasamy U, Lesker TR, Galvez EJC, Pils MC, Schalk E, Chhatwal P, et al. Klebsiella oxytoca causes colonization resistance against multidrug-resistant K. pneumoniae in the gut via cooperative carbohydrate competition. Cell Host Microbe. 2021;29(11):1663–+. doi:10.1016/j.chom.2021.09.003.
- Astbury S, Atallah E, Vijay A, Aithal GP, Grove JI, Valdes AM. Lower gut microbiome diversity and higher abundance of proinflammatory genus Collinsella are associated with biopsy-proven nonalcoholic steatohepatitis. Gut Microbes. 2020;11(3):569–580. doi:10.1080/19490976.2019.1681861.
- Goffredo M, Mass K, Parks EJ, Wagner DA, McClure EA, Graf J, Savoye M, Pierpont B, Cline G, Santoro N, et al. Role of gut microbiota and short chain fatty acids in modulating energy harvest and fat partitioning in youth. J Clin Endocrinol Metab. 2016;101(11):4367–4376. doi:10.1210/jc.2016-1797.
- Munukka E, Pekkala S, Wiklund P, Rasool O, Borra R, Kong L, Ojanen X, Cheng SM, Roos C, Tuomela S, et al. Gut-adipose tissue axis in hepatic fat accumulation in humans. J Hepatol. 2014;61(1):132–138. doi:10.1016/j.jhep.2014.02.020.
- Raman M, Ahmed I, Gillevet PM, Probert CS, Ratcliffe NM, Smith S, Greenwood R, Sikaroodi M, Lam V, Crotty P, et al. Fecal microbiome and volatile organic compound metabolome in obese humans with nonalcoholic fatty liver disease. Clin Gastroenterol Hepatol. 2013;11(7):868–75 e1–3. doi:10.1016/j.cgh.2013.02.015.
- Bommer Guido T, MacDougald Ormond A. Regulation of lipid homeostasis by the bifunctional SREBF2-miR33a Locus. Cell Metab. 2011;13(3):241–247. doi:10.1016/j.cmet.2011.02.004.
- Horton JD, Goldstein JL, Brown MS. SREBPs: activators of the complete program of cholesterol and fatty acid synthesis in the liver. J Clin Invest. 2002;109(9):1125–1131. doi:10.1172/JCI0215593.
- Caballero F, Fernández A, De Lacy AM, Fernández-Checa JC, Caballería J, García-Ruiz C. Enhanced free cholesterol, SREBP-2 and StAR expression in human NASH. J Hepatol. 2009;50(4):789–796. doi:10.1016/j.jhep.2008.12.016.
- Purushotham A, Schug TT, Xu Q, Surapureddi S, Guo X, Li X. Hepatocyte-specific deletion of SIRT1 alters fatty acid metabolism and results in hepatic steatosis and inflammation. Cell Metab. 2009;9(4):327–338. doi:10.1016/j.cmet.2009.02.006.
- Collin de L’hortet A, Takeishi K, Guzman-Lepe J, Morita K, Achreja A, Popovic B, Wang Y, Handa K, Mittal A, Meurs N, et al. Generation of human fatty livers using custom-engineered induced pluripotent stem cells with modifiable SIRT1 metabolism. Cell Metab. 2019;30(2):385–401.e9. doi:10.1016/j.cmet.2019.06.017.
- Erion DM, Yonemitsu S, Nie Y, Nagai Y, Gillum MP, Hsiao JJ, Iwasaki T, Stark R, Weismann D, Yu XX. SirT1 knockdown in liver decreases basal hepatic glucose production and increases hepatic insulin responsiveness in diabetic rats. 2009; 106:11288–11293.
- Yoon M-S. The role of mammalian target of rapamycin (mTOR) in insulin signaling. Nutrients. 2017;9(11):1176. doi:10.3390/nu9111176.
- Laplante M, Sabatini DM. mTOR signaling in growth control and disease. Cell. 2012;149(2):274–293. doi:10.1016/j.cell.2012.03.017.
- Polak P, Cybulski N, Feige JN, Auwerx J, Rüegg MA, Hall MN. Adipose-specific knockout of raptor results in lean mice with enhanced mitochondrial respiration. Cell Metab. 2008;8(5):399–410. doi:10.1016/j.cmet.2008.09.003.
- Khamzina L, Veilleux A, Bergeron S, Marette A. Increased activation of the mammalian target of rapamycin pathway in liver and skeletal muscle of obese rats: possible involvement in obesity-linked insulin resistance. Endocrinology. 2005;146(3):1473–1481. doi:10.1210/en.2004-0921.
- Um SH, Frigerio F, Watanabe M, Picard F, Joaquin M, Sticker M, Fumagalli S, Allegrini PR, Kozma SC, Auwerx J, et al. Absence of S6K1 protects against age- and diet-induced obesity while enhancing insulin sensitivity. Nature. 2004;431:200–205. doi:10.1038/nature02866.
- Okuno T, Kakehashi A, Ishii N, Fujioka M, Gi M, Wanibuchi H. mTOR activation in liver tumors is associated with metabolic syndrome and non-alcoholic steatohepatitis in both mouse models and humans. Cancers (Basel). 2018;10(12):465. doi:10.3390/cancers10120465.
- Wallace TM, Utzschneider KM, Tong J, Carr DB, Zraika S, Bankson DD, Knopp RH, Kahn SE. Relationship of liver enzymes to insulin sensitivity and intra-abdominal fat. Diabetes Care. 2007;30(10):2673–2678. doi:10.2337/dc06-1758.
- Kindt A, Liebisch G, Clavel T, Haller D, Hörmannsperger G, Yoon H, Kolmeder D, Sigruener A, Krautbauer S, Seeliger C, et al. The gut microbiota promotes hepatic fatty acid desaturation and elongation in mice. Nat Commun. 2018;9(1):3760. doi:10.1038/s41467-018-05767-4.
- Wellman AS, Metukuri MR, Kazgan N, Xu X, Xu Q, Ren NSX, Czopik A, Shanahan MT, Kang A, Chen W, et al. Intestinal epithelial sirtuin 1 regulates intestinal inflammation during aging in mice by altering the intestinal microbiota. Gastroenterology. 2017;153:772–786. doi:10.1053/j.gastro.2017.05.022.
- Trosvik P, de Muinck Ej, Stenseth NC, de Muinck EJ. Biotic interactions and temporal dynamics of the human gastrointestinal microbiota. Isme J. 2015;9(3):533–541. doi:10.1038/ismej.2014.147.
- Chung GE, Youn J, Kim YS, Lee JE, Yang SY, Lim JH, Song JH, Doo EY, Kim JS. Dietary patterns are associated with the prevalence of nonalcoholic fatty liver disease in Korean adults. Nutrition. 2019;62:32–38. doi:10.1016/j.nut.2018.11.021.
- Fan JG, Kim SU, Wong VW. New trends on obesity and NAFLD in Asia. J Hepatol. 2017;67(4):862–873. doi:10.1016/j.jhep.2017.06.003.
- Zelber-Sagi S, Nitzan-Kaluski D, Goldsmith R, Webb M, Blendis L, Halpern Z, Oren R. Long term nutritional intake and the risk for non-alcoholic fatty liver disease (NAFLD): a population based study. J Hepatol. 2007;47(5):711–717. doi:10.1016/j.jhep.2007.06.020.
- Musso G, Gambino R, De Michieli F, Cassader M, Rizzetto M, Durazzo M, Fagà E, Silli B, Pagano G. Dietary habits and their relations to insulin resistance and postprandial lipemia in nonalcoholic steatohepatitis. Hepatology. 2003;37(4):909–916. doi:10.1053/jhep.2003.50132.
- Koo BK, Joo SK, Kim D, Bae JM, Park JH, Kim JH, Kim W. Additive effects of PNPLA3 and TM6SF2 on the histological severity of non-alcoholic fatty liver disease. J Gastroenterol Hepatol. 2018;33(6):1277–1285. doi:10.1111/jgh.14056.
- Koo BK, Kim D, Joo SK, Kim JH, Chang MS, Kim BG, Lee KL, Kim W. Sarcopenia is an independent risk factor for non-alcoholic steatohepatitis and significant fibrosis. J Hepatol. 2017;66(1):123–131. doi:10.1016/j.jhep.2016.08.019.
- Kleiner DE, Brunt EM, Van Natta M, Behling C, Contos MJ, Cummings OW, Ferrell LD, Liu Y-C, Torbenson MS, Unalp-Arida A, et al. Design and validation of a histological scoring system for nonalcoholic fatty liver disease. Hepatology. 2005;41(6):1313–1321. doi:10.1002/hep.20701.
- Brunt EM, Kleiner DE, Wilson LA, Belt P, Neuschwander-Tetri BA, Network NCR, Network NCR. Nonalcoholic fatty liver disease (NAFLD) activity score and the histopathologic diagnosis in NAFLD: distinct clinicopathologic meanings. Hepatol. 2011;53(3):810–820. doi:10.1002/hep.24127.
- Ahn Y, Kwon E, Shim JE, Park MK, Joo Y, Kimm K, Park C, Kim DH. Validation and reproducibility of food frequency questionnaire for Korean genome epidemiologic study. Eur J Clin Nutr. 2007;61(12):1435–1441. doi:10.1038/sj.ejcn.1602657.
- Kashyap S, Belfort R, Gastaldelli A, Pratipanawatr T, Berria R, Pratipanawatr W, Bajaj M, Mandarino L, DeFronzo R, Cusi K, et al. A sustained increase in plasma free fatty acids impairs insulin secretion in nondiabetic subjects genetically predisposed to develop type 2 diabetes. Diabetes. 2003;52(10):2461–2474. doi:10.2337/diabetes.52.10.2461.
- Matthews DR, Hosker JP, Rudenski AS, Naylor BA, Treacher DF, Turner RC. Homeostasis model assessment: insulin resistance and beta-cell function from fasting plasma glucose and insulin concentrations in man. Diabetologia. 1985;28(7):412–419. doi:10.1007/BF00280883.
- Caporaso JG, Kuczynski J, Stombaugh J, Bittinger K, Bushman FD, Costello EK, Fierer N, Peña AG, Goodrich JK, Gordon JI, et al. QIIME allows analysis of high-throughput community sequencing data. Nat Methods. 2010;7(5):335–336. doi:10.1038/nmeth.f.303.
- DeSantis TZ, Hugenholtz P, Larsen N, Rojas M, Brodie EL, Keller K, Huber T, Dalevi D, Hu P, Andersen GL, et al. Greengenes, a chimera-checked 16S rRNA gene database and workbench compatible with ARB. Appl Environ Microbiol. 2006;72(7):5069–5072. doi:10.1128/AEM.03006-05.
- Caporaso JG, Bittinger K, Bushman FD, DeSantis TZ, Andersen GL, Knight R. PyNAST: a flexible tool for aligning sequences to a template alignment. Bioinformatics. 2010;26(2):266–267. doi:10.1093/bioinformatics/btp636.
- Cole JR, Wang Q, Fish JA, Chai B, McGarrell DM, Sun Y, Brown CT, Porras-Alfaro A, Kuske CR, Tiedje JM, et al. Ribosomal Database Project: data and tools for high throughput rRNA analysis. Nucleic Acids Res. 2014;42:D633–D42. doi:10.1093/nar/gkt1244.
- Haas BJ, Gevers D, Earl AM, Feldgarden M, Ward DV, Giannoukos G, Ciulla D, Tabbaa D, Highlander SK, Sodergren E, et al. Chimeric 16S rRNA sequence formation and detection in Sanger and 454-pyrosequenced PCR amplicons. Genome Res. 2011;21(3):494–504. doi:10.1101/gr.112730.110.
- Sung J, Cho S-I, Lee K, Ha M, Choi E-Y, Choi J-S, Kim H, Kim J, Hong KS, Kim Y, et al. Healthy Twin: a twin-family study of Korea—protocols and current status. Twin Res Hum Genet. 2006;9(6):844–848. doi:10.1375/twin.9.6.844.
- Lee JH, Kim D, Kim HJ, Lee CH, Yang JI, Kim W, Kim YJ, Yoon J-H, Cho S-H, Sung M-W, et al. Hepatic steatosis index: a simple screening tool reflecting nonalcoholic fatty liver disease. Dig Liver Dis. 2010;42(7):503–508. doi:10.1016/j.dld.2009.08.002.
- Lim MY, You HJ, Yoon HS, Kwon B, Lee JY, Lee S, Song Y-M, Lee K, Sung J, Ko G, et al. The effect of heritability and host genetics on the gut microbiota and metabolic syndrome. Gut. 2017;66(6):1031–1038. doi:10.1136/gutjnl-2015-311326.
- Koo BK, Joo SK, Kim D, Lee S, Bae JM, Park JH, Kim JH, Chang MS, Kim W . Development and validation of a scoring system, based on genetic and clinical factors, to determine risk of steatohepatitis in asian patients with nonalcoholic fatty liver disease. Clin Gastroenterol Hepatol. 2020;18(11):2592–9.e10. doi:10.1016/j.cgh.2020.02.011.
- Grimaudo S, Pipitone RM, Pennisi G, Celsa C, Cammà C, Di Marco V, Barcellona MR, Boemi R, Enea M, Giannetti A, et al. Association Between PNPLA3 rs738409 C>G Variant and Liver-related outcomes in patients with nonalcoholic fatty liver disease. Clin Gastroenterol Hepatol. 2020;18(4):935–44.e3. doi:10.1016/j.cgh.2019.08.011.
- Liu Y-L, Reeves HL, Burt AD, Tiniakos D, McPherson S, Leathart JBS, Allison MED, Alexander GJ, Piguet A-C, Anty R, et al. TM6SF2 rs58542926 influences hepatic fibrosis progression in patients with non-alcoholic fatty liver disease. Nat Commun. 2014;5(1):4309. doi:10.1038/ncomms5309.
- Donati B, Dongiovanni P, Romeo S, Meroni M, McCain M, Miele L, Petta S, Maier S, Rosso C, De Luca L, et al. MBOAT7 rs641738 variant and hepatocellular carcinoma in non-cirrhotic individuals. Sci Rep. 2017;7(1):4492. doi:10.1038/s41598-017-04991-0.
- Pirola CJ, Garaycoechea M, Flichman D, Arrese M, San Martino J, Gazzi C, Castaño GO, Sookoian SC. Splice variant rs72613567 prevents worst histologic outcomes in patients with nonalcoholic fatty liver disease[S]. J Lipid Res. 2019;60(1):176–185. doi:10.1194/jlr.P089953.
- Dobin A, Davis CA, Schlesinger F, Drenkow J, Zaleski C, Jha S, Batut P, Chaisson M, Gingeras TR. STAR: ultrafast universal RNA-seq aligner. Bioinformatics. 2012;29(1):15–21. doi:10.1093/bioinformatics/bts635.
- Anders S, Pyl PT, Huber W. HTSeq–a Python framework to work with high-throughput sequencing data. Bioinformatics. 2015;31(2):166–169. doi:10.1093/bioinformatics/btu638.
- Love MI, Huber W, Anders S. Moderated estimation of fold change and dispersion for RNA-seq data with DESeq2. Genome Biol. 2014;15(12):550. doi:10.1186/s13059-014-0550-8.
- Oksanen J, Blanchet FG, Kindt R, Legendre P, Minchin PR, O’Hara R, Simpson GL, Sólymos P, Stevens M, Wagner H. vegan: Community Ecology Package. 2012. Software http://CRAN.R-project.org/package=vegan
- Evans JS, Murphy MA, Holden ZA, Cushman SA. Modeling species distribution and change using random forest. Predictive species and habitat modeling in landscape ecology. New York: Springer; 2011. p. 139–159.
- Douglas GM, Maffei VJ, Zaneveld JR, Yurgel SN, Brown JR, Taylor CM, Huttenhower C, Langille M. PICRUSt2 for prediction of metagenome functions. Nat Biotechnol. 2020;38(6):685–688. doi:10.1038/s41587-020-0548-6.
- Boekel J, Chilton JM, Cooke IR, Horvatovich PL, Jagtap PD, Käll L, Lehtiö J, Lukasse P, Moerland PD, Griffin TJ, et al. Multi-omic data analysis using Galaxy. Nat Biotechnol. 2015;33(2):137–139. doi:10.1038/nbt.3134.
- Robin X, Turck N, Hainard A, Tiberti N, Lisacek F, Sanchez J-C, Müller M. pROC: an open-source package for R and S+ to analyze and compare ROC curves. BMC Bioinform. 2011;12(1):77. doi:10.1186/1471-2105-12-77.
- Vinod HD. Generalized correlation and kernel causality with applications in development economics. Commun Stat - Simul Comput. 2017;46:4513–4534.
- Vinod HD. Generalized correlations and kernel causality using R package generalCorr. Available at SSRN 2782223 2016.
- Otasek D, Morris JH, Bouças J, Pico AR, Demchak B. Cytoscape Automation: empowering workflow-based network analysis. Genome Biol. 2019;20(1):185. doi:10.1186/s13059-019-1758-4.