
ABSTRACT
Rheumatoid arthritis (RA) is closely associated with the oral and gut microbiomes. Fungal cell wall components initiate inflammatory arthritis in mouse models. However, little is known regarding the role of the fungal community in the pathogenesis of RA. To evaluate the association between RA and the gut microbiome, investigations of bacterial and fungal communities in patients with RA are necessary. Therefore, we investigated the compositions and associations of fecal bacterial and fungal communities in 30 healthy controls and 99 patients with RA. The relative abundances of Bifidobacterium and Blautia decreased, whereas the relative abundance of Streptococcus increased, in patients with RA. The relative abundance of Candida in the fecal fungal community was higher in patients with RA than in healthy controls, while the relative abundance of Aspergillus was higher in healthy controls than in patients with RA. Candida species-specific gene amplification showed that C. albicans was the most abundant species of Candida. Ordination analysis and random forest classification models supported the findings of structural changes in bacterial and fungal communities. Aspergillus was the core fecal fungal genus in healthy controls, although Saccharomyces spp. are typically predominant in Western cohorts. In addition, bacterial–fungal association analyses showed that the hub node had shifted from fungi to bacteria in patients with RA. The finding of fungal dysbiosis in patients with RA suggests that fungi play critical roles in the fecal microbial communities and pathogenesis of RA.
Introduction
Rheumatoid arthritis (RA) is an autoimmune disease that mainly affects the synovium in joints. Synovial thickening leads to the destruction of joint cartilage and bone.Citation1–3 Subsequently, RA can worsen and affect other joints, thereby increasing the risks of osteoporosis, Sjögren syndrome, heart diseases, and lung diseases.Citation4–7 Although the pathogenesis of RA is incompletely understood, interactions among genetic, environmental, and lifestyle factors have been proposed. A significant genetic risk factor for RA is HLA-DRB1.Citation8 Genome-wide association studies have shown that PTN22, PADI4, STAT4, and TRAF1-C5 are associated with the onset of RA.Citation9 Notably, the HLA-DRB1*0405 allele is closely associated with RA severity and susceptibility in Koreans.Citation10,Citation11 Clinical and experimental animal studies have shown that infection with Porphyromonas gingivalis, Proteus mirabilis, Epstein–Barr virus, or mycoplasma contributes to RA pathogenesis.Citation12 The involvement of microbes in the etiopathogenesis of RA has prompted the investigation of relationships between RA and changes in human-associated microbial communities.
Dysbiosis has been identified in the fecal bacterial communities of patients with RA. Generally, gut microbial diversity is lower in patients with RA than in healthy individuals.Citation13 Differences in the bacterial abundance were also observed. Specifically, the abundances of Prevotella copri, Collinsella, Eggerthella, and Lactobacillus increased in patients with RA, while the abundances of Bacteroides, Faecalibacterium, Veillonella, and Haemophilus decreased in those patients.Citation14,Citation15 Among the bacteria affected by RA, P. copri is predominantly present in the feces of patients with early RA; this species has been implicated in RA pathogenesis.Citation16 Treatment for RA also affects the composition of the gut bacterial community. For example, etanercept increased the abundances of the Cyanobacteria and Nostocophycideae classes and the Nostocales order; it decreased the abundances of the Deltaproteobacteria class and the Clostridiaceae family.Citation17 Patients who received methotrexate (MTX) showed a reduced abundance of Enterobacteriales and partial community restoration, compared with the typical dysbiotic community in patients with RA.Citation13,Citation17,Citation18 Additionally, the bacterial community is affected by the presence of rheumatoid factor (RF) or anti-citrullinated protein antibody (ACPA), which are markers used to classify RA. Moreover, the C-reactive protein level (CRP) and erythrocyte sedimentation rate (ESR) are associated with gut microbiome dysbiosis in patients with RA.Citation17,Citation19,Citation20
Similar to studies of bacteria, an association between fungi and RA pathogenesis has been reported. Intraperitoneal injections of a fungal cell wall component (zymosan or fungal β-glucan) into SKG mice in a specific pathogen-free laboratory resulted in the induction of autoimmune arthritis, whereas injections of an antifungal agent and antifungal cell wall component did not.Citation21 Therefore, fungi are essential for the initiation of autoimmune arthritis. In a previous study that investigated the gut fungal community of patients with RA in China, the abundance of Pholiota, Scedosporium, and Trichosporon were lower than in healthy controls. Suhomyces and Trebouxia, two fungal genera abundant in patients with RA, were positively correlated with RA biomarkers.Citation22 However, the effects of the fecal fungal community on RA have been less extensively investigated than the effects of the bacterial community.
Here, we investigated the fecal bacterial and fungal communities of patients with RA. We aimed to i) evaluate the fecal bacterial and fungal compositions and their interkingdom associations, ii) identify key taxa or operational taxonomic units (OTU) associated with compositional shifts in the fecal bacterial and fungal communities, and iii) examine the effects of medications on the fecal fungal community. The abundance of Candida was increased, while the abundance of Aspergillus was decreased, in the feces of patients with RA. The abundances of Candida and Aspergillus showed contrasting correlations with clinical factors used for RA diagnosis. In addition, the hub node, which plays a central role in bacterial–fungal associations, shifted from fungi to bacteria in patients with RA. Finally, the abundance of Candida albicans was affected by treatment for RA. Our study provides insight into the crucial roles of the fungal community in pathogenesis of RA.
Results
Descriptive statistics
The demographic and clinical features of patients with RA (RA) and healthy controls (HC) are shown in . The study included 99 RA and 30 HC. Ninety-one samples (91.9%) in the RA group were from women, while 100% of samples in the HC group were from women. The mean participant ages were 57.8 ± 10.1 years in the RA group and 46.9 ± 3.5 years in the HC group. RF and ACPA positivity were detected in 77 (77/93, 82.8%) and 75 (75/98, 76.5%) patients, respectively. Of the RA patients, 87 (87.9%) were prescribed conventional synthetic disease-modifying antirheumatic drugs (csDMARDs), while 40 (40.4%) were prescribed biologics (including 32 patients who were prescribed both biologics and csDMARDs). Medications used by patients with RA are listed in Table S1.
Table 1. Characteristics of study participants.
Fecal microbial community composition
Distinct compositional differences between HC and RA were observed in the fecal bacterial community (Figure S1). Bifidobacterium, Streptococcus, Blautia, Lachnospiraceae, and an unidentified species were abundant in both the RA and HC groups (). However, genera with relative abundances < 0.3% constituted 89.4% of genera in the RA group and 54.2% of genera in the HC group (). Furthermore, the abundances of Bifidobacterium and Blautia were higher in the HC group than in the RA group; the abundance of Streptococcus was higher in the RA group than in the HC group. These differences were statistically significant (Bifidobacterium, P = .0299; Blautia, P = .0024; Streptococcus, P = .0195) ().
Figure 1. Fecal microbial community composition in healthy controls and patients with RA. (a) Bacterial community composition at the genus level. (b) Pairwise comparison of abundant bacterial genera. (c) Fungal community composition at the genus level. (d) Pairwise comparison of abundant fungal genera. Taxa with abundance < 0.5% are grouped as “Low abundance.” In panels b and d, boxes and lines represent the interquartile ranges (Q3-Q1) and medians of relative abundances, respectively. Black dots indicate potential outliers. Lower and upper whiskers show minimum and maximum relative abundances of genera. Statistical significance was estimated by two-sided Mann–Whitney U test. ***, P < .001; **, P < .01; *, P < .05; ns, P > .05 (not significant). HC, healthy controls; RA, patients with RA.
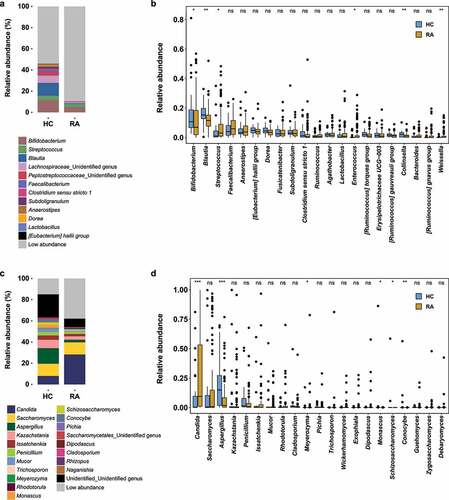
The most abundant fungal phyla were Ascomycota, Basidiomycota, and Mucoromycota (Figure S2). The ratio of Basidiomycota to Ascomycota was greater in the HC group than in the RA group (5.28%:65.7% in the HC group; 4.55%:75.42% in the RA group), while the proportion of Mucoromycota was greater in the HC group than in the RA group (mean relative abundances: 4.35% in the HC group and 1.74% in the RA group). The abundance of Saccharomycetes was greater in the RA group (HC, 35.2%; RA, 59.9%), while the abundance of Aspergillaceae was greater in the HC group (HC, 23.9%; RA, 10.0%) (Figure S2).
At the genus level, Candida, Saccharomyces, and Aspergillus were the most abundant fungi (). The relative abundance of Candida (P = .00013) was significantly greater in the RA group than in the HC group, while the relative abundance of Aspergillus (P = .00092) was significantly greater in the HC group than in the RA group (). Furthermore, the abundances of the genera Kazachctania, Issatchenkia, Penicillium, and Mucor tended to be greater in the RA group, although these findings were not statistically significant (). In contrast to the findings in a Western cohort, the abundance of Saccharomyces did not differ between the two groups (; mean relative abundances: HC, 12.9%; RA, 14.2%; P = .6204). Therefore, RA may be associated with compositional shifts in the fecal bacterial and fungal communities.
Fecal microbial diversity
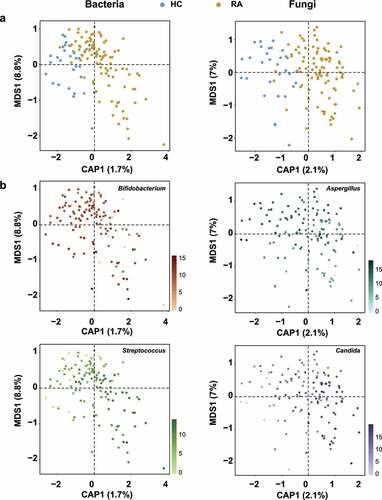
We next investigated the effects of RA on microbial community diversity. The alpha diversity indices, including OTUs, Shannon, and Simpson indices, of bacteria and fungi did not significantly differ between groups (all P > .05) (Figure S3). In Canonical analysis of principal coordinates (CAP), the constrained ordination analysis showed that bacterial and fungal communities were clearly separated into HC and RA groups (), although the unconstrained principal coordinates analysis did not show clear clustering of microbial communities according to RA status (Figure S4). Permutational analysis of variance (PERMANOVA) indicated significant compositional differences in the bacterial (RCitation2 = 0.01746, P = .0002) and fungal communities (RCitation2 = 0.0216, P = .0001) of the RA group (Table S2). The relative abundances of Bifidobacterium, Streptococcus, Aspergillus, and Candida differed between the two groups (). Although RA did not affect the richness or diversity of fecal microbial communities, it significantly affected beta diversity by shifting the taxonomic compositions of the fecal bacterial and fungal communities.
Figure 2. Ordination analysis of fecal bacterial and fungal communities in healthy controls and patients with RA. Compositional variations among samples were estimated by CAP, based on the Bray–Curtis distance metric. (a) Changes in composition of fecal bacterial and fungal communities. HC samples are shown in blue; RA samples are shown in dark yellow. (b) Ordination analysis according to the relative abundances of abundant genera. Greater intensity denotes higher relative abundance. Left and right sides of panels a and b are bacterial and fungal communities, respectively.
RA patient-associated bacterial and fungal OTUs
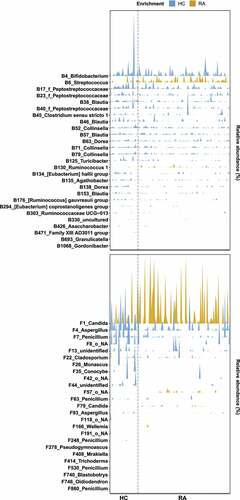
We investigated the relative abundances of OTUs in the HC and RA groups by linear discriminant analysis effect size (LEfSe) analysis. Among 1338 bacterial OTUs and 1595 fungal OTUs, 57 bacterial OTUs and 45 fungal OTUs were differentially abundant (Figures S5a, S6a). In total, 14 bacterial OTUs and 10 fungal OTUs were more abundant in the RA group than in the HC group. The RA-enriched OTUs belonged to the fungal genera Candida, Meyerozyma, Penicillium, Aurobasidium, Xeromyces, Coprinopsis, and Wallemia. Furthermore, 43 bacterial OTUs and 35 fungal OTUs were more abundant in the HC group than in the RA group. The HC-enriched OTUs belonged to the fungal genera Aspergillus, Conocybe, Monascus, and Schizosaccharomyces.
We investigated RA-associated OTUs via machine learning-based classification. For this analysis, we constructed random forest classification models for bacterial and fungal communities. The random forest models revealed that 70 bacterial OTUs and 70 fungal OTUs were needed to classify HC and RA samples (Figures S5b, S6b). Among these OTUs, 27 bacterial OTUs and 25 fungal OTUs were also identified by LEfSe (, S5a, S6a). Two bacterial OTUs and four fungal OTUs were more abundant in the RA group, while the remaining OTUs were more abundant in the HC group (). These findings imply that decreased abundances of bacterial and fungal OTUs contributed to compositional differences between the HC and RA groups.
Figure 3. Microbial signatures associated with RA. A random forest model was used to identify OTUs that explain the gut bacterial (a) and fungal (b) communities. OTUs are colored based on their classification as “HC-enriched” and “RA-enriched,” based on the results of differential abundance analysis (Figure S5a, S6a). Random forest models were constructed using a 10-fold cross-validation method. OTUs are arranged along the y-axis according to total abundance. Each mark on the x-axis indicates an individual HC or RA sample.
Fecal bacterial–fungal associations
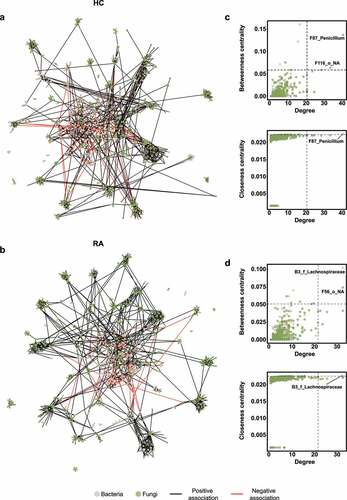
We constructed a correlation-based microbial network to investigate microbial associations. The fecal microbial network of the HC group comprised 701 nodes and 1419 edges (), whereas the fecal microbial network of the RA group comprised 801 nodes and 1679 edges (). Degree and betweenness centrality did not significantly differ between the HC and RA groups (Figure S7). There were more fungal nodes in the HC group than in the RA group, and hub composition differed between groups. Hub nodes were defined as nodes in which degree, betweenness centrality, and closeness centrality were in the top 1%. Based on this criterion, the hub of the bacterial–fungal interkingdom network of the HC group was the fungal OTU F87_Penicillium (). In the RA group, the hub node was the bacterial OTU B3_f_Lachnospiraceae in the Lachnospiraceae family (). These data suggest that fungi influence the microbial community composition in HC, while bacteria associated with dysbiosis influence the microbial community in patients with RA.
Figure 4. Interkingdom co-occurrence networks and hub nodes of fecal microbiota. (a) Interkingdom HC networks. (b) Interkingdom RA networks. In panels a and b, each node corresponds to an out; edges between nodes correspond to positive (black) or negative (red) correlations inferred from OTU abundance profiles using the SparCC method (P < .05, correlation values of < −0.3 or > 0.3). OTUs that belong to different microbial kingdoms are indicated by colors (bacteria, ivory; fungi, green), and node size reflects degree of centrality. (c) Hub nodes of microbial HC networks. (d) Hub nodes of microbial RA networks. In panels c and d, the hub was defined as a node in which degree, betweenness centrality, and closeness centrality were in the top 1%. Dashed lines indicate threshold values of degree, betweenness centrality, and closeness centrality.
Changes in the fecal fungal community in response to medication
The use of antirheumatic drugs alters the microbial community. For example, etanercept partially alleviated bacterial dysbiosis in patients with RA.Citation17 The gut bacterial community can also determine the responses of RA patients to MTX.Citation23 We examined the effects of RA therapeutics on the fungal community. We stratified the patients into three groups: csDMARDs (patients treated with csDMARDs; n = 55), csDMARDs + biologics (patients treated with csDMARDs and biologics; n = 32), and biologics (patients treated with biologics; n = 8). Because few patients were treated with biologics, the biologics group was excluded from further analysis. The genus Candida was more abundant in the csDMARDs and csDMARDs + biologics groups than in the HC group (). However, among patients with RA, the relative abundance of Candida was lower in the csDMARDs group than in the csDMARDs + biologics group (). Differences in Candida abundance within the RA groups were not statistically significant (). Compared with the csDMARDs + biologics group, the relative abundance of Aspergillus was decreased in the csDMARDs group, while the relative abundance of Penicillium was increased ().
Figure 5. Effects of medication on Candida abundance. (a) Fecal microbiota composition according to medication. (b) Relative abundance of Candida. Letters indicate statistical significance, as determined by Kruskal–Wallis test followed by Dunn’s test. (c) Results of quantitative PCR analysis of C. albicans. Letters indicate statistical significance, as determined by analysis of variance followed by Tukey’s honestly significant difference test. (d) Correlations between relative abundances of fungal OTUs and quantitative variables. Correlation coefficients were estimated using Spearman’s rank correlation. Asterisks indicate statistical significance (***, P < .001; **, P < .01; *, P < .05). Red and blue boxes indicate positive and negative correlations, respectively.
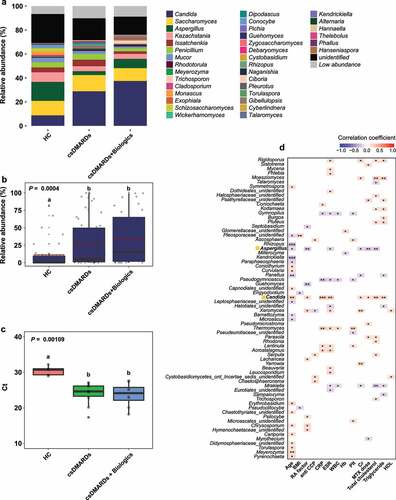
Polymerase chain reaction (PCR) using Candida-specific primers was performed on fecal samples randomly selected from the HC and RA groups. C. albicans was a fungal species with significantly greater abundance in RA samples. In the RA group, bands of 200 to 300 bp were observed; such bands were absent in the HC group (Figure S8). The amount of C. albicans DNA was significantly greater in the RA group than in the HC group (HC, Ct = 30.4 ± 1.33; RA, Ct = 23.9 ± 3.08). The amount of C. albicans DNA was slightly greater in the csDMARDs + biologics group than in the csDMARDs group (csDMARDs, Ct = 24.0 ± 3.02; csDMARDs + biologics, Ct = 23.7 ± 3.19) ().
In terms of clinical factors, the relative abundance of Candida was significantly positively correlated with age (Spearman r = 0.29153, P = .000802), RF level (Spearman r = 0.20217, P = .021579), CRP level (Spearman r = 0.2927, P = .000762), ESR (Spearman r = 0.27676, P = .000136), MTX dose (Spearman r = 0.18648, P = .034349), and total cholesterol level (Spearman r = 0.24822, P = .004563) (). The relative abundance of Aspergillus was significantly negatively correlated with those factors (RF level: Spearman r = −0.24993, P = .004283; ESR: Spearman r = −0.20742, P = .018344; MTX dose: Spearman r = −0.22778, P = .00943; and total cholesterol level: Spearman r = −0.238, P = .006607).
Fungal dysbiosis can be used for characterization of RA
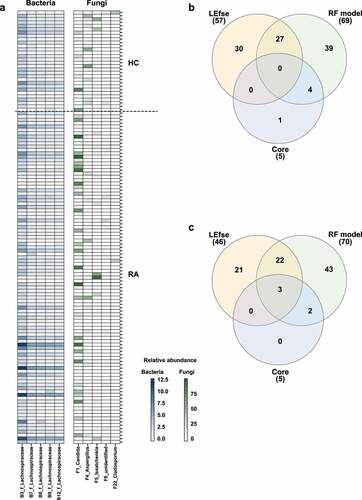
We identified core OTUs (or prevalent OTUs) in fecal samples: core bacterial OTUs were detected in 85% of the 129 fecal samples, while core fungal OTUs were detected in 70% of the fecal samples. Five core bacterial OTUs belonged to Lachnospiraceae, whereas five core fungal OTUs belonged to Candida, Aspergillus, Issatchenkia, Cladosporium, and an unidentified fungal genus (). Subsequently, three overlapping core fungal OTUs were discovered, but no overlapping core bacterial OTU was identified (). Among the bacterial core OTUs, B3_f_Lachnospiraceae, B8_f_Lachnospiraceae, and B9_f_Lachnospiraceae could distinguish between HC and RA groups using a random forest model. However, LEfSe revealed that differences in the relative abundances of these OTUs were not statistically significant (, S5). Among the fungal core OTUs, F1_Candida, F4_Aspergillus, and F22_Cladosporium could distinguish between HC and RA groups using both LEfSe and a random forest model (, S6). The association between ACPA and RF, which are serological markers of RA, and the fecal fungal community were investigated. Aspergillus and Candida, which differed in abundance between the HC and RA groups, were not associated with ACPA. Aspergillus was significantly associated negatively with RF, whereas Candida was correlated positively (). Therefore, changes in the fungal microbial community, particularly involving Candida and Aspergillus, could be a feature of RA.
Figure 6. Analysis of core OTUs in fecal microbiota. (a) Core OTUs were identified based on 85% prevalence for bacteria (dark blue) and 70% prevalence for fungi (dark green). Box colors indicate relative abundances of OTUs. Greater color intensity indicates higher relative abundance. Each mark on the y-axis indicates an individual sample. Venn diagrams of the numbers of (b) bacterial and (c) fungal OTUs identified by LEfSe, the random forest model, and core out analysis.
Discussion
The gut or fecal microbiome plays an important role in several human diseases. We found a distinct fecal microbial composition in patients with RA. Although the relative bacterial abundance differed between the RA and HC groups, alpha diversity did not differ (, S1, S3a). CAP and random forest analysis revealed that Bifidobacterium and Streptococcus were representative of the HC and RA groups, respectively (, S5). Similar distributions of bacterial genera in fecal samples have been identified in Asian cohorts.Citation13,Citation20,Citation24,Citation25
Fungi affect the composition of the bacterial community.Citation26–28 A bacterial–fungal interkingdom network analysis showed that F87_Penicillium was the hub OTU in the HC group, while B3_f_Lachnospiraceae was the hub OTU in the RA group (). The Penicillium subgenus produces numerous beneficial secondary metabolites, which have antibiotic, antifungal, immunosuppressive, and cholesterol-lowering properties.Citation29 The altered relative abundance of Penicillium was restored in RA patients via treatment with csDMARDs alone (). Lachnospiraceae are reportedly abundant in ACPA-positive patients.Citation19,Citation30 Because 75 (76.5%) of our RA patients were ACPA-positive, we hypothesized that the hub OTU shifted from F87_Penicillium to B3_f_Lachnospiraceae in patients with RA. The difference between RA and HC groups was clearer in the fungal community than in the bacterial community. F1_Candida and F4_Aspergillus were the most differentially abundant fungal genera ().
Aspergillus caused substantial changes in the fungal community. An OTU that belonged to Aspergillus (F4_Aspergillus) was a core fungal OTU (); it was more abundant in the HC group than in the RA group (). Saccharomyces cerevisiae has a beneficial effect on human health.Citation31,Citation32 Alterations in fecal fungal communities have mostly been studied in Western cohorts. We found a significant difference in Aspergillus abundance, rather than Saccharomyces abundance, between the HC and RA groups. Saccharomyces is reportedly more common among individuals who consume a Western diet (e.g., bread, beer, and dairy products), while Aspergillus is more common among individuals with a vegetarian diet.Citation33,Citation34 In Japan and China, where the diets are similar to the diet consumed in South Korea, Aspergillus was more abundant than Saccharomyces in the fecal fungal community of healthy adults.Citation35,Citation36 Therefore, based on the dietary proportions of vegetables and fermented soybean foods, Aspergillus is an essential member of the fecal fungal community in Koreans.Citation33,Citation34
Fungi had a substantial effect on fecal microbial community composition in patients with RA; Candida was the most abundant fecal genus (). Candida spp. are frequently detected in the human gastrointestinal tractCitation33 and feces;Citation37 their abundance is increased in patients with inflammatory bowel disease, cystic fibrosis, and vaginal candidiasis.Citation38 We found that medications for RA affected the fungal community composition, such that the abundance of C. albicans was enhanced by csDMARDs and biologics (). This is consistent with previous reports of increased C. albicans abundance in patients with inflammatory bowel disease (IBD) who were treated with immunosuppressants.Citation39–41 During treatment with disease-modifying antirheumatic drugs and tumor necrosis factor-α inhibitors, patients with RA showed an impaired C. albicans-specific Th17 response, which led to an increased abundance of C. albicans. Although the increased abundances of C. albicans in patients with RA and patients with IBD do not exclude the possibility that dysbiosis is caused by disease, they suggest that the dysbiosis is caused by medication. Moreover, although an increased abundance of C. albicans may result in opportunistic infections, the risk of candidiasis is low in patients with RA because they retain an effective immune response to C. albicans.Citation42
The decreased abundance of Aspergillus and increased abundance of Candida in the feces of patients in our study suggest that such changes are specific to RA. Further studies regarding Aspergillus will provide insight into its role in the healthy fecal fungal community and its effect on human health. Our findings suggest that changes in the fungal community could be used as an indicator of fecal dysbiosis in patients with RA.
In conclusion, we investigated dysbiosis and fungal–bacterial interactions in the fecal microbial communities of patients with RA. Changes in fungal communities indicated significant dysbiosis between HC and patients with RA, whereas changes in bacterial communities did not. Future research should examine whether the increased abundance of C. albicans is caused by immunosuppressive or immunomodulatory medications. Our results were limited in that they comprised bioinformatics-based predictions of the effects of RA-related changes on fecal microbial communities. In vivo experiments are required to confirm that RA alters the fungal community. Therefore, an experimental validation studies concerning the effects of C. albicans and Aspergillus on RA-related immune pathways are needed. Aspergillus was more abundant in the fecal fungal community of healthy Koreans, whereas Saccharomyces was comparable to patients with RA. Further research is necessary to clarify precisely our findings differ from the Western cohort.
Materials and methods
Sample collection
HC (n = 30) were recruited from the Wonju Severance Christian Hospital. HC who had a chronic, systemic autoimmune disease and pregnant or lactating women were excluded. RA (n = 99), who fulfilled the 2010 ACR/EULAR classification criteria,Citation43 were recruited from the Catholic University of Korea Seoul St. Mary’s Hospital. Each individual had been prescribed medication, including non-steroidal anti-inflammatory drugs, corticosteroids, csDMARDs, and biologics. All clinical data were obtained according to established methods, and the DAS28 was used to quantify disease activity.
The Ethics Committees of the Wonju Severance Christian Hospital Ethics Committee (IRB Approval Number: 19–008) and the Catholic University of Korea (IRB Approval Number: KC14TIMI0248) approved this study. Fecal samples were collected from March 2017 to November 2018 and promptly frozen at −20°C. Sequentially collected samples were transported to the laboratory and stored at −80°C before DNA extraction.
DNA extraction from feces
DNA extraction was performed using the QIAamp PowerFecal Pro DNA Kit (Qiagen, Germany), in accordance with the manufacturer’s instructions. DNA concentration and purity were determined with a Nanodrop 1000 (Thermo Fisher Scientific, USA). The collected DNA was stored at −20°C before amplification by PCR.
PCR amplification and sequencing
The V3–V4 regions of 16S ribosomal RNA (rRNA) genes were amplified using the Illumina-adapted universal primers 314F/805R. Each PCR reaction contained 12.5 ng of genomic DNA, 2.5 μL of Ex Taq 10× PCR buffer (Takara, Japan), 2.5 μL of dNTP mixture (Takara), 0.125 μL of Takara Ex Taq (Takara), 5 μL of each primer (200 nM final concentration), and distilled water to a total volume of 25 μL. The following thermocycler protocol was used: initial denaturing at 95°C for 3 min; 25 cycles of denaturing at 95°C for 30s, primer annealing at 55°C for 30s, and extension at 72°C for 30s; and final extension at 72°C for 5 min. PCR products were purified using AMPure XP beads (Beckman Coulter, USA), then quantified using a KAPA Library Quantification kit (KAPA Biosystems, USA). Sequencing was conducted on the MiSeq platform using a paired-end 2 ×300 base pairs reagent kit (Illumina, USA).
Subsequently, the fungal internal transcribed spacer 2 (ITS2) region of the 18S ribosomal RNA genes was amplified using the ITS3F/ITS4R primers and i-Starmax II polymerase (Intron Biotechnology, Korea). Each PCR reaction (final volume, 25 μL) contained 2.5 μL of 10× PCR buffer, 2.5 μL of dNTP mixture, 0.31 μL of i-Starmax II polymerase (Intron Biotechnology), 1.25 μL of each primer (500 nM final concentration), and 50–120 ng of genomic DNA. The following thermocycler protocol was used: initial denaturing at 94°C for 4 min; 35 cycles of denaturing at 94°C for 1 min, primer annealing at 60°C for 1 min, and extension at 72°C for 1 min; and final extension at 72°C for 10 min. PCR products were purified using AMPure XP beads (Beckman Coulter). DNA quality and quantity were measured using an Infinite 200 pro (Tecan, Switzerland). All samples were diluted to the same concentration, pooled into a single library, and concentrated using AMPure beads (Beckman Coulter); the pooled library was subjected to gel purification to remove any residual unwanted PCR products. Finally, the pooled library was sequenced on the Illumina MiSeq platform with a read length of 2 × 300 base pairs at the National Environmental Management Center of Seoul National University.
Sequence processing and filtering
After demultiplexing, overlapping sequences were merged with PEAR, then filtered with the DADA2 pluginCitation44 using the “denoise-single” command in QIIME2. Subsequently, high-quality sequences were clustered into OTUs using the open reference vsearch algorithm (vsearch cluster-features-openreference)Citation45 against the Silva 99% OTU representative sequence database (version 132, April 2018),Citation46 then assembled into an OTU table. Bacterial OTUs were clustered into OTUs using the UCHIME-de novo algorithm,Citation47 fungal sequences were checked for chimerism with UCHIME using the June 2017 chimera detection ITS2 database.Citation48 Next, the taxonomies of nonchimeric OTUs were assigned using the naïve Bayes algorithm implemented in the q2-feature-classifier, based on the Silva database for the V3–V4 region of the 16S rRNA sequences.Citation49 Alternatively, eukaryotes were classified using the UNITE database (UNITE version 7 dynamic of January 2017) for the ITS2 region.Citation50
Short bacterial (400 base pairs) and fungal (100–500 base pairs) sequences were used for in-depth analyses. First, OTU tables were imported into R using the readRPM component of the phyloseq package.Citation51 Next, sequence data were removed for organisms that had been assigned to non-kingdom-level groups (bacterial OTUs: orders “Chloroplast” and “Rickettsiales;” fungal OTUs: kingdoms “Unassigned,” “Rhizaria,” and “Metazoa”). Subsequently, false positive OTUs were removed from stool samples, while singleton OTUs were eliminated from all samples. This process reduced the total bacterial OTU count from 1346 to 1338 and total fungal OTU count from 1641 to 1595. The remaining 1338 bacterial OTUs and 1595 fungal OTUs were used for further analysis.
Statistical analyses and visualization
Statistical analysis was performed using R statistical software, version 3.5.2.Citation52 After multiple hypothesis tests had been corrected using the false discovery rate method, significant results were determined using a p-value threshold of 0.05. First, OTU tables were scaled by cumulative-sum scaling (CSS) and log-transformed (for normalization) using the cumNum and MRcounts functions in the metagenomeSeq package in R.Citation53 Next, rarefication of bacterial (5425 reads) and fungal (4256 reads) reads was conducted using the rarefy_even_depth function in the Phyloseq package in R; this was followed by calculation of the Shannon and Simpson indices using the diversity function in the Vegan (version 2.5–3) package in R. The Wilcoxon rank-sum test and one-way analysis of variance were also used. A Bray–Curtis dissimilarity matrix was produced for use in two separate principal coordinates analyses; CAP was then performed using RA and HC constraints, respectively, with the capscale and ordinate functions from the Vegan and Phyloseq packages. PERMANOVA using the adonis function in the Vegan package (version 2.5–3) was also used for analysis.Citation54 Subsequently, the core OTUs of RA and HC groups were identified using a prevalence threshold of 85% for bacteria and 70% for fungi. Differentially abundant OTUs between the RA and HC groups were identified using LEfSe (https://huttenhower.sph.harvard.edu/galaxy/).Citation55 Differences in OTU abundance were considered significant when p-values were < 0.05.
Microbial correlation networks
Bacterial–fungal networks were constructed to infer hub and complex OTU associations for RA and HC groups. Because the number of participants differed between the RA (n = 99) and HC (n = 30) groups, 30 samples from the RA group were randomly subsampled using the sample function in R software to avoid differences in network properties based on differences in sample size. Thus, we obtained 1302 OTUs for the HC group and 1428 OTUs for the RA group; these OTUs were used to construct interkingdom co-occurrence networks. In contrast, CSS-normalized OTU abundance tables that included bacteria and fungi were used as an input for SparCC;Citation56 significant associations between OTUs were restricted to OTUs with correlations of > 0.3 and < −0.3 (P < .05).Citation57 Co-occurrence networks were visualized with Gephi (version 0.9.2)Citation58 using the ForceAtlas2 layout. Within the networks, the proportions of inter-kingdom (associations between bacteria and fungi) and intra-kingdom (associations within the same kingdom) links were quantified and displayed in bar graph format.Citation59 Specifically, HC and RA networks were compared in terms of degree, betweenness centrality, closeness centrality, and eigenvector centrality; these values were computed using igraph (version 1.2.1).Citation60 The hub OTUs of each network were defined as the top 1% of OTUs in terms of degree, betweenness centrality, and closeness centrality. For the RA group, OTUs of degree > 20, betweenness centrality > 0.05343148, and closeness centrality > 0.01229823 were defined as hub OTUs. For the HC group, OTUs of degree > 19.7, betweenness centrality > 0.06493721, and closeness centrality > 0.02258181 were identified as hub OTUs.
Fungal strain cultivation
C. albicans (KCCM 11282) was obtained from the Korean Culture Center of Microorganisms (Korea). C. albicans was cultivated and maintained in yeast extract peptone dextrose (YPD) agar plates or YPD broth at 25°C. Viable cell numbers were determined by spreading serially diluted culture medium on YPD agar plates. Absorbance at 550 nm was measured using a microplate reader (Tecan).
DNA extraction and qualitative PCR (gel blotting of samples)
Single C. albicans colonies were inoculated and cultivated in YPD broth for 24 h. Broth cultures were centrifuged at 12,000 g for 5 min; DNA was then extracted from cell pellets using the QIAamp PowerFecal Pro DNA Kit (Qiagen). Next, genomic DNA was amplified using i-Starmax II polymerase (Intron Biotechnology). Each PCR reaction (final volume, 25 μL) contained 2.5 μL of 10× PCR buffer, 2.5 μL of dNTP mixture, 0.31 μL of i-Starmax II polymerase (Intron Biotechnology), 1.25 μL of each primer (500 nM final concentration), and 50–120 ng of genomic DNA. The following thermocycler protocol was used: initial denaturation at 94°C for 4 min; 35 cycles of denaturation at 94°C for 1 min, primer annealing at 60°C for 1 min, and extension at 72°C for 1 min; and final extension at 72°C for 10 min. The following primers were used: forward, 5′-TTTATCAACTTGTCACACCAGA-3′; reverse, 5′-ATCCCGCCTTACCACTACCG-3′.Citation61 PCR products were separated by electrophoresis on a 1.5% agarose gel containing SYBR DNA SafeStain (Thermo Fisher Scientific, USA). Bands were visualized using a ChemiDoc device (Thermo Fisher Scientific).
Real-time quantitative PCR to quantify C. albicans abundance
Real-time quantitative PCR was conducted with a QuantStudio 6 Flex Real-Time PCR system (Applied Biosystems, USA) using PowerUp™ SYBR® Green Master Mix (Thermo Fisher Scientific). The primers used for qualitative PCR of C. albicans were used for real-time quantitative PCR. Each PCR reaction (final volume, 20 μL) contained 10 μL of SYBR Green Master Mix, 0.8 μL of each primer, and 2 μL of genomic DNA. The following thermocycler protocol was used: denaturation at 95°C for 2 min, followed by 40 cycles of 95°C for 15s and annealing at 60°C for 60s. Amplification specificity was evaluated by melt curve analysis.
Author contributions
E.H.L., C.-H.P. and Y.-H.L. conceived and designed the study. J.H.K and W.-U.K. recruited the participants. K.H.C. performed bacterial miseq analysis. L.E.H performed all analyses. L.E.H, H.K., K.K.L, C.-H.P., and Y.-H.L. analyzed the data. E.H.L., H.K., J.H.K, W.-U.K., C.-H.P., and Y.-H.L. contributed to the writing of the manuscript. E.H.L., H.K. and Y.-H.L. prepared the manuscript. All authors read and approved the final manuscript.
List of abbreviations
| ACPA | = | Anti-citrullinated protein antibody |
| CAP | = | Canonical analysis of principal coordinates |
| CRP | = | C-reactive protein |
| CSS | = | Cumulative-sum scaling |
| csDMRADs | = | Conventional synthetic disease-modifying antirheumatic drugs |
| ESR | = | Erythrocyte sedimentation rate |
| HC | = | Healthy controls |
| IBD | = | Inflammatory bowel disease |
| LEfSe | = | Linear discriminant analysis effect size |
| OTU | = | Operational taxonomic units |
| PCoA | = | Principal coordinate analysis |
| PCR | = | Polymerase chain reaction |
| PERMANOVA | = | Permutational analysis of variance |
| RA | = | Rheumatoid arthritis |
| RF | = | Rheumatoid factor |
| rRNA | = | ribosomal RNA |
| YPD | = | Yeast extract peptone dextrose |
Supplemental Material
Download MS Word (3.1 MB)Disclosure statement
The authors declare that they have no competing interests.
Data availability statement
All raw sequences derived from this experiment were submitted into the Sequence Read Archive of NCBI and can be found under the BioProject accession number PRJNA791216. Metadata files, R data files, and R notebooks for full analyses are available from https://github.com/hyunkim90/rheumatoid_arthritis_and_mycobiota
Supplementary material
Supplemental data for this article can be accessed online at https://doi.org/10.1080/19490976.2022.2149020
Additional information
Funding
References
- Epstein FH, Harris ,ED. Rheumatoid arthritis: pathophysiology and implications for therapy. New Engl J Med. 1990;322(18):1277–16. doi:10.1056/NEJM199005033221805.
- Klareskog L, Catrina AI, Paget S. Rheumatoid arthritis. Lancet. 2009;373:659–672.
- Smolen JS, Aletaha D, Barton A, Burmester GR, Emery P, Firestein GS, Kavanaugh A, McInnes IB, Solomon DH, Strand V, et al. Rheumatoid arthritis. Nat Rev Dis Primers. 2018;4:18001.
- Tsuchiya Y, Takayanagi N, Sugiura H, Miyahara Y, Tokunaga D, Kawabata Y, Sugita Y. Lung diseases directly associated with rheumatoid arthritis and their relationship to outcome. Eur Respir J. 2011;37:1411–1417.
- Solomon DH, Goodson NJ, Katz JN, Weinblatt ME, Avorn J, Setoguchi S, Canning C, Schneeweiss S. Patterns of cardiovascular risk in rheumatoid arthritis. Ann Rheum Dis. 2006;65:1608–1612.
- He J, Ding Y, Feng M, Guo J, Sun X, Zhao J, Yu D, Li Z. Characteristics of Sjögren’s syndrome in rheumatoid arthritis. Rheumatology. 2013;52:1084–1089.
- Haugeberg G, Uhlig T, Falch JA, Halse JI, Kvien TK. Bone mineral density and frequency of osteoporosis in female patients with rheumatoid arthritis: results from 394 patients in the Oslo county rheumatoid arthritis register. Arthritis Rheumatol. 2000;43:522–530.
- McInnes IB, Schett G. The pathogenesis of rheumatoid arthritis. New Engl J Med. 2011;365:2205–2219.
- Stahl EA, Raychaudhuri S, Remmers EF, Xie G, Eyre S, Thomson BP, Li Y, Kurreeman FA, Zhernakova A, Hinks A. Genome-wide association study meta-analysis identifies seven new rheumatoid arthritis risk loci. Nat Genet. 2010;42:508.
- Bae S-C. Epidemiology and etiology of rheumatoid arthritis. J Korean Med Assoc. 2010;53:843–852.
- Okada Y, Wu D, Trynka G, Raj T, Terao C, Ikari K, Kochi Y, Ohmura K, Suzuki A, Yoshida S. Genetics of rheumatoid arthritis contributes to biology and drug discovery. Nature. 2014;506:376–381.
- Li S, Yu Y, Yue Y, Zhang Z, Su K. Microbial infection and rheumatoid arthritis. J Clin Cell Immunol. 2013;4(6):1–6.
- Zhang X, Zhang D, Jia H, Feng Q, Wang D, Liang D, Wu X, Li J, Tang L, Li Y. The oral and gut microbiomes are perturbed in rheumatoid arthritis and partly normalized after treatment. Nat Med. 2015;21:895–905.
- H-J W, Ivanov II, Darce J, Hattori K, Shima T, Umesaki Y, DR L, Benoist C, Mathis D. Gut-residing segmented filamentous bacteria drive autoimmune arthritis via T helper 17 cells. Immunity. 2010;32:815–827.
- Maeda Y, Takeda K. Host–microbiota interactions in rheumatoid arthritis. Exp Mol Med. 2019;51:1–6.
- Maeda Y, Kurakawa T, Umemoto E, Motooka D, Ito Y, Gotoh K, Hirota K, Matsushita M, Furuta Y, Narazaki M. Dysbiosis contributes to arthritis development via activation of autoreactive T cells in the intestine. Arthritis Rheumatol. 2016;68:2646–2661.
- Picchianti-Diamanti A, Panebianco C, Salemi S, Sorgi ML, Di Rosa R, Tropea A, Sgrulletti M, Salerno G, Terracciano F, D’amelio R. Analysis of gut microbiota in rheumatoid arthritis patients: disease-related dysbiosis and modifications induced by etanercept. Int J Mol Sci. 2018;19:2938.
- Chen J, Wright K, Davis JM, Jeraldo P, Marietta EV, Murray J, Nelson H, Matteson EL, Taneja V. An expansion of rare lineage intestinal microbes characterizes rheumatoid arthritis. Genome Med. 2016;8:1–14.
- Rooney CM, Mankia K, Mitra S, Moura IB, Emery P, Wilcox MH. Perturbations of the gut microbiome in anti-CCP positive individuals at risk of developing rheumatoid arthritis. Rheumatology. 2021;60:3380–3387.
- Chiang H-I, J-R L, Liu -C-C, Liu P-Y, Chen -H-H, Chen Y-M, Lan J-L, Chen D-Y. An association of gut microbiota with different phenotypes in Chinese patients with rheumatoid arthritis. J Clin Med. 2019;8:1770.
- Yoshitomi H, Sakaguchi N, Kobayashi K, Brown GD, Tagami T, Sakihama T, Hirota K, Tanaka S, Nomura T, Miki I. A role for fungal β-glucans and their receptor Dectin-1 in the induction of autoimmune arthritis in genetically susceptible mice. J Exp Med. 2005;201:949–960.
- Sun X, Wang Y, Li X, Wang M, Dong J, Tang W, Lei Z, Guo Y, Li M, Li Y. Alterations of gut fungal microbiota in patients with rheumatoid arthritis. PeerJ. 2022;10:e13037.
- Artacho A, Isaac S, Nayak R, Flor‐Duro A, Alexander M, Koo I, Manasson J, Smith PB, Rosenthal P, Homsi Y. The pretreatment gut microbiome is associated with lack of response to methotrexate in new‐onset rheumatoid arthritis. Arthritis Rheumatol. 2021;73:931–942.
- Jeong Y, Kim J-W, You HJ, Park S-J, Lee J, Ju JH, Park MS, Jin H, Cho M-L, Kwon B. Gut microbial composition and function are altered in patients with early rheumatoid arthritis. J Clin Med. 2019;8:693.
- Liu Z, Wu Y, Luo Y, Wei S, Lu C, Zhou Y, Wang J, Miao T, Lin H, Zhao Y. Self-balance of intestinal flora in spouses of patients with rheumatoid arthritis. Front Med. 2020;7:538–549.
- Sam QH, Chang MW, Chai LYA. The fungal mycobiome and its interaction with gut bacteria in the host. Int J Mol Sci. 2017;18:330.
- Deveau A, Bonito G, Uehling J, Paoletti M, Becker M, Bindschedler S, Hacquard S, Hervé V, Labbé J, Lastovetsky OA. Bacterial–fungal interactions: ecology, mechanisms and challenges. FEMS Microbiol Rev. 2018;42:335–352.
- van Tilburg Bernardes E, Pettersen VK, Gutierrez MW, Laforest-Lapointe I, Jendzjowsky NG, Cavin J-B, Vicentini FA, Keenan CM, Ramay HR, Samara J. Intestinal fungi are causally implicated in microbiome assembly and immune development in mice. Nat Commun. 2020;11:1–16.
- Kumar A, Asthana M, Gupta A, Nigam D, Mahajan S. 2018. Secondary metabolism and antimicrobial metabolites of Penicillium. In: Gupta V, editor. New and future developments in microbial biotechnology and bioengineering. Amsterdam, The Netherlands: Elsevier; p. 47–68.
- Mangalea MR, Paez-Espino D, Kieft K, Chatterjee A, Chriswell ME, Seifert JA, Feser ML, Demoruelle MK, Sakatos A, Anantharaman K. Individuals at risk for rheumatoid arthritis harbor differential intestinal bacteriophage communities with distinct metabolic potential. Cell Host Microbe. 2021;29:726–739. e725.
- Nash AK, Auchtung TA, Wong MC, Smith DP, Gesell JR, Ross MC, Stewart CJ, Metcalf GA, Muzny DM, Gibbs RA. The gut mycobiome of the human microbiome project healthy cohort. Microbiome. 2017;5:1–13.
- Wu X, Xia Y, He F, Zhu C, Ren W. Intestinal mycobiota in health and diseases: from a disrupted equilibrium to clinical opportunities. Microbiome. 2021;9:1–18.
- Hallen-Adams HE, Suhr MJ. Fungi in the healthy human gastrointestinal tract. Virulence. 2017;8:352–358.
- Suhr MJ, Banjara N, Hallen‐Adams HE. Sequence‐based methods for detecting and evaluating the human gut mycobiome. Lett Appl Microbiol. 2016;62:209–215.
- Motooka D, Fujimoto K, Tanaka R, Yaguchi T, Gotoh K, Maeda Y, Furuta Y, Kurakawa T, Goto N, Yasunaga T. Fungal ITS1 deep-sequencing strategies to reconstruct the composition of a 26-species community and evaluation of the gut mycobiota of healthy Japanese individuals. Front Microbiol. 2017;8:238.
- Qiu X, Zhao X, Cui X, Mao X, Tang N, Jiao C, Wang D, Zhang Y, Ye Z, Zhang H. Characterization of fungal and bacterial dysbiosis in young adult Chinese patients with Crohn’s disease. Therap Adv Gastroenterol. 2020;13:1756284820971202.
- Gurleen K, Savio R. Prevalence of candida in diarrhoeal stools. IOSR J Dent and Med Sci. 2016;15:47–49.
- Limon JJ, Skalski JH, Underhill DM. Commensal fungi in health and disease. Cell Host Microbe. 2017;22:156–165.
- Li Q, Wang C, Tang C, He Q, Li N, Li J. Dysbiosis of gut fungal microbiota is associated with mucosal inflammation in Crohn’s disease. J Clin Gastroenterol. 2014;48:513.
- Sokol H, Leducq V, Aschard H, Pham H-P, Jegou S, Landman C, Cohen D, Liguori G, Bourrier A, Nion-Larmurier I. Fungal microbiota dysbiosis in IBD. Gut. 2017;66:1039–1048.
- Imai T, Inoue R, Kawada Y, Morita Y, Inatomi O, Nishida A, Bamba S, Kawahara M, Andoh A. Characterization of fungal dysbiosis in Japanese patients with inflammatory bowel disease. J Gastroenterol. 2019;54:149–159.
- Bishu S, Su EW, Wilkerson ER, Reckley KA, Jones DM, McGeachy MJ, Gaffen SL, Levesque MC. Rheumatoid arthritis patients exhibit impaired Candida albicans-specific Th17 responses. Arthrit Res Ther. 2014;16:1–9.
- Aletaha D, Neogi T, Silman AJ, Funovits J, Felson DT, Bingham IIICO, Birnbaum NS, Burmester GR, Bykerk VP, Cohen MD. rheumatoid arthritis classification criteria: an American college of rheumatology/European league against rheumatism collaborative initiative. Arthritis Rheum. 2010;62:2569–2581.
- Callahan BJ, McMurdie PJ, Rosen MJ, Han AW, Johnson AJA, Holmes SP. DADA2: high-resolution sample inference from Illumina amplicon data. Nat Methods. 2016;13:581–583.
- Rognes T, Flouri T, Nichols B, Quince C, Mahé F. VSEARCH: a versatile open source tool for metagenomics. PeerJ. 2016;4:e2584.
- Quast C, Pruesse E, Yilmaz P, Gerken J, Schweer T, Yarza P, Peplies J, Glöckner FO. The SILVA ribosomal RNA gene database project: improved data processing and web-based tools. Nucleic Acids Res. 2012;41:D590–596.
- Edgar RC, Haas BJ, Clemente JC, Quince C, Knight R. UCHIME improves sensitivity and speed of chimera detection. Bioinformatics. 2011;27:2194–2200.
- Nilsson RH, Tedersoo L, Ryberg M, Kristiansson E, Hartmann M, Unterseher M, Porter TM, Bengtsson-Palme J, Walker DM, De Sousa F. A comprehensive, automatically updated fungal ITS sequence dataset for reference-based chimera control in environmental sequencing efforts. Microbes Environ. 2015;30:145–150.
- Bokulich NA, Kaehler BD, Rideout JR, Dillon M, Bolyen E, Knight R, Huttley GA, Caporaso JG. Optimizing taxonomic classification of marker-gene amplicon sequences with QIIME 2ʹs q2-feature-classifier plugin. Microbiome. 2018;6:1–17.
- Abarenkov K, Henrik Nilsson R, Larsson KH, Alexander IJ, Eberhardt U, Erland S, Høiland K, Kjøller R, Larsson E, Pennanen T. The UNITE database for molecular identification of fungi–recent updates and future perspectives. New Phytol. 2010;186:281–285.
- McMurdie PJ, Holmes S. phyloseq: an R package for reproducible interactive analysis and graphics of microbiome census data. PLoS One. 2013;8:e61217.
- R-Core-Team. R: a Language and environment for statistical computing. Vienna: R Foundation for Statistical Computing; 2017.
- Paulson JN, Stine OC, Bravo HC, Pop M. Differential abundance analysis for microbial marker-gene surveys. Nat Methods. 2013;10:1200–1202.
- Oksanen J, Blanchet FG, Kindt R, Legendre P, Minchin PR, O’Hara RB, Simpson GL, Solymos P, Stevens MHH, Wagner H. vegan: community ecology package. R package version 2.5-3. 2018.
- Segata N, Izard J, Waldron L, Gevers D, Miropolsky L, Garrett WS, Huttenhower C. Metagenomic biomarker discovery and explanation. Genome Biol. 2011;12:R60.
- Friedman J, Alm EJ. Inferring correlation networks from genomic survey data. PLoS Comput Biol. 2012;8:e1002687.
- Kurtz ZD, Müller CL, Miraldi ER, Littman DR, Blaser MJ, Bonneau RA. Sparse and compositionally robust inference of microbial ecological networks. PLoS Comput Biol. 2015;11:e1004226.
- Bastian M, Heymann S, Jacomy M. 2009. Gephi: an open source software for exploring and manipulating networks. Proceedings of the international AAAI conference on web and social media; San Jose, California. 361–362.
- Durán P, Thiergart T, Garrido-Oter R, Agler M, Kemen E, Schulze-Lefert P, Hacquard S. Microbial interkingdom interactions in roots promote Arabidopsis survival. Cell. 2018;175:973–983. e914.
- Csardi G, Nepusz T. The igraph software package for complex network research. Int J Complex Syst. 2006;1695:1–9.
- Frykman PK, Nordenskjöld A, Kawaguchi A, Hui TT, Granström AL, Cheng Z, Tang J, Underhill DM, Iliev I, Funari VA, et al. Characterization of bacterial and fungal microbiome in children with Hirschsprung disease with and without a history of enterocolitis: a multicenter study. PLoS One. 2015;10:e0124172–e0124172.