
ABSTRACT
Obesity is a major risk factor for the development of type 2 diabetes and cardiovascular diseases, and gut microbiota plays a key role in influencing the host energy homeostasis. Moreover, obese mice have a different gut microbiota composition, associated with an alteration of the intestinal mucus layer, which represents the interface between the bacteria and the host. We previously demonstrated that prebiotic treatment with oligofructose (FOS) counteracted the effects of diet-induced obesity, together with changes in the gut microbiota composition, but it is not known if the intestinal mucus layer could be involved. In this study, we found that, in addition to preventing high-fat diet (HFD) induced obesity in mice, the treatment with FOS increased the expression of numerous genes involved in mucus production, glycosylation and secretion, the expression of both secreted and transmembrane mucins, and the differentiation and number of goblet cells. These results were associated with significant changes in the gut microbiota composition, with FOS significantly increasing the relative and absolute abundance of the bacterial genera Odoribacter, Akkermansia, two unknown Muribaculaceae and an unknown Ruminococcaceae. Interestingly, all these bacterial genera had a negative association with metabolic parameters and a positive association with markers of the mucus layer. Our study shows that FOS treatment is able to prevent HFD-induced metabolic disorders, at least in part, by acting on all the processes of the mucus production. These data suggest that targeting the mucus and the gut microbiota by using prebiotics could help to prevent or mitigate obesity and related disorders.
Introduction
Overweight, obesity and type 2 diabetes are the major risk factors for the development of cardiovascular diseases. These disorders are among the top 10 global causes of death. The fundamental cause of obesity and overweight is an imbalance between the energy consumed and the energy expended.Citation1 However, several other factors are becoming recognized as influential. Among them, growing evidences have shown that the gut microbiota plays a key role in the regulation of energy homeostasis.Citation2
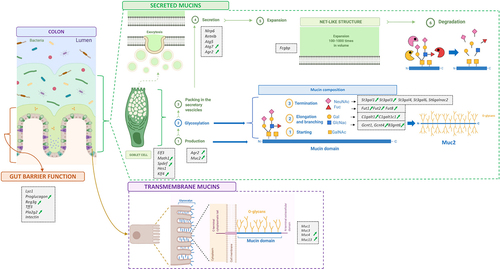
It has been observed that during obesity and metabolic disorders the gut microbiota composition is different and this is associated with gut barrier dysfunction.Citation3,Citation4 Among the components of the gut barrier, the mucus layer is critical and hence has raised more attention in recent years. The mucus layer is the first line of protection of the gastrointestinal tract and the interface of communication between the gut microbiota and the host.Citation5 It is produced and secreted by the goblet cells and mainly composed of specific proteins called mucins. Mucins are heavily glycosylated proteins with different glycans, often representing more than 80% of the mucin mass.Citation5 The enzymes responsible for the mucin glycosylation are called glycosyltransferases and are specific for each glycan residue and for precise positions. The mucins are classified as secreted and transmembrane and the most important component of the mucus layer is the secreted mucin 2 (Muc2).
A mutual relationship exists between the intestinal mucus and the gut microbiota. For example, the mucus represents an energy source and an attachment site for certain bacteria and the latter are important for the correct mucus formation and function.Citation5 In addition, the gut microbes are considered the main driver of the mucus changes, as elegantly observed by Johansson et al.Citation6 who discovered that the colonic mucus layer of germ-free mice was penetrable to bacteria-sized beads, together with a lower abundance of Muc2 and altered levels of glycosyltransferases, compared to conventionally raised mice. Another study showed that the administration of two types of emulsifiers increased the penetrability and reduced the thickness of the mucus layer, together with the onset of obesity and metabolic disorders and, remarkably, all these effects were lost in germ-free mice.Citation7
Obesity and metabolic disorders induced by the administration of specific diets in animal models, such as high-fat diet (HFD), western-style diet (WSD), or low-fiber diet, are characterized by an alteration of the gut microbiota composition and a reduced thickness and an increased penetrability of the intestinal mucus layer.Citation8–10 Recently, an increased mucus penetrability has been observed in a cohort of type 2 diabetic patients.Citation11 Although these observations and findings have led the mucus layer to gain more attention in recent years, still little is known about its composition, the level of glycosyltransferases and the role of transmembrane mucins in this context. In addition, the whole process of mucus production – starting from the goblet cells, until the final secretion – has never been investigated and linked to the gut microbiota.
Therefore, in this study, we set out to understand how the communication with the gut microbiota might affect all the development process of the mucus layer in the context of obesity and metabolic disorders. To do so, we used fructooligosaccharides (FOS), also referred to as oligofructose, a widely studied prebiotic, in both animal models and humans, and known to improve the host metabolism (glucose, lipid and energy metabolism) by changing the gut microbiota composition.Citation12–24 Moreover, in addition to that, FOS has also been linked with the improvement of the gut barrier function, cardiovascular health, mineral absorption, cancer, inflammation, colitis and immune system.Citation18,Citation25–29
The key mechanisms behind the beneficial effects of this prebiotic have not been fully elucidated yet and so far, no studies have investigated the role of the mucus layer in the improvement of metabolic disorders. Thus, we hypothesized that the still unexplored mucus layer could be one of the actors involved. Therefore, we explored the expression of 35 markers involved in gut barrier function, goblet cell differentiation, mucus production, secreted and transmembrane mucins, mucus glycosylation and secretion in all the intestinal segments (jejunum, ileum, cecum and colon) in diet-induced obesity in mice treated or not with FOS. In addition, we investigated the gut microbiota composition, through both relative and absolute quantification, and searched for associations between bacterial genera and metabolic, gut barrier and mucus parameters.
Results
FOS supplementation prevents diet-induced obesity and glucose intolerance
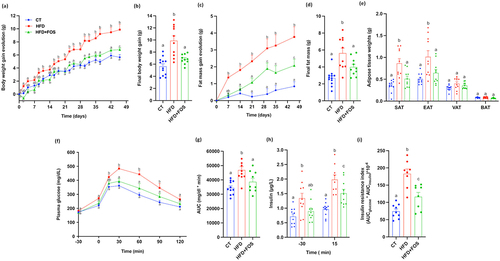
As previously observed in several studies,Citation15,Citation16,Citation19,Citation30,Citation31 we confirm that the supplementation with 10% of FOS significantly counteracted the increase in body weight and fat mass, compared to the mice fed only with HFD (), despite no differences in cumulative food intake and lean mass (Supplementary Fig. S1a-c). Importantly, FOS strongly counteracted the increase in body weight and fat mass, considering that they were not significantly different from the control group at the end of the 6 weeks of treatment (). The lower fat mass was explained by the significantly lower adipose tissue weights, in particular the subcutaneous and the epidydimal adipose tissues (). In addition, supplementation with FOS significantly counteracted the HFD-diet induced type 2 diabetes, as observed by the lower plasma glucose levels during the oral glucose tolerance test (OGTT) (). This result was also associated with significantly lower fasting insulin levels and insulin resistance index ().
Figure 1. Oligofructose supplementation prevents diet-induced obesity and glucose intolerance. (a) Body weight gain evolution and (c) fat mass gain evolution in grams during 6 weeks of treatment; (b) Final body weight gain and (d) final fat mass gain in grams after 6 weeks of treatment. (e) Adipose tissue weights of subcutaneous (SAT), epididymal (EAT), visceral (VAT) and brown (BAT) adipose tissue in grams after 6 weeks of treatment (n = 10–12/group). (f) Plasma glucose (mg dL−1) profile before and after 2 g/kg glucose oral challenge measured during the oral glucose tolerance test (OGTT) and (g) the mean area under the curve (AUC) (mg dL−1 min−1) (n = 10–12/group). (h) Plasma insulin (µg L−1) measured 30 minutes before and 15 minutes after the glucose administration during the OGTT. (i) Insulin resistance index determined by multiplying the area under the curve (from −30 to 15 min) of blood glucose and plasma insulin obtained during the OGTT (n = 8-9/group). Data are means ± s.e.m. Data with different subscript letters are significantly different (P < 0.05), according to one-way ANOVA followed by Tukey post hoc test for b,d,e,g−i and according to two-way ANOVA followed by Bonferroni post hoc test for a,c,f.
FOS treatment increases the proliferation of intestinal cells and the expression of markers involved in the gut barrier function
Supplementation with FOS induced a significant enlargement of the cecum, with whole tissue weights increasing by 118% and 143% compared to CT and HFD, respectively (). After removing the cecal content and weighing the remaining tissue, we observed a significant increase by 180% compared to HFD and 133% compared to the CT group (). The cecal content, reflecting gut microbiota fermentation, increased by 115% and 134% compared to CT and HFD, respectively (). In addition to stimulating the cell proliferation in the cecum, FOS had a similar effect in the jejunum, where we observed a significant increase in the length by 20% compared to HFD and 17% compared to CT group ().
Figure 2. Oligofructose increases microbiota fermentation, intestinal cell proliferation and markers of the gut barrier. (a) Full cecum, (b) empty cecum and (c) cecal content weight in grams after 6 weeks of treatment. (d) Representative images of the cecum taken immediately after sacrificing the mice. (e) Jejunum length in centimeters. (f-k) mRNA relative expression of markers of the gut barrier function measured in the jejunum, ileum, cecum and colon: antimicrobial peptides (f) Lysozyme C (Lyz1), (g) Regenerating islet-derived 3-gamma (Reg3g), (h) Phospholipase A2 group II (Pla2g2); (i) Intectin; (j) Trefoil factor 3 (Tff3); (k) Proglucagon. Data are means ± s.e.m. (n = 9–12/group). Data were analyzed using one-way ANOVA followed by Tukey post hoc test. Data with different subscript letters are significantly different (P < 0.05). *P < 0.05; **P < 0.01; ***P < 0.001; ****P < 0.0001.
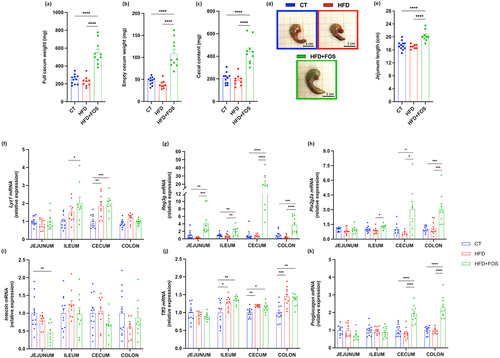
FOS supplementation has previously been linked with increased expression of some markers involved in the gut barrier function (e.g., antimicrobial peptides and intestinal epithelial cell turnover).Citation12,Citation13,Citation30,Citation32,Citation33 We observed that the treatment with FOS significantly increased the expression of the antimicrobial peptides lysozyme 1 (Lyz1) in the ileum and cecum, regenerating islet-derived protein 3-gamma (Reg3g) in all the intestinal segments and phospholipase A2 group IIa (Pla2g2a) in the ileum, cecum and colon (). Intectin, a key protein involved in the intestinal epithelial cell turnover, did not change significantly after FOS supplementation, except for a decrease in the jejunum (). Evaluation of trefoil factor 3 (Tff3) expression, a marker of maintenance and repair of the intestinal mucosa, revealed an increase in both HFD and FOS groups (). The expression of proglucagon, precursor of two important gastrointestinal peptides, glucagon-like peptide 1 (GLP-1) and glucagon-like peptide 2 (GLP-2), was found to be significantly increased by FOS supplementation in the cecum and in the proximal colon (), suggesting a higher production of GLP-1 and GLP-2, as previously shown.Citation12,Citation18,Citation19,Citation30,Citation32 Indeed, we also confirmed the significant increased levels of plasma GLP-1 in this study (Supplementary Fig. 3a). More specifically, GLP-1 is involved in the improvement of the energy and glucose metabolism,Citation17 while GLP-2 has been shown to enhance the intestinal epithelial cell proliferation and to reduce the gut permeability.Citation18
FOS increases the differentiation and number of goblet cells, the expression of markers involved in mucus production and the expression of secreted and transmembrane mucins
To investigate whether FOS could affect the different steps of mucus production, we measured several markers linked to the goblet cells that produce and secrete the intestinal mucus layer. We found that the treatment with FOS modified the mRNA expression of the transcriptional factors involved in the differentiation of these cells. Among them, we observed a significant increase in the colon of markers that direct the intestinal progenitor cells toward the secretory cells (i.e., atonal bHLH transcription factor 1 (Math1) and SAM pointed domain containing ETS transcription factor (Spdef)) (), while markers involved in the terminal differentiation of the secretory cells toward the goblet cells (i.e., E74-like ETS transcription factor 3 (Elf3) and kruppel-like factor 4 (Klf4)) were significantly increased in the cecum and colon, respectively ().
Figure 3. Oligofructose increases goblet cells differentiation and number and markers of mucins production. (a-e) mRNA relative expression of transcriptional factors involved in the goblet cells differentiation, in the jejunum, ileum, cecum and colon: atonal bHLH transcription factor 1 (Math1), SAM pointed domain containing ETS transcription factor (Spdef), E74-like ETS transcription factor 3 (Elf3), kruppel-like factor 4 (Klf4), hes family bHLH transcription factor 1 (Hes1) (n = 8-12/group). (f,g) Percentage of blue area on the total mucosal area in the proximal colon and representative images for each group (n = 9-11/group). (h-m) mRNA relative expression of markers involved in mucin production, in the jejunum, ileum, cecum and colon: (h) anterior gradient 2 (Agr2), (i) mucin 2 (Muc2), (j-m) mucin 1/3/4/13 (Muc1, Muc3, Muc4, Muc13) (n = 8-12/group). Data are means ± s.e.m. Data were analyzed using one-way ANOVA followed by Tukey post hoc test. *P < 0.05; **P < 0.01; ***P < 0.001; ****P < 0.0001.
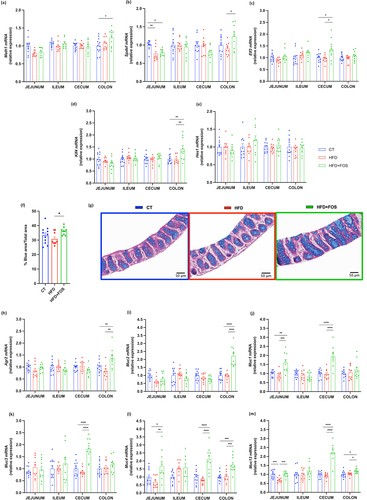
The increased expression of these transcriptional factors allowed us to hypothesize that the number of goblet cells would also be increased. To verify this, we measured the proportion of the blue area (mucins inside the goblet cells) to the total area within the intestinal mucosa and we found a significant increase by 18% in the percentage of blue area in the group supplemented with FOS compared to the HFD ().
We next explored whether the increased goblet cell number induced by FOS was associated with an increased production of secreted mucins, forming a protective intestinal mucus layer. We found that the supplementation with FOS was able to significantly increase the expression of the main component of the mucus layer, the secreted mucin 2 (Muc2), and the anterior gradient 2 (Agr2), which is required for the post-transcriptional synthesis and secretion of Muc2 in the colon ().Citation34 However, when doing colonic staining in the mucosal area with Muc2 antibody, no significant differences were found among the groups (Supplementary Fig. 4a).
Other important members of the mucus layer are the transmembrane mucins that protect the intestinal surface and transmit signals inside the cells.Citation35 Therefore, we measured the mRNA expression of some of them and observed that the supplementation with FOS increased significantly the expression of Muc1 in the jejunum and cecum, Muc3 only in the cecum, and both Muc4 and Muc13 in the jejunum, cecum and colon (). However, Muc13 staining in the colon did not show significant differences among the groups (Supplementary Fig. 4b).
FOS increases the expression of glycosyltransferases involved in mucin glycosylation
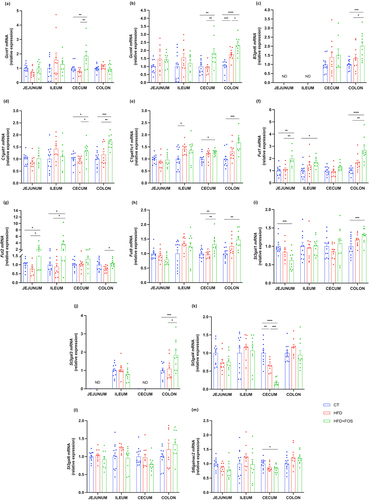
In addition to the markers linked to goblet cells and mucins production, we investigated the expression of some glycosyltransferases. These are the enzymes responsible for the addition of several glycans to the protein core of the mucins thereby directly influencing the composition of the mucus layer.Citation6,Citation36 There are many types of glycosyltransferases, and each of them is specific for the addition of a single type of glycan in a precise position. By measuring the expression of glycosyltransferases involved in the elongation and branching process, we observed that the treatment with FOS significantly increased the N-acetylglucosaminyltransferases Gcnt1 in the cecum, Gcnt4 in the cecum and colon and B3gnt6 in the colon, when compared to HFD and CT group (). The galactosyltransferases C1galt1 and its chaperone C1galt1c1 significantly increased in the cecum and colon (). The treatment with FOS also influenced the expression of the glycosyltransferases involved in the termination of the glycan chain. Indeed, we observed a significant increase of the fucosyltransferases Fut1 and Fut2 in the jejunum, ileum and colon and Fut8 only in the cecum and colon (). Finally, we observed a significant increase of the sialyltransferases St3gal1 and St3gal3 in the colon and a significant decrease of St3gal4 and St6galnac2 in the cecum ().
Figure 4. Oligofructose increases the expression of glycosyltransferases involved in mucin glycosylation. mRNA relative expression of glycosyltransferases in the jejunum, ileum, cecum and colon: (a) glucosaminyl (N-acetyl) transferase 1 (Gcnt1), (b) glucosaminyl (N-acetyl) transferase 4 (Gcnt4), (c) UDP-GlcNAc:betaGal beta-1,3-N-acetylglucosaminyltransferase 6 (B3gnt6), (d) core 1 synthase, glycoprotein-N-acetylgalactosamine 3-beta-galactosyltransferase 1 (C1galt1), (e) C1GALT1 specific chaperone 1 (C1galt1c1), (f-h) fucosyltransferase 1/2/8 (Fut1, Fut2, Fut8), (i-l) ST3 beta-galactoside alpha-2,3-sialyltransferase 1/3/4/6 (St3gal1, St3gal3, St4gal4, St3gal6), (m) ST6 N-acetylgalactosaminide alpha-2,6-sialyltransferase 2 (St6galnac2). Data are means ± s.e.m. (n = 7–12/group). Data were analyzed using one-way ANOVA followed by Tukey post hoc test. *P < 0.05; **P < 0.01; ***P < 0.001; ****P < 0.0001. ND = Not Detectable.
FOS increases markers of mucus secretion
After being synthesized and glycosylated in the goblet cells, Muc2 is packed inside the secretory vesicles that are then excreted by exocytosis, forming the protective mucus layer. Among the proteins involved in this process, we found a significant increase in expression of the bactericidal protein resistin-like beta (Retnlb), in the jejunum and ileum and an increase in the autophagic protein Atg5 in the cecum and colon and Atg7 only in the colon. We also measured the expression of the NOD‐like receptor family pyrin domain containing 6 (Nlrp6), which promote autophagy-dependent mucus secretion from goblet cells,Citation37,Citation38 and we found a significant increase in the cecum (). Finally, Fc gamma-binding protein (Fcgbp), involved in the stabilization of the Muc2 mucin networks of the inner firm mucus layer,Citation39,Citation40 was not different between the groups (). All the data from the mRNA expression described in the colon are schematized in .
Figure 5. Oligofructose increases markers of mucus secretion. (a-e) mRNA relative expression of markers involved in the secretion of the mucus layer: (a) resistin-like beta (Retnlb), (b,c) autophagy protein 5/7 (Atg5, Atg7), (d) NOD‐like receptor family pyrin domain containing 6 (Nlrp6), (e) Fc gamma binding protein (Fcgbp). (f) Weight of the mucus in the colon in milligrams after scraping (n = 9-12/group). (g) Mucus thickness measured in micrometer in the proximal colon by ImageJ and (h) representative images for each group (n = 6-8/group). Data are means ± s.e.m. Data were analyzed using one-way ANOVA followed by Tukey post hoc test. Data with different subscript letters are significantly different (P < 0.05). *P < 0.05; **P < 0.01; ***P < 0.001; ****P < 0.0001.
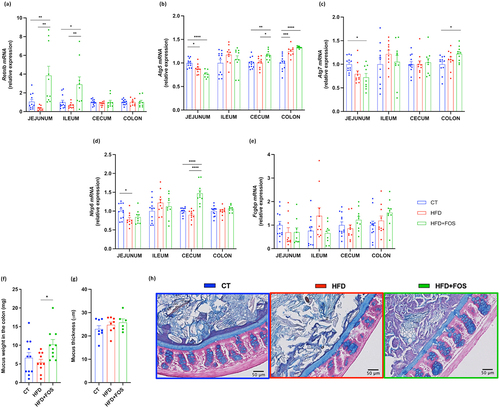
Figure 6. Summary figure of 35 markers measured in jejunum, ileum, cecum and colon. Markers involved in gut barrier function and mucins production, glycosylation and secretion measured by RT-qPCR. Markers are enclosed in small gray boxes. Green arrows indicate the ones that significantly increased due to the supplementation with oligofructose in the colon.
To further investigate the effects of FOS on mucus secretion, we weighted the collected mucus and measured the mucus thickness by histological analysis. We observed that FOS treatment significantly increased the weight of the mucus collected in the colon by 53% compared to the CT group and by 86% compared to the HFD group (), while HFD alone caused a reduction by 18% compared to the CT group, but without reaching significance. Finally, the colonic mucus thickness was similar between groups ().
Dietary treatments influence the gut microbiota composition in the feces and in the cecum
The mucus function and composition are profoundly affected by the gut microbiota, which in turn is strongly modulated by the dietary components.Citation6,Citation9,Citation19,Citation33,Citation36,Citation41–44 Therefore, we investigated the gut microbiota composition in the feces, before and at the end of the treatment, and in the cecum, at the end of the treatment. While most of the previous studies investigated the effects of FOS only on the relative abundance of the gut microbes, in the present study we chose to measure both the relative and the absolute abundance.
From the analysis of the beta-diversity, we observed that the gut microbiota of the mice was similar before starting the treatment (), while there was a significant clustering according to the diets at the end of the treatment, both in the feces and in the cecum (). The diets explained indeed the 20% and 40% of the microbiota variation in the feces and cecum, respectively, with the HFD+FOS group distinctly different from the CT and HFD ones. Moreover, we observed that the gut microbiota composition was significantly different between the fecal and cecal samples, but only for the CT and HFD+FOS group ().
Figure 7. Oligofructose induces changes in the fecal and cecal gut microbiota composition. (a-c) Principal coordinates analysis (PCoA) plot of the gut microbiota based on Bray-Curtis distances in (a,b) feces (before and at the end of the treatment) and in (c) the cecum, from mice grouped by treatment (control diet (CT), high fat diet (HFD) and high fat diet plus 10% oligofructose (HFD+FOS)) (n = 10–12/group). (d-g) Bar graphs showing grouped taxonomic profiles of the gut bacteria at a genus level: (d,e) relative and absolute abundance in the feces, before and at the end of the treatment; (f,g) relative and absolute abundance in the cecum, at the end of the treatment (n = 10–12/group). Only the bacterial genera that have a relative abundance > 1% are shown; the rest are included in “Others (<1%)”.
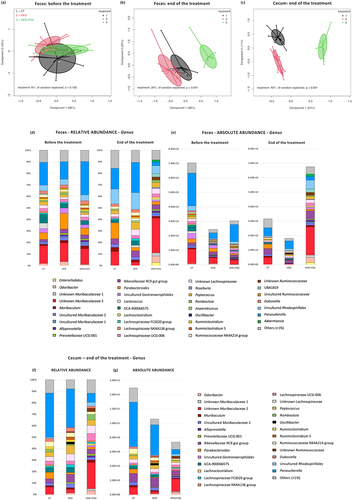
Similar to previous studies,Citation33 the abundance of Cyanobacteria, Bacteroidetes and Verrucomicrobia was significantly decreased upon HFD, and the abundance of Firmicutes increased compared to the CT group (Supplementary Fig. 2 d-f). Interestingly, adding FOS to the HFD had an opposite effect, increasing Bacteroidetes, Cyanobacteria and Verrucomicrobia and decreasing the Firmicutes and Proteobacteria (Supplementary Fig. S2 d-f). For more details see Supplementary Table 2. Looking at the predominant genera in each group, we observed that the CT and HFD groups were predominated by Parasutterella, while the HFD+FOS group was predominated by the unknown Muribaculaceae 2 (– and Supplementary Tables S3).
To simplify the discussion of the results obtained from statistical analysis, we present below only the bacterial genera that have a relative abundance >1% and that significantly changed in the same direction both in the feces and in the cecum, and both in relative and absolute abundance (FDR-p < 0.05); while the full results are detailed in the Supplementary Tables 3. Starting from a group fed only with the HFD, we observed a significantly lower abundance of Parabacteroides, two unknown members of Muribaculaceae (unknown Muribaculaceae 1 and 2) and a significantly higher abundance of unknown Ruminococcaceae, compared to the CT group. The addition of FOS to the HFD changed the abundance of many genera. In particular, the HFD+FOS group had significantly higher abundance of Odoribacter, two unknown members of Muribaculaceae (unknown Muribaculaceae 1 and 2) and unknown member of Ruminococcaceae and significantly lower abundance of Oscillibacter, Ruminiclostridium, Ruminiclostridium 5, Ruminococcaceae NK4A214 group and Parasutterella, compared both to CT and HFD group. As previously reported,Citation8,Citation19,Citation33 we observed that the supplementation with FOS increased the abundance of Akkermansia, both in the feces and in the cecum. However, the relative abundance significantly increased with respect to both CT and HFD groups, while the absolute abundance significantly increased only compared to the HFD group. Among the low abundant taxa (<1%), the FOS treatment significantly affected the Lactobacillus genus. As shown in previous studies,Citation18,Citation19,Citation33 we also observed that the treatment with HFD significantly decreased its levels, both in terms of relative and absolute abundance, but only in the feces, while the addition of FOS to the HFD significantly increased its levels, both in relative and absolute abundance, and both in the feces and in the cecum.
Finally, even if in most of the cases the abundance of the affected bacterial genera changed significantly in the same direction in the feces and cecum (with differences in terms of amount), some genera significantly changed only in one of the two gut segments. For example, Enterorhabdus, Prevotellaceae UCG 001 and Lachnospiraceae FCS020 group significantly changed only in the feces, while Ruminococcaceae UCG 005 and Faecalibaculum significantly changed only in the cecum (Supplementary Tables 3). This suggests that there are differences in the effects induced by the FOS fermentation on the gut microbiota composition in the two distinct intestinal compartments.
Associations between bacterial genera and variables of metabolism, gut barrier and mucus layer
We next investigated whether the absolute abundance estimates of specific bacterial genera were associated with the effects observed on metabolic parameters, gut barrier and mucus layer. Interestingly, we found numerous associations, as shown in the heat map ( and Supplementary Tables 4). For the graphical representation, we selected only the genera that significantly changed due to the treatment with FOS (compared to the HFD) and only the ones for which we found the most significant and numerous associations with markers of the mucus layer.
Figure 8. Associations between gut bacterial genera and variables of metabolism, gut barrier and mucus layer. (a,b) Heat map displaying the most significant and numerous baseline associations between gut bacterial genera (absolute abundance in the feces at the end of the treatment) and variables of metabolism, gut barrier, goblet cells and mucus production, glycosylation and secretion (in the colon) (n = 10–12/group). (a) Heat map created considering all the samples from all the groups (CT, HFD and HFD+FOS) (n = 10–12/group). (b) Heat map created considering only the samples from the group HFD+FOS (n = 10). Statistically significant FDR-adjusted p-values are noted with asterisks (*P ≤ 0.05, **P ≤0.01, ***P ≤ 0.001, ****P ≤ 0.0001).
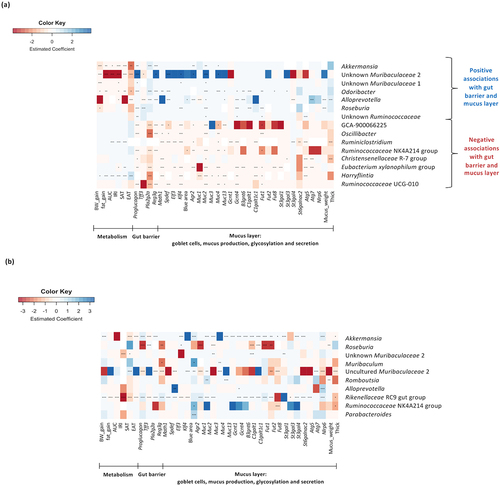
Among the bacterial genera that significantly increased in the group supplemented with FOS, we found that Akkermansia, Odoribacter, Alloprevotella, Roseburia, two unknown members of Muribaculaceae (unknown Muribaculaceae 1 and 2) and unknown Ruminococcaceae were all significantly and positively associated with many markers of the gut barrier function, goblet cells, secreted and transmembrane mucins, mucus production, glycosylation and secretion. Interestingly, we found that they were at the same time negatively associated with markers involved in metabolism (i.e., body weight, fat mass, glucose metabolism), except for the unknown Ruminococcaceae. Conversely, among the genera that significantly decreased due to the supplementation with FOS, we observed that Ruminiclostridium, Eubacterium xylanophilum group and Harryflintia were positively associated with some markers involved in the metabolism and negatively associated with some markers of the gut barrier and mucus function, while Lachnospiraceae GCA-900066575, Oscillibacter, Ruminococcaceae NK4A214 group, Ruminococcaceae UCG 010 and Christensenellaceae R7 group were only negatively associated with some markers of the gut barrier and mucus function.
depicts the associations when considering only the group supplemented with FOS (Supplementary Tables 4). Interestingly, we found that the genus Akkermansia and Rikenellaceae RC9 gut group were significantly and positively associated with almost all the markers involved in the mucus production, glycosylation and secretion. In particular, for the Rikenellaceae RC9 gut group it was also negatively associated with most of the markers of the metabolism.
Finally, when considering the strongest associations found and the bacterial genera, we observed that when comparing HFD+FOS to HFD group, there was a significantly higher abundance (fold change) of Roseburia (955-fold), Akkermansia (64-fold), unknown Muribaculaceae 2 (36-fold), Odoribacter (34-fold), Alloprevotella (25-fold) and Rikenellaceae RC9 gut group (4-fold) in the FOS group (absolute abundance in the feces at the end of the experiment; Supplementary Tables 3).
These data suggest that these bacterial genera may be linked to the prevention of diet-induced obesity, as well as in the modulation of the markers of the gut barrier and mucus production, glycosylation and secretion, induced by the FOS treatment.
Discussion
In this study, we found that treatment with the prebiotic FOS counteracted the effects of diet-induced obesity and uncovered that these effects were linked with significant changes in the intestinal mucus layer production, glycosylation and secretion. Previous studies have already demonstrated that FOS improves the gut barrier function, increasing the tight junction proteins, the production of IL-22 and reducing the gut permeability in obese/diabetic mice, by a mechanism linked with higher GLP-2 secretion, which is the product of proglucagon, also increased in our study.Citation18,Citation45 However, to our knowledge, this is the first time in which several mucus markers have been investigated in different intestinal compartments and linked to changes in the gut microbiota and protective effects against diet-induced obesity.
By first investigating the goblet cells, we found that treatment with FOS not only increased their number in the colon but also significantly increased the expression of the transcriptional factors involved in their differentiation. Apart from one study that explored the effect of FOS in rats fed a normal diet and showed an increased number of goblet cells,Citation46 no additional data is available in the current literature. We discovered that the increased number of goblet cells in the colon was accompanied by an increased expression of markers involved in mucus production, like the main component Muc2. Contrarily to what was observed by others,Citation47–50 we did not find significant difference in the goblet cell number and Muc2 expression between CT and HFD groups. One possible explanation could be the different animal model used (rat vs mouse) and the different length of the experiment (11, 12, 15 and 22 weeks). However, we did not find significant differences among groups for Muc2 staining in the mucosal area (Supplementary Fig. 4a). Also, we observed that the group supplemented with FOS had much higher variability than the other two groups and had more Muc2 in the luminal part. This could suggest that, probably, more mucus was secreted in the gut. Hence, we think that analyzing the whole Muc2 turnover could give more accurate information.
Rather than focusing only on the most explored secreted Muc2, we went further and discovered that supplementing FOS to the HFD induced the expression of some transmembrane mucins in the different intestinal compartments. Several studies have shown that the expression of the transmembrane mucins is altered in colorectal cancer and ulcerative colitis,Citation49,Citation51–53 and one study reported that dietary pea fiber supplementation improved glycemia together with the increased expression of Muc1 and Muc4 in ileal epithelium.Citation54
We next examined markers involved in mucin glycosylation that have been shown to be altered by dietary factors.Citation55–59 In particular, we focused on the glycosyltransferases that are suggested to correlate with the Muc2 glycosylation.Citation36 Surprisingly, we discovered that the supplementation with FOS significantly modulated the expression of many glycosyltransferases in the jejunum, ileum, cecum and colon. Specifically, FOS exerted the strongest effects in the colon, where it induced the expression of 9 glycosyltransferases out of 13. However, we observed only weak differences between the CT and HFD groups. This result is in accordance with a recent study that analyzed the colonic mucin O-glycosylation profile using modern glycomic techniques.Citation59 It showed that the mucin glycosylation was strikingly similar between the CT and HFD groups, while the strongest changes were induced by the two different dietary fibers supplemented with the HFD. These corroborate also our findings that dietary fibers have a greater impact on the mucin glycosylation than dietary fat content itself. Our study represents the first evidence in literature showing that the prebiotic-induced prevention of diet-induced obesity is accompanied by many changes in the glycosyltransferases profile, which are in turn directly linked to the mucin glycosylation. Indeed, while there are many evidences showing that the expression of some glycosyltransferases is altered in colorectal cancer, colitis and inflammation,Citation60–63 there are no other studies investigating their role in the context of obesity or dietary treatments, with the only exception for fucosyltransferases 2 (Fut2). More specifically, one study reported that Fut2-deficient mice were protected from western diet–induced obesity and steatohepatitis, and another showed that Fut2 mutation leads to liver disease.Citation64,Citation65 Interestingly, in our study, we found a significant increase in Fut2 expression in the jejunum, ileum and colon, only in the group supplemented with FOS, suggesting that it could indeed be associated with the protection against diet-induced obesity.
Finally, in addition to having an impact on mucus production and glycosylation, we found that the treatment with FOS also increased the mucus secretion, as observed by the largest quantity of mucus collected in the colon and the increased expression of the autophagic proteins required for the efficient mucus secretion. However, the quantity of the collected mucus could probably be influenced by other environmental factors, whereas we did not find any difference in the mucus thickness among the groups. This result is in contrast with some previous studies using HFD,Citation8,Citation66 for which however, the length of the experiment was different from ours (4 and 12 weeks). In addition, our results are similar to the ones obtained in recent studies after 8 weeks of WSD feeding and comparing ob/ob to lean mice.Citation9,Citation67 They indeed observed no change in the mucus thickness but an increased mucus penetrability and a reduced mucus growth, which could be a better indicator of the total mucus turnover, representing a combination of the mucus secretion and proteolytic processes.Citation67,Citation68
One of the questions we could raise could be as follows: how could we prevent diet-induced obesity by acting on the mucus layer? The answer resides in evidence showing that during HFD/WSD feeding and obesity/metabolic disorders, the mucus layer is altered (increased penetrability, reduced thickness, etc.) and this allows the bacteria to come closer to the intestinal epithelial cells and induce inflammation.Citation3,Citation7,Citation9,Citation10,Citation69 This, in turn, is associated with epithelial damage and increased intestinal penetrability that allow bacterial components (such as LPS), to diffuse into the systemic circulation and induce metabolic endotoxemia. The increased levels of LPS have then been associated with the onset of obesity and metabolic disorders, through the increase of fasted glycemia and insulinemia, body and fat weight gain, adipose tissue inflammation and others.Citation70 For that reason, by preventing mucus layer alterations, it could be likely possible to protect against the development of obesity and metabolic disorders.
The dose of 10% FOS in drinking water was used and validated in many studies as the effective dose needed to induce specific changes of the gut microbiota composition and eliciting metabolic effects.Citation8,Citation15,Citation18,Citation19,Citation33,Citation71 However, if we would like to translate these effects to humans, we should use 15–20 g of FOS per day, taking into consideration the fermentation capacity and tolerance of humans.Citation14,Citation21,Citation72–75 We do not know yet the exact mechanisms by which FOS induced these changes in the mucus layer, if they were mediated exclusively by the gut microbiota or if they could have been induced even by FOS alone. From previous studies, we know that FOS promoted for example the differentiation of cell precursors (stem cells) into mature L-cellsCitation32 and that inulin and oligofructose can modulate the immune system, which is in turn able to affect the mucus layer through the production of cytokines and inflammatory markers.Citation5,Citation76,Citation77 For example, in animal studies inulin and oligofructose activated immune cells in Peyer’s patches including IL-10 production and natural killer (NK) cell cytotoxicity and ex vivo culture of immune cells of oligofructose-fed mice resulted in increased concentrations of total IL-10.Citation77 In addition to that, dietary supplementation with fermentable inulin restored IL-22 production in mice fed a high-fat diet, protecting against metabolic syndrome, low-grade inflammation, microbiota encroachment and loss of enterocyte proliferation.Citation45 In our study, we found a trend toward higher plasmatic levels of IL-10 and IL-22 in the mice supplemented with FOS, which could be potentially involved in the changes observed in the mucus layer (Supplementary Fig. 3b,c). However, intestinal cell culture or germ-free mice could be a useful model to better understand the mechanism by which FOS impacts on the mucus layer.
Nevertheless, the treatment with FOS is well recognized to induce significant modifications of the gut microbiota compositions,Citation19,Citation33 and it is well known that the gut microbes represent the main modulator of the intestinal mucus layer.Citation6,Citation7,Citation9,Citation67 Therefore, it is likely that the major changes observed in this study are driven by the bacteria. Indeed, one study showed that two mice colonies housed in different rooms of the same animal facility had different gut microbiota and mucus phenotype.Citation41 The changes we observed in our study could be induced by the gut microbiota, for example, through bacterial components or metabolites.Citation5 In our previous studies, we observed that FOS increased the production of SCFAs, which have been shown to stimulate the mucus production.Citation33,Citation37,Citation78 In addition, one recent review highlights the ability of bacterial metabolites to induce epigenetic modification, changing the gene expression signatures, which could explain several changes we observed in our study.Citation79
Previous studies using FOS have focused only on the relative abundance of microbes and on the cecal content, while here we analyzed both cecal and fecal samples in both relative and absolute abundance. As relative data are compositional in nature, they can lead to misinterpretations of treatment effects in microbial community, as when the share of one taxon increases, other(s) will decrease, respectively. While quantitative PCR integrated with next-generation sequencing has been shown to give a more accurate estimation of the absolute taxon abundances, which is essential to better understand the dynamics and interactions of the gut microbiome.Citation80
In this study, we found that among the conditions, FOS had the strongest effect in changing the gut microbiota composition and for some genera we found differences between the results obtained via relative versus absolute quantification. Moreover, we also found significant differences between the fecal and cecal samples, which could explain the diverse outcomes obtained in the mucus markers in the cecum compared to those in the colon. Nevertheless, they shared the major changes in the bacterial genera. For example, we found that the group supplemented with FOS had significantly higher abundance of Odoribacter, Akkermansia, Lactobacillus, unknown Ruminococcaceae, two unknown Muribaculaceae (unknown Muribaculaceae 1 and 2) and significantly lower abundance of Oscillibacter, Ruminiclostridium, Ruminiclostridium 5, Ruminococcaceae NK4A214 group and Parasutterella, in both fecal and cecal samples and considering both relative and absolute abundances.
To determine the possible interaction between the observed bacterial genus changes and the results obtained from the measurements of metabolic, gut barrier and mucus layer parameters, we searched for associations. We discovered that Akkermansia, Roseburia, unknown Ruminococcaceae and several members of the order Bacteroidales i.e., Odoribacter, Alloprevotella and two unknown Muribaculaceae (unknown Muribaculaceae 1 and 2), were all significantly and positively associated with many markers of the mucus layer and, at the same time, negatively associated with metabolic parameters. In contrast, we observed that Ruminiclostridium, Harryflintia and Eubacterium xylanophilum group, all belonging to Firmicutes within the order Clostridiales, were positively associated with metabolic parameters and negatively associated with markers of the gut barrier and mucus layer. Interestingly, when considering only the group supplemented with FOS, we found that Akkermansia and the Rikenellaceae RC9 gut group were significantly and positively associated with almost all the markers involved in the mucus production, glycosylation and secretion. Considering that the genera negatively associated with metabolic parameters were, at the same time, positively associated with markers of the mucus layer, and vice versa, we suggest that the interaction between the intestinal mucus and the gut microbiota could be an important target to further explore for the prevention of diet-induced obesity.
At this stage of our knowledge, we are not yet able to explain how all these genera interact with the mucus layer and prevent diet-induced obesity, however some indications can be found in the current literature. For example, we found that the most abundant genus in the group supplemented with FOS was the unknown Muribaculaceae 2, both in relative and absolute abundance, which is an abundant but poorly characterized member of the mouse gut microbiota. Muribaculaceae family, previously named as S24-7, was found to be lower in WSD-fed and ob/ob mice compared to lean controls. Interestingly, these obese mice were characterized by a penetrable inner colonic mucus layer and a reduced mucus growth rate.Citation9,Citation67 Moreover, this bacterial family has been associated with an intact function of the inner colonic mucus layer.Citation81 Besides this family, there are other key bacterial species involved in the crosstalk between host and mucus.Citation82,Citation83 One of these is represented by Akkermansia muciniphila, residing in the mucus layer and defined as a mucin-degrading bacterium.Citation8,Citation84–86 It was shown that this bacterium increased the number of goblet cells and restored the mucus layer thickness in the mice fed with high-fat diet.Citation8,Citation84 In addition to this species, it was observed that Lactobacillus spp are able to stimulate Muc3 expression and Muc2 production and secretion,Citation87 Bifidobacterium longum restored mucus growth in mice fed a WSD and Lactobacillus reuteri showed a protective effect against dextran sulfate sodium treatment in mice, increasing the mucus layer thickness.Citation9,Citation88
However, the effects on the metabolism and gut microbiota are not exclusively limited to FOS, but even other types of fermentable carbohydrates, like resistant starches, arabinoxylans and others, produce similar effects regarding, for example, the decreased body weight gain, fat mass gain and glycemia.Citation89 In addition, dietary fibers modulate differently the gut microbiota composition, with distinct profiles depending on the source and type of non-digestible carbohydrates.Citation90
In conclusion, we confirmed that the prebiotic FOS counteracted the diet-induced obesity and discovered that these effects were linked to changes in the intestinal mucus layer production, glycosylation and secretion. In addition, we found significant changes in the gut microbiota composition, in feces and cecum, many of which were confirmed using both relative and absolute quantification techniques. Moreover, we found that FOS stimulated the growth of several bacterial genera that were negatively associated with metabolic parameters and positively associated with markers of the intestinal mucus layer.
Our results shed light on new potential targets of the under-investigated mucus layer that could be affected by FOS-induced changes in gut microbiota and could be involved in the prevention of diet-induced obesity. However, further investigation is needed to better understand their potential role in this context. Finally, whether the boost in certain specific bacterial genera is sufficient to explain some of our findings requires further explorations.
Materials and methods
Mice and diets
Seven-week-old male C57BL/6 J mice (Janvier, Le Genest-Saint-Isle, France) were co-housed in pairs under Specific and Opportunistic Pathogen-Free conditions (SOPF) in a controlled environment (temperature of 22 ± 2°C, 12-h daylight cycle) with free access to food and water. Upon arrival, all the mice underwent a 1-week acclimatization period, during which they were fed a control diet (CT) (AIN93Mi, Research Diet, New Brunswick, NJ, USA).
A set of 36 mice was randomly divided into 3 groups of 12 mice: 1) CT group, fed a control diet; 2) HFD group, fed a high-fat diet (60% fat and 20% carbohydrates (kcal/100 g), D12492, Research diet, New Brunswick, NJ, USA); and 3) HFD+FOS group, fed a HFD diet supplemented with 10% of prebiotic oligofructose added in the drinking water (Orafti, Tienen, Belgium). The dose of 10% of FOS, corresponding to an intake of 300 mg/d per mouse, represents the effective dose to induce changes in the gut microbiota composition and elicit metabolic effects.Citation8,Citation15,Citation18,Citation19,Citation33,Citation71 The treatment continued for 6 weeks.
Body weight, food and water intake were recorded three times per week. Body composition was assessed once a week by using a 7.5-MHz time-domain nuclear magnetic resonance (LF50 minispec; Bruker, Rheinstetten, Germany). Feces were harvested weekly since the beginning (Day 0) until the end of the experiment (Day 45). All mouse experiments were approved by and performed in accordance with the guidelines of the local ethics committee. Housing conditions were specified by the Belgian Law of 29 May 2013, regarding the protection of laboratory animals (agreement number LA1230314).
Oral glucose tolerance test
One week before the end of the experiment, the mice were fasted for 6 hours before receiving an oral gavage glucose load (2 g glucose per kg body weight). Blood glucose was measured 30 minutes before (time point −30), just prior the oral glucose load (time point 0) and then after 15, 30, 60, 90 and 120 minutes. Blood glucose was determined with a glucose meter (Accu Check, Roche, Switzerland) on blood samples collected from the tip of the tail vein.
Tissue sampling
At the end of the experiment (week 6) and after 6 h of fasting, all mice were anesthetized with isoflurane (Forene®, Abbott, Queenborough, Kent, England) and blood was collected from the portal and cava veins. The mice were then immediately euthanized by cervical dislocation and decapitation. Adipose depots (epididymal, subcutaneous, visceral and brown), muscles (tibialis anterior, vastus lateralis, gastrocnemius, soleus) and intestinal segments (jejunum, ileum, cecum and colon) were dissected, weighed and immersed in liquid nitrogen before long-term storage at −80°C for further analysis.
One segment of colon from each mouse was opened, without flushing it before, for the collection of the mucus layer by gently scraping with a microscope glass slide and then weighed.
Biochemical analysis
To determine the plasma insulin concentration, blood was harvested from the tip of the tail vein using capillaries prior to glucose load (−30 min) and 15 min after glucose load. Plasma insulin concentration was measured using an ELISA kit (Mercodia, Uppsala, Sweden), according to the manufacturer’s instructions. Insulin resistance index was determined by multiplying the area under the curve of the blood glucose (−30 to 15 min) and the plasma insulin (−30 min and 15 min).
RNA preparation and gene expression analysis by real-time qPCR analysis
Total RNA was prepared from tissues using TriPure reagent (Roche). Quantification and integrity analysis of the total RNA was performed by running 1 μl of each sample on an Agilent 2100 Bioanalyzer (Agilent RNA 6000 Nano Kit, Agilent). cDNA was prepared by reverse transcription of 1 μg total RNA using a Reverse Transcription System kit (Promega, Leiden, The Netherlands). Real-time PCRs were performed with the StepOnePlus real-time PCR system and software (Applied Biosystems, Den IJssel, The Netherlands) using Mesa Fast qPCR SYBR green mix (Eurogentec, Seraing, Belgium) and with the CFX Manager 3.1 software (Bio-Rad, Hercules, CA) using Mesa Fast qPCR (GoTaq qPCR Master Mix, Promega, Madison, WI, USA) for detection, according to the manufacturer’s instructions. RPL19 was chosen as housekeeping gene. All samples were run in duplicate in a single 96-well reaction plate, and data were analyzed according to the 2−ΔΔCt method. The identity and purity of the amplified product was checked through analysis of the melting curve carried out at the end of amplification. Primer sequences for the targeted mouse genes are available in Supplemental Table 1.
Analysis of the mucus layer thickness, goblet cells and immunohistochemistry
Colon segments were immediately removed and fixed in Carnoy’s solution (ethanol 6: acid acetic 3: chloroform 1, vol/vol) for 2 h at 4°C. They were then immersed in ethanol 100% for 24 h.
For the analysis of the mucus layer thickness and goblet cells, paraffin sections of 5 μm were stained with alcian blue. Images were captured at ×20 magnification and obtained using a SNC400 slide scanner and digital Image Hub software 561 (Leica Biosystems, Wetzlar, Germany). Analyses were performed using ImageJ (version 1.48r, National Institutes of Health, Bethesda, Maryland, USA) in a blinded manner. For the mucus layer thickness, two to six fields were used for each mouse and a minimum of 20 different measurements were made perpendicular to the inner mucus layer per field, for a total of 3031 measurements. For the goblet cells, the luminal side, muscularis mucosae, submucosa and muscle layer were removed and the blue area and the total area were measured separately in the remaining mucosal part of the colon. The proportion of the goblet cells was quantified based on the ratio between the blue area over the total area.
For immunohistochemistry, paraffin-embedded sections were deparaffinized in toluene (3 × 5 min) and rehydrated in isopropanol 100% (3 × 5 min). Endogenous peroxidases were inactivated in 3% (v/v) hydrogen peroxide for 30 min at room temperature. The sections were subjected to heat-induced epitope retrieval in citrate buffer (pH 5.7), in microwave at 900 W for 4 min, 90 W for 15 min and 900 W for 1:30 min. The sections were washed 3 times between all subsequent steps in TBS (pH 7.2–7.4) containing 0.05% Triton. Nonspecific binding was blocked with TBS/BSA 5%/Triton 0.05% at room temperature for 60 min. All the sections were incubated with rabbit anti-Muc2 polyclonal antibody (RRID: AB_2746817, #PA5-79702, Thermo Fisher Scientific) or rabbit anti-Muc13 polyclonal antibody (RRID: AB_11152455, #PA5-23077, Thermo Fisher Scientific) diluted 1:500 and 1:1000, respectively, in TBS/BSA 1%/Triton 0.05% at 4°C overnight. Then, they were incubated with anti-rabbit antibody conjugated to horseradish peroxidase (HRP) (Dako #K4003) at room temperature for 45 min and treated with chromogen 3,3′‐Diaminobenzidine (DAB) (Dako #K3468). Tissues were then counterstained with hematoxylin, dehydrated and mounted using Sakura Tissue-Tek Film. Whole tissue sections were digitalized at ×20 magnification using a Pannoramic Scan II slide scanner (3DHistech). Analyses were performed using QuPath (version 0.3.2),Citation91 quantifying the stained areas within the intestinal mucosal layer. Four to six colon sections per mouse were analyzed.
DNA extraction and 16S rRNA gene amplicon sequencing
Bacterial DNA was extracted from ca. 50 mg of fecal samples and 30–50 mg of cecal content using the Repeated Bead Beating (RBB) method for automated DNA purification.Citation92 200 µL of the clarified supernatant collected from the two bead beating rounds was used for DNA extraction with the Ambion Magmax™ −96 DNA Multi-Sample Kit (4413022, Thermo Fisher Scientific, USA) using the KingFisher™ Flex automated purification system (Thermo Fisher Scientific, USA). DNA was quantified using Quant-iT™ Pico Green dsDNA Assay (Invitrogen, San Diego, CA, USA). Library preparation and Illumina MiSeq sequencing of the hypervariable V3-V4 regions of the 16S rRNA gene were performed as previously described.Citation93
Sequences were processed using QIIME2 v.2020.11 pipeline.Citation94 Demultiplexed 250-bp paired-end sequences were denoised using DADA2 to obtain an amplicon sequence variant (ASV) table.Citation95 Singletons (ASV present <2 times) and ASVs present in less than 10% of the samples were discarded. Taxonomic classification was performed using a pre-trained naive Bayes classifier implemented in QIIME2 against the SILVA 132 reference database.Citation96 Taxa that could not be identified at genus-level are referred to as the highest taxonomic rank identified. Samples meeting quality criteria (107 out of 108) had a mean sequencing depth of 11952 reads.
Quantitative PCR for total bacteria
Quantification of total bacteria was carried out by qPCR with the 331 F/797 R primers (Nadkarni et al. DOI: 10.1099/00221287-148-1-257) using a BioRad iCycler iQ thermal cycler system (BioRad, Hercules, CA) with HOT FIREPol® EvaGreen® qPCR Mix Plus (Solis BioDyne, Tartu, Estonia) as described previously.Citation80 The 10-fold standard curves ranging from 102 to 107 copies were produced using full-length amplicons of 16S rRNA gene of Bifidobacterium longum to convert the threshold cycle (Ct) values into the average estimates of target bacterial genomes present in 1 g of feces (copy number/g of wet feces) in the assay. The qPCR assay was performed in triplicate. Precautions were taken to ensure that the data from each triplicate fell within 0.5 threshold cycle (Ct), and clear outliers (>2 standard deviations) were removed before calculating the average Ct of each sample. Melting curves and non-template controls were used to assess run reliability. There was no detectable amplification arising from non-template controls in the assay. The amplification efficiency of the qPCR assay was 95%. The absolute abundances were estimated and 16S rRNA gene copy-number corrected as previously described.Citation80
Plasma multiplex analysis
Plasma levels of glucagon-like peptide 1 (GLP-1) and interleukins 10 and 22 (IL-10, IL-22) were measured from the portal vein using multiplex assay kits based on chemiluminescence detection and following manufacturer’s instructions (Meso Scale Discovery (MSD), Gaithersburg, MD, USA). Analyses were performed using a QuickPlex SQ 120 instrument (MSD) and DISCOVERY WORKBENCH® 4.0 software (MSD, Rockville, MD, USA).
Statistical analysis
Statistical analyses were performed using GraphPad Prism version 9.3.1 for macOS (GraphPad Software, San Diego, CA, USA) and RStudio version 1.3.1093. Data are expressed as the mean ± s.e.m. Comparison between three groups at one time-point was performed by one-way ANOVA, and comparison between three groups at different time-points was performed by two-way repeated measures ANOVA, followed by Tukey’s test. The results were considered statistically significant at P < 0.05. The presence of outliers was assessed using the Grubbs test.
For the gut microbiota, statistical analysis was performed using the R package mare.Citation97 To account for the varying sequencing depth, the number of reads per sample was used as an offset in all statistical models. Microbiota richness and Shannon diversity index were estimated using the vegan package.Citation98 Overall microbiota structure was assessed using principal coordinate analysis (PCoA) on beta diversity computed using Bray-Curtis distances on relative abundance, representing the compositional dissimilarity between the samples. Permutational multivariate analysis of variance (PERMANOVA; adonis function in the vegan packageCitation98) with Bray-Curtis dissimilarities was used to identify factors contributing to variation in microbiota composition. Differential abundance for bacterial taxa between treatment groups was identified with the mare function “GroupTest”, both on relative and absolute abundance (based on generalized linear models using negative binomial distribution). The associations between absolute abundances of bacterial taxa and variables from the metabolism, gut barrier and mucus layer were examined by using negative binomial models implemented in the Mare function “CovariateTest”, on absolute abundance. If the fitted model failed to fulfil model assumptions (primarily heteroscedasticity of the residuals), generalized least-squares models were used. P-values were adjusted by the Benjamini–Hochberg method for multiple testing. FDR-adjusted p-values <0.05 were considered statistically significant.
Availability of data and materials
All data generated or analyzed during this study are included in this published article and its supplementary information files. The raw amplicon sequencing data analyzed in this study will be deposited in the European Nucleotide Archive (ENA) at EMBL-EBI under accession number PRJEB51476 (https://www.ebi.ac.uk/ena/browser/view/PRJEB51476).
Authors’ contributions
PP and PDC conceived and designed the study. PP performed the experiments and data analysis. PP, FS and MVH contributed to samples collection, experiments and data analysis. PP and PDC performed the interpretation. PP prepared the samples for sequencing. KP created the R package mare that we used for the statistical analysis and the associations. PP and CJ processed the sequences and performed the bioinformatics and statistical analysis for the gut microbiota. NMD, AS and PDC contributed to financial resources. PP and PDC wrote the first version of the paper. All authors critically revised the manuscript and approved the final version before submission.
Authors’ information
aMetabolism and Nutrition Research Group, Louvain Drug Research Institute, UCLouvain, Université catholique de Louvain, Av. E. Mounier, 73 B1.73.11, 1200 Brussels, Belgium; bWalloon Excellence in Life Sciences and BIOtechnology (WELBIO), WELBIO department, WEL Research Institute, avenue Pasteur, 6, 1300 Wavre, Belgium; cHuman Microbiome Research Program, Faculty of Medicine, University of Helsinki, Helsinki, Finland.
Supplemental Material
Download Zip (4.1 MB)Acknowledgments
We thank A. Puel, S. Genten, H. Danthinne, B. Es Saadi, L. Gesche and R. M. Goebbels (at UCLouvain, Université catholique de Louvain) for their excellent technical support and assistance. We thank C. Bouzin and A. Daumerie from the IREC imagery platform (2IP) from the Institut de Recherche Expérimentale et Clinique (IREC) for their excellent help. was created using BioRender.com.
Disclosure statement
PDC is inventor on patent applications dealing with the use bacteria on metabolic disorders. PDC was co-founders of The Akkermansia company SA and Enterosys. The other authors declare no conflict of interest.
Supplementary material
Supplemental data for this article can be accessed online at https://doi.org/10.1080/19490976.2022.2152307.
Correction Statement
This article has been corrected with minor changes. These changes do not impact the academic content of the article.
Additional information
Funding
References
- Organization WH. Obesity and Overweight. 2021.
- Cani PD, Van Hul M, Lefort C, Depommier C, Rastelli M, Everard A. Microbial regulation of organismal energy homeostasis. Nat Metab. 2019;1(1):34–24. doi:10.1038/s42255-018-0017-4.
- Cani PD. Human gut microbiome: hopes, threats and promises. Gut. 2018;67(9):1716–1725. doi:10.1136/gutjnl-2018-316723.
- de Vos WM, Tilg H, Van Hul M, Cani PD. Gut microbiome and health: mechanistic insights. Gut. 2022;71(5):1020–1032. doi:10.1136/gutjnl-2021-326789.
- Paone P, Cani PD. Mucus barrier, mucins and gut microbiota: the expected slimy partners? Gut. 2020;69(12):2232–2243. doi:10.1136/gutjnl-2020-322260.
- Johansson ME, Jakobsson HE, Holmen-Larsson J, Schutte A, Ermund A, Rodriguez-Pineiro AM, Arike L, Wising C, Svensson F, Bäckhed F, et al. Normalization of host intestinal mucus layers requires long-term microbial colonization. Cell Host Microbe. 2015;18(5):582–592. doi:10.1016/j.chom.2015.10.007.
- Chassaing B, Koren O, Goodrich JK, Poole AC, Srinivasan S, Ley RE, Gewirtz AT. Dietary emulsifiers impact the mouse gut microbiota promoting colitis and metabolic syndrome. Nature. 2015;519(7541):92–96. doi:10.1038/nature14232.
- Everard A, Belzer C, Geurts L, Ouwerkerk JP, Druart C, Bindels LB, et al. Cross-talk between Akkermansia muciniphila and intestinal epithelium controls diet-induced obesity. Proc Natl Acad Sci U S A. 2013;110(22):9066–9071. doi:10.1073/pnas.1219451110.
- Schroeder BO, Birchenough GMH, Stahlman M, Arike L, Johansson MEV, Hansson GC, et al. Bifidobacteria or fiber protects against diet-induced microbiota-mediated colonic mucus deterioration. Cell Host Microbe. 2018;23(1):27–40 e7. doi:10.1016/j.chom.2017.11.004.
- Desai MS, Seekatz AM, Koropatkin NM, Kamada N, Hickey CA, Wolter M, Pudlo NA, Kitamoto S, Terrapon N, Muller A, et al. A dietary fiber-deprived gut microbiota degrades the colonic mucus barrier and enhances pathogen susceptibility. Cell. 2016;167(5):1339–53 e21. doi:10.1016/j.cell.2016.10.043.
- Chassaing B, Raja SM, Lewis JD, Srinivasan S, Gewirtz AT. Colonic microbiota encroachment correlates with dysglycemia in humans. Cell Mol Gastroenterol Hepatol. 2017;4(2):205–221. doi:10.1016/j.jcmgh.2017.04.001.
- Cani PD, Dewever C, Delzenne NM. Inulin-type fructans modulate gastrointestinal peptides involved in appetite regulation (glucagon-like peptide-1 and ghrelin) in rats. Br J Nutr. 2004;92(3):521–526. doi:10.1079/BJN20041225.
- Cani PD, Daubioul CA, Reusens B, Remacle C, Catillon G, Delzenne NM. Involvement of endogenous glucagon-like peptide-1(7-36) amide on glycaemia-lowering effect of oligofructose in streptozotocin-treated rats. J Endocrinol. 2005;185(3):457–465. doi:10.1677/joe.1.06100.
- Cani PD, Joly E, Horsmans Y, Delzenne NM. Oligofructose promotes satiety in healthy human: a pilot study. Eur J Clin Nutr. 2006;60(5):567–572. doi:10.1038/sj.ejcn.1602350.
- Cani PD, Knauf C, Iglesias MA, Drucker DJ, Delzenne NM, Burcelin R. Improvement of glucose tolerance and hepatic insulin sensitivity by oligofructose requires a functional glucagon-like peptide 1 receptor. Diabetes. 2006;55(5):1484–1490. doi:10.2337/db05-1360.
- Cani PD, Neyrinck AM, Fava F, Knauf C, Burcelin RG, Tuohy KM, Gibson GR, Delzenne NM. Selective increases of bifidobacteria in gut microflora improve high-fat-diet-induced diabetes in mice through a mechanism associated with endotoxaemia. Diabetologia. 2007;50(11):2374–2383. doi:10.1007/s00125-007-0791-0.
- Delzenne NM, Cani PD, Neyrinck AM. Modulation of glucagon-like peptide 1 and energy metabolism by inulin and oligofructose: experimental data. J Nutr. 2007;137(11):2547S–51S. doi:10.1093/jn/137.11.2547S.
- Cani PD, Possemiers S, Van de Wiele T, Guiot Y, Everard A, Rottier O, Geurts L, Naslain D, Neyrinck A, Lambert DM, et al. Changes in gut microbiota control inflammation in obese mice through a mechanism involving GLP-2-driven improvement of gut permeability. Gut. 2009;58(8):1091–1103. doi:10.1136/gut.2008.165886.
- Everard A, Lazarevic V, Derrien M, Girard M, Muccioli GG, Neyrinck AM, Possemiers S, Van Holle A, François P, de Vos WM, et al. Responses of gut microbiota and glucose and lipid metabolism to prebiotics in genetic obese and diet-induced leptin-resistant mice. Diabetes. 2011;60(11):2775–2786. doi:10.2337/db11-0227.
- Van Hul M, Karnik K, Canene-Adams K, De Souza M, den Abbeele P V, Marzorati M, Delzenne NM, Everard A, Cani PD. Comparison of the effects of soluble corn fiber and fructooligosaccharides on metabolism, inflammation, and gut microbiome of high-fat diet-fed mice. Am J Physiol Endocrinol Metab. 2020;319(4):E779–E91. doi:10.1152/ajpendo.00108.2020.
- Cani PD, Lecourt E, Dewulf EM, Sohet FM, Pachikian BD, Naslain D, De Backer F, Neyrinck AM, Delzenne NM. Gut microbiota fermentation of prebiotics increases satietogenic and incretin gut peptide production with consequences for appetite sensation and glucose response after a meal. Am J Clin Nutr. 2009;90(5):1236–1243. doi:10.3945/ajcn.2009.28095.
- Dewulf EM, Cani PD, Claus SP, Fuentes S, Puylaert PG, Neyrinck AM, Bindels LB, de Vos WM, Gibson GR, Thissen J-P, et al. Insight into the prebiotic concept: lessons from an exploratory, double blind intervention study with inulin-type fructans in obese women. Gut. 2013;62(8):1112–1121. doi:10.1136/gutjnl-2012-303304.
- Hiel S, Bindels LB, Pachikian BD, Kalala G, Broers V, Zamariola G, Chang BPI, Kambashi B, Rodriguez J, Cani PD, et al. Effects of a diet based on inulin-rich vegetables on gut health and nutritional behavior in healthy humans. Am J Clin Nutr. 2019;109(6):1683–1695. doi:10.1093/ajcn/nqz001.
- Abot A, Wemelle E, Laurens C, Paquot A, Pomie N, Carper D, Bessac A, Mas Orea X, Fremez C, Fontanie M, et al. Identification of new enterosynes using prebiotics: roles of bioactive lipids and mu-opioid receptor signalling in humans and mice. Gut. 2021;70(6):1078–1087. doi:10.1136/gutjnl-2019-320230.
- Talukdar JR, Cooper MA, Lyutvyn L, Zeraatkar D, Ali R, Bierbrier R, Janes S, Ha V, Darling PB, Sievenpiper JL, et al. Effects of inulin-type fructans supplementation on cardiovascular disease risk factors: a protocol for a systematic review and meta-analysis of randomised controlled trials. BMJ Open. 2022;12(7):e058875. doi:10.1136/bmjopen-2021-058875.
- Hughes RL, Alvarado DA, Swanson KS, Holscher HD. The prebiotic potential of inulin-type fructans: a systematic review. Adv Nutr. 2021 Sep 23;23(2):492–529. doi:10.1093/advances/nmab119.
- Man S, Liu T, Yao Y, Lu Y, Ma L, Lu F. Friend or foe?The roles of inulin-type fructans. Carbohydr Polym. 2021;252:117155. doi:10.1016/j.carbpol.2020.117155.
- Vogt L, Meyer D, Pullens G, Faas M, Smelt M, Venema K, Ramasamy U, Schols HA, De Vos P. Immunological properties of inulin-type fructans. Crit Rev Food Sci Nutr. 2015;55(3):414–436. doi:10.1080/10408398.2012.656772.
- Winkler J, Butler R, Symonds E. Fructo-oligosaccharide reduces inflammation in a dextran sodium sulphate mouse model of colitis. Dig Dis Sci. 2007;52(1):52–58. doi:10.1007/s10620-006-9224-z.
- Cani PD, Neyrinck AM, Maton N, Delzenne NM. Oligofructose promotes satiety in rats fed a high-fat diet: involvement of glucagon-like Peptide-1. Obes Res. 2005;13(6):1000–1007. doi:10.1038/oby.2005.117.
- Delmee E, Cani PD, Gual G, Knauf C, Burcelin R, Maton N, Delzenne NM. Relation between colonic proglucagon expression and metabolic response to oligofructose in high fat diet-fed mice. Life Sci. 2006;79(10):1007–1013. doi:10.1016/j.lfs.2006.05.013.
- Cani PD, Hoste S, Guiot Y, Delzenne NM. Dietary non-digestible carbohydrates promote L-cell differentiation in the proximal colon of rats. Br J Nutr. 2007;98(1):32–37. doi:10.1017/S0007114507691648.
- Everard A, Lazarevic V, Gaia N, Johansson M, Stahlman M, Backhed F, Delzenne NM, Schrenzel J, François P, Cani PD, et al. Microbiome of prebiotic-treated mice reveals novel targets involved in host response during obesity. ISME J. 2014;8(10):2116–2130. doi:10.1038/ismej.2014.45.
- Park S-W, Zhen G, Verhaeghe C, Nakagami Y, Nguyenvu LT, Barczak AJ, Killeen AJ, Erle DJ. The protein disulfide isomerase AGR2 is essential for production of intestinal mucus Proc Natl Acad Sci U S A. 2009;106(17):6950–6955. doi:10.1073/pnas.0808722106.
- van Putten Jpm, Strijbis K, van Putten JPM. Transmembrane mucins: signaling receptors at the intersection of inflammation and cancer. J Innate Immun. 2017;9(3):281–299. doi:10.1159/000453594.
- Arike L, Holmén-Larsson J, Hansson GC. Intestinal Muc2 mucin O-glycosylation is affected by microbiota and regulated by differential expression of glycosyltranferases. Glycobiology. 2017;27(4):318–328. doi:10.1093/glycob/cww134.
- Cornick S, Tawiah A, Chadee K. Roles and regulation of the mucus barrier in the gut. Tissue Barriers. 2015;3(1–2):e982426. doi:10.4161/21688370.2014.982426.
- Wlodarska M, Thaiss CA, Nowarski R, Henao-Mejia J, Zhang JP, Brown EM, Frankel G, Levy M, Katz M, Philbrick W, et al. NLRP6 inflammasome orchestrates the colonic host-microbial interface by regulating goblet cell mucus secretion. Cell. 2014;156(5):1045–1059. doi:10.1016/j.cell.2014.01.026.
- Johansson ME, Thomsson KA, Hansson GC. Proteomic analyses of the two mucus layers of the colon barrier reveal that their main component, the Muc2 mucin, is strongly bound to the Fcgbp protein. J Proteome Res. 2009;8(7):3549–3557. doi:10.1021/pr9002504.
- Kim YS, Ho SB. Intestinal goblet cells and mucins in health and disease: recent insights and progress. Curr Gastroenterol Rep. 2010;12(5):319–330. doi:10.1007/s11894-010-0131-2.
- Jakobsson HE, Rodriguez-Pineiro AM, Schutte A, Ermund A, Boysen P, Bemark M, Sommer F, Bäckhed F, Hansson GC, Johansson ME, et al. The composition of the gut microbiota shapes the colon mucus barrier. EMBO Rep. 2015;16(2):164–177. doi:10.15252/embr.201439263.
- Delzenne NM, Neyrinck AM, Cani PD. Modulation of the gut microbiota by nutrients with prebiotic properties: consequences for host health in the context of obesity and metabolic syndrome. Microb Cell Fact. 2011;10 Suppl 1(Suppl 1):S10. doi:10.1186/1475-2859-10-S1-S10.
- Van Hul M, Cani PD. Targeting carbohydrates and polyphenols for a healthy microbiome and healthy weight. Curr Nutr Rep. 2019;8(4):307–316. doi:10.1007/s13668-019-00281-5.
- Qu D, Wang G, Yu L, Tian F, Chen W, Zhai Q. The effects of diet and gut microbiota on the regulation of intestinal mucin glycosylation. Carbohydr Polym. 2021;258:117651. doi:10.1016/j.carbpol.2021.117651.
- Zou J, Chassaing B, Singh V, Pellizzon M, Ricci M, Fythe MD, Kumar MV, Gewirtz AT. Fiber-mediated nourishment of gut microbiota protects against Diet-induced obesity by restoring IL-22-mediated colonic health. Cell Host Microbe. 2018;23(1):41–53 e4. doi:10.1016/j.chom.2017.11.003.
- Kleessen B, Hartmann L, Blaut M. Fructans in the diet cause alterations of intestinal mucosal architecture, released mucins and mucosa-associated bifidobacteria in gnotobiotic rats. Br J Nutr. 2003;89(5):597–606. doi:10.1079/BJN2002827.
- Ortega-Hernández A, Martínez-Martínez E, Gómez-Gordo R, López-Andrés N, Fernández-Celis A, Gutiérrrez-Miranda B, Nieto ML, Alarcón T, Alba C, Gómez-Garre D, et al. The interaction between mitochondrial oxidative stress and gut microbiota in the cardiometabolic consequences in diet-induced obese rats. Antioxidants (Basel). 2020;9(7): doi:10.3390/antiox9070640.
- Lee JC, Lee HY, Kim TK, Kim MS, Park YM, Kim J, Park K, Kweon M-N, Kim S-H, Bae J-W, et al. Obesogenic diet-induced gut barrier dysfunction and pathobiont expansion aggravate experimental colitis. PLoS One. 2017;12(11):e0187515. doi:10.1371/journal.pone.0187515.
- Gulhane M, Murray L, Lourie R, Tong H, Sheng YH, Wang R, Kang A, Schreiber V, Wong KY, Magor G, et al. High fat diets induce colonic epithelial cell stress and inflammation that is reversed by IL-22. Sci Rep. 2016;6(1):28990. doi:10.1038/srep28990.
- Benoit B, Laugerette F, Plaisancié P, Géloën A, Bodennec J, Estienne M, Pineau G, Bernalier-Donadille A, Vidal H, Michalski M-C, et al. Increasing fat content from 20 to 45 wt% in a complex diet induces lower endotoxemia in parallel with an increased number of intestinal goblet cells in mice. Nutr Res. 2015;35(4):346–356. doi:10.1016/j.nutres.2015.01.005.
- Das S, Rachagani S, Sheinin Y, Smith LM, Gurumurthy CB, Roy HK, Batra SK. Mice deficient in Muc4 are resistant to experimental colitis and colitis-associated colorectal cancer. Oncogene. 2016;35(20):2645–2654. doi:10.1038/onc.2015.327.
- Bafna S, Kaur S, Batra SK. Membrane-bound mucins: the mechanistic basis for alterations in the growth and survival of cancer cells. Oncogene. 2010;29(20):2893–2904. doi:10.1038/onc.2010.87.
- Kufe DW. Mucins in cancer: function, prognosis and therapy. Nat Rev Cancer. 2009;9(12):874–885. doi:10.1038/nrc2761.
- Hashemi Z, Fouhse J, Im HS, Chan CB, Willing BP. Dietary pea fiber supplementation improves glycemia and induces changes in the composition of gut microbiota, serum short chain fatty acid profile and expression of mucins in glucose intolerant rats. Nutrients. 2017;9(11):1236. doi:10.3390/nu9111236.
- Ma Y, Zhou G, Li Y, Zhu Y, Yu X, Zhao F, et al. Intake of Fish oil specifically modulates colonic Muc2 expression in middle-aged rats by suppressing the glycosylation process. Mol Nutr Food Res. 2018;62:(4):1700661. doi:10.1002/mnfr.201700661.
- Tardy F, Louisot P, Martin A. Effect of dietary fiber at weaning on protein glycosylation in the rat small intestine. Int J Biochem Cell Biol. 1995;27(4):403–413. doi:10.1016/1357-2725(95)00003-8.
- Mastrodonato M, Calamita G, Mentino D, Scillitani G. High-fat diet alters the glycosylation patterns of duodenal mucins in a murine model. J Histochem Cytochem. 2020;68(4):279–294. doi:10.1369/0022155420911930.
- Mastrodonato M, Mentino D, Portincasa P, Calamita G, Liquori GE, Ferri D. High-fat diet alters the oligosaccharide chains of colon mucins in mice. Histochem Cell Biol. 2014;142(4):449–459. doi:10.1007/s00418-014-1221-2.
- Gamage H, Chong RWW, Bucio-Noble D, Kautto L, Hardikar AA, Ball MS, Molloy MP, Packer NH, Paulsen IT. Changes in dietary fiber intake in mice reveal associations between colonic mucin O -glycosylation and specific gut bacteria. Gut Microbes. 2020;12(1):1802209. doi:10.1080/19490976.2020.1802209.
- Arike L, Hansson GC. The densely O-glycosylated MUC2 mucin protects the intestine and provides food for the commensal bacteria. J Mol Biol. 2016;428(16):3221–3229. doi:10.1016/j.jmb.2016.02.010.
- Larsson JM, Karlsson H, Crespo JG, Johansson ME, Eklund L, Sjövall H, Hansson GC. Altered O-glycosylation profile of MUC2 mucin occurs in active ulcerative colitis and is associated with increased inflammation. Inflamm Bowel Dis. 2011;17(11):2299–2307. doi:10.1002/ibd.21625.
- Jiang Y, Liu Z, Xu F, Dong X, Cheng Y, Hu Y, Gao T, Liu J, Yang L, Jia X, et al. Aberrant O-glycosylation contributes to tumorigenesis in human colorectal cancer. J Cell Mol Med. 2018;22(10):4875–4885. doi:10.1111/jcmm.13752.
- Pinho SS, Reis CA. Glycosylation in cancer: mechanisms and clinical implications. Nat Rev Cancer. 2015;15(9):540–555. doi:10.1038/nrc3982.
- Zhou R, Llorente C, Cao J, Zaramela LS, Zeng S, Gao B, Li S-Z, Welch RD, Huang F-Q, Qi L-W, et al. Intestinal α1-2-fucosylation contributes to obesity and steatohepatitis in mice. Cell Mol Gastroenterol Hepatol. 2021;12(1):293–320. doi:10.1016/j.jcmgh.2021.02.009.
- Maroni L, Hohenester SD, van de Graaf SFJ, Tolenaars D, van Lienden K, Verheij J, Marzioni M, Karlsen TH, Oude Elferink RPJ, Beuers U, et al. Knockout of the primary sclerosing cholangitis-risk gene Fut2 causes liver disease in mice. Hepatology. 2017;66(2):542–554. doi:10.1002/hep.29029.
- Kumar V, Kumar V, Mahajan N, Kaur J, Devi K, Dharavath RN, et al. Mucin secretory action of capsaicin prevents high fat diet-induced gut barrier dysfunction in C57BL/6 mice colon. Biomed Pharmacother. 2022;145:112452. doi:10.1016/j.biopha.2021.112452.
- Schroeder BO, Birchenough GMH, Pradhan M, Nystrom EEL, Henricsson M, Hansson GC, Bäckhed F. Obesity-associated microbiota contributes to mucus layer defects in genetically obese mice. J Biol Chem. 2020;295(46):15712–15726. doi:10.1074/jbc.RA120.015771.
- Nyström EEL, Birchenough GMH, van der Post S, Arike L, Gruber AD, Hansson GC, Johansson MEV. Calcium-activated chloride channel regulator 1 (CLCA1) controls mucus expansion in colon by proteolytic activity. EBioMedicine. 2018;33:134–143. doi:10.1016/j.ebiom.2018.05.031.
- Birchenough G, Schroeder BO, Backhed F, Hansson GC. Dietary destabilisation of the balance between the microbiota and the colonic mucus barrier. Gut Microbes. 2019;10(2):246–250. doi:10.1080/19490976.2018.1513765.
- Cani PD, Amar J, Iglesias MA, Poggi M, Knauf C, Bastelica D, Neyrinck AM, Fava F, Tuohy KM, Chabo C, et al. Metabolic endotoxemia initiates obesity and insulin resistance. Diabetes. 2007;56(7):1761–1772. doi:10.2337/db06-1491.
- Le Bourgot C, Apper E, Blat S, Respondek F. Fructo-oligosaccharides and glucose homeostasis: a systematic review and meta-analysis in animal models. Nutr Metab (Lond). 2018;15(1):9. doi:10.1186/s12986-018-0245-3.
- Parnell JA, Reimer RA. Weight loss during oligofructose supplementation is associated with decreased ghrelin and increased peptide YY in overweight and obese adults. Am J Clin Nutr. 2009;89(6):1751–1759. doi:10.3945/ajcn.2009.27465.
- Chambers ES, Byrne CS, Morrison DJ, Murphy KG, Preston T, Tedford C, Garcia-Perez I, Fountana S, Serrano-Contreras JI, Holmes E, et al. Dietary supplementation with inulin-propionate ester or inulin improves insulin sensitivity in adults with overweight and obesity with distinct effects on the gut microbiota, plasma metabolome and systemic inflammatory responses: a randomised cross-over trial. Gut. 2019;68(8):1430–1438. doi:10.1136/gutjnl-2019-318424.
- Chambers ES, Viardot A, Psichas A, Morrison DJ, Murphy KG, Zac-Varghese SE, MacDougall K, Preston T, Tedford C, Finlayson GS, et al. Effects of targeted delivery of propionate to the human colon on appetite regulation, body weight maintenance and adiposity in overweight adults. Gut. 2015;64(11):1744–1754. doi:10.1136/gutjnl-2014-307913.
- Rodriguez J, Hiel S, Neyrinck AM, Le Roy T, Potgens SA, Leyrolle Q, Pachikian BD, Gianfrancesco MA, Cani PD, Paquot N, et al. Discovery of the gut microbial signature driving the efficacy of prebiotic intervention in obese patients. Gut. 2020;69(11):1975–1987. doi:10.1136/gutjnl-2019-319726.
- Eiwegger T, Stahl B, Haidl P, Schmitt J, Boehm G, Dehlink E, Urbanek R, Szépfalusi Z. Prebiotic oligosaccharides: in vitro evidence for gastrointestinal epithelial transfer and immunomodulatory properties. Pediatr Allergy Immunol. 2010;21(8):1179–1188. doi:10.1111/j.1399-3038.2010.01062.x.
- Watzl B, Girrbach S, Roller M. Inulin, oligofructose and immunomodulation. Br J Nutr. 2005;93(1):S49–55. doi:10.1079/BJN20041357.
- Willemsen LE. Short chain fatty acids stimulate epithelial mucin 2 expression through differential effects on prostaglandin E1 and E2 production by intestinal myofibroblasts. Gut. 2003;52(10):1442–1447. doi:10.1136/gut.52.10.1442.
- Woo V, Alenghat T. Epigenetic regulation by gut microbiota. Gut Microbes. 2022;14(1):2022407. doi:10.1080/19490976.2021.2022407.
- Jian C, Luukkonen P, Yki-Järvinen H, Salonen A, Korpela K. Quantitative PCR provides a simple and accessible method for quantitative microbiota profiling. PLoS One. 2020;15(1):e0227285. doi:10.1371/journal.pone.0227285.
- Volk JK, Nyström EEL, van der Post S, Abad BM, Schroeder BO, Johansson Å, Svensson F, Jäverfelt S, Johansson MEV, Hansson GC, et al. The Nlrp6 inflammasome is not required for baseline colonic inner mucus layer formation or function. J Exp Med. 2019;216(11):2602–2618. doi:10.1084/jem.20190679.
- Tailford LE, Crost EH, Kavanaugh D, Juge N. Mucin glycan foraging in the human gut microbiome. Front Genet. 2015;6:81. doi:10.3389/fgene.2015.00081.
- van Muijlwijk Gh, van Mierlo G, Jansen P, Vermeulen M, Bleumink-Pluym NMC, Palm NW, van Muijlwijk GH, van Mierlo G, van Putten JPM, de Zoete MR. Identification of Allobaculum mucolyticum as a novel human intestinal mucin degrader. Gut Microbes. 2021;13(1):1966278. doi:10.1080/19490976.2021.1966278.
- Plovier H, Everard A, Druart C, Depommier C, Van Hul M, Geurts L, Chilloux J, Ottman N, Duparc T, Lichtenstein L, et al. A purified membrane protein from Akkermansia muciniphila or the pasteurized bacterium improves metabolism in obese and diabetic mice. Nat Med. 2017;23(1):107–113. doi:10.1038/nm.4236.
- Depommier C, Everard A, Druart C, Plovier H, Van Hul M, Vieira-Silva S, et al. Supplementation with Akkermansia muciniphila in overweight and obese human volunteers: a proof-of-concept exploratory study. Nat Med. 2019;25(7):1096–1103. doi:10.1038/s41591-019-0495-2.
- Cani PD, Depommier C, Derrien M, Everard A, de Vos WM. Akkermansia muciniphila: paradigm for next-generation beneficial microorganisms. Nat Rev Gastroenterol Hepatol. 2022;19(10):625–637. doi:10.1038/s41575-022-00631-9.
- Mack DR, Michail S, Wei S, McDougall L, Hollingsworth MA. Probiotics inhibit enteropathogenic E. coli adherence in vitro by inducing intestinal mucin gene expression. Am J Physiol. 1999;276(4):G941–50. doi:10.1152/ajpgi.1999.276.4.G941.
- Ahl D, Liu H, Schreiber O, Roos S, Phillipson M, Holm L. Lactobacillus reuteri increases mucus thickness and ameliorates dextran sulphate sodium-induced colitis in mice. Acta Physiol (Oxf). 2016;217(4):300–310. doi:10.1111/apha.12695.
- Rastelli M, Cani PD, Knauf C. The gut microbiome influences host endocrine functions. Endocr Rev. 2019;40(5):1271–1284. doi:10.1210/er.2018-00280.
- Everard A, Cani PD. Gut microbiota and GLP-1. Rev Endocr Metab Disord. 2014;15(3):189–196. doi:10.1007/s11154-014-9288-6.
- Bankhead P, Loughrey MB, Fernandez JA, Dombrowski Y, McArt DG, Dunne PD, et al. QuPath: open source software for digital pathology image analysis. Sci Rep. 2017;7(1):16878. doi:10.1038/s41598-017-17204-5.
- Salonen A, Nikkilä J, Jalanka-Tuovinen J, Immonen O, Rajilić-Stojanović M, Kekkonen RA, et al. Comparative analysis of fecal DNA extraction methods with phylogenetic microarray: effective recovery of bacterial and archaeal DNA using mechanical cell lysis. J Microbiol Methods. 2010;81(2):127–134. doi:10.1016/j.mimet.2010.02.007.
- Korpela K, Salonen A, Saxen H, Nikkonen A, Peltola V, Jaakkola T, de Vos W, Kolho K-L. Antibiotics in early life associate with specific gut microbiota signatures in a prospective longitudinal infant cohort. Pediatr Res. 2020;88(3):438–443. doi:10.1038/s41390-020-0761-5.
- Bolyen E, Rideout JR, Dillon MR, Bokulich NA, Abnet CC, Al-Ghalith GA, et al. Reproducible, interactive, scalable and extensible microbiome data science using QIIME 2. Nat Biotechnol. 2019;37(8):852–857. doi:10.1038/s41587-019-0209-9.
- Callahan BJ, McMurdie PJ, Rosen MJ, Han AW, Johnson AJ, Holmes SP. DADA2: high-resolution sample inference from Illumina amplicon data. Nat Methods. 2016;13:581–583.
- Quast C, Pruesse E, Yilmaz P, Gerken J, Schweer T, Yarza P, Peplies J, Glöckner FO. The SILVA ribosomal RNA gene database project: improved data processing and web-based tools. Nucleic Acids Res. 2013;41(D1):D590–6. doi:10.1093/nar/gks1219.
- Korpela K. mare: microbiota analysis in R easily. R package version 1.0.
- Jari Oksanen FGB, Friendly M, Kindt R, Legendre P, McGlinn D, Minchin PR, O’Hara RB, Simpson GL, Peter Solymos MHHS, Szoecs E, et al., https://CRAN.R-project.org/package=vegan, (accessed 14 June 2021).