
ABSTRACT
The impact of carbohydrate quality, measured by the carbohydrate quality index (CQI), on gut microbiota and health has been scarcely investigated. The aim of this study was to cross-sectionally and longitudinally explore the relationships between CQI, fecal microbiota, and cardiometabolic risk factors in an elderly Mediterranean population at high cardiovascular risk. At baseline and 1-year, CQI was assessed from food frequency questionnaires data, cardiometabolic risk factors were measured, and fecal microbiota profiled from 16S sequencing. Multivariable-adjusted linear regression models were fitted to assess the associations between tertiles of baseline CQI, fecal microbiota, and cardiometabolic risk factors at baseline, and between tertiles of 1-year change in CQI, 1-year change in fecal microbiota and cardiometabolic risk factors. Cross-sectionally, higher CQI was positively associated with Shannon alpha diversity index, and abundance of genera Faecalibacterium and Christensenellaceae R7 group, and negatively associated with the abundance of Odoribacter, and uncultured Rhodospirillales genera. Some of these genera were associated with higher glycated hemoglobin and lower body mass index. In addition, we observed a positive association between CQI, and some pathways related with the metabolism of butyrate precursors and plants-origin molecules. Longitudinally, 1-year improvement in CQI was associated with a concurrent increase in the abundance of genera Butyrivibrio. Increased abundance of this genera was associated with 1-year improvement in insulin status. These observations suggest that a better quality of carbohydrate intake is associated with improved metabolic health, and this improvement could be modulated by greater alpha diversity and abundance of specific genera linked to beneficial metabolic outcomes.
Introduction
Carbohydrates are a relevant component of the diet, providing an important source of energy for the body.Citation1 They have complex chemical structures that constitute a rich physiological function of the living system. Globally, there are recommended daily amounts for carbohydrate intake, generally ranging from 45 to 65% of total energyCitation2 and worldwide intakes generally align with these recommendations.Citation1 While historically the amount of carbohydrate consumption has been the focus of research and guidelines, not all carbohydrates are equal in terms of their impact on human health. Therefore, carbohydrate quality has been emerging over the past decades as an important factor to consider in dietary recommendations.Citation3–6 As carbohydrate quality is multidimensional, a carbohydrate quality index (CQI) has been defined integrating four parameters into a single score including the ratio of solid carbohydrates to total carbohydrates, dietary fiber, glycemic index, and the ratio of whole grains to total grains.Citation7 This CQI has been suggested as a useful tool in evaluating the micronutrient adequacy of the diet.Citation3,Citation7 Further, a higher CQI has been associated with a lower risk of cardiovascular disease (CVD),Citation7 obesity,Citation4 and hypertension,Citation8 along with reductions in cardiometabolic risk factors.Citation9
In recent years, research has highlighted the importance of carbohydrate intake in relation to the composition and function of the human gut microbiota.Citation10 Gut microbiota has been increasingly recognized as an important factor in a myriad of health functions, including a range of physiologic processes that are fundamental to host well-being, such as energy homeostasis, glucose and fat metabolism, immunological activity, and neurobehavioral development.Citation11,Citation12
Despite the composition of the gut microbiota tending to be established by the age of 3–6 years and remaining highly stable through time, it may still be largely influenced by environmental and lifestyle factors throughout the lifespan, including in older age.Citation13 In addition to age, health status has also been implicated in impacting the gut microbial composition of the host. Specifically, obesity or diabetes has been associated with lower diversity and richness of the gut microbiota.Citation14,Citation15 Hence understanding the influence of dietary intake, especially carbohydrate quality, on gut microbiota and cardiovascular risk in individuals with overweight or obesity in diverse populations remains of importance.
While the CQI brings together several dimensions of dietary carbohydrate quality and may be an effective tool for nutrition counseling, very few studies have examined its relationship with gut microbiota. Furthermore, evidence supports the impact of the gut microbiota as an environmental factor related to the progress of obesity and metabolic disturbances, even though the causal nature of this has not been completely understood.Citation16
Given the current scarcity of literature describing the association between the quality of carbohydrate intake, gut microbiota, and clinical cardiometabolic variables, the aim of the present study was to cross-sectionally and longitudinally assess the associations between CQI, fecal microbiota, and cardiometabolic risk factors in a cohort of older adults with overweight/obesity and metabolic syndrome from a Mediterranean population.
Results
Characteristics of the study population
A total of 656 PREDIMED (PREvención con DIeta MEDiterránea)-Plus participants, with available 16S data at baseline and 1-year timepoints were included in the present study. After conducting quality filtering steps on 16S data, and after removing participants exposed to prior antibiotic treatment, the total number of matching participants was further reduced to 641. Finally, after excluding participants with total calorie intake outside the pre-specified energy limits, 617 participants were retained for the cross-sectional and longitudinal analyses.
The characteristics of the study population according to tertiles of baseline CQI are described in . Individuals distributed in the lowest tertile (T1) presented a CQI of 7.7 ± 1.3, whereas individuals distributed in highest tertile (T3) presented a CQI of 15.6 ± 1.3. The percentage of women was lower in T1 (37%) compared to T3 (56%). In addition, there were significant differences in the number of individuals distributed in the different recruiting centers across tertiles (p < 0.001). Individuals distributed in T1 presented with a higher waist circumference compared to those individuals distributed in T3 (109.1 ± 9.4 versus 106.1 ± 9.6 cm). In addition, low-density lipoprotein (LDL) cholesterol was lower in T1 (117.1 ± 31.3 mg/dL) compared to T3 (125.3 ± 32.1 mg/dL). Individuals distributed in T1 showed lower adherence to Mediterranean diet (MedDiet) compared to those individuals distributed in T2 and T3 (7.2 ± 2.1 versus 8.3 ± 2.5 and 9.3 ± 2.5, respectively). In addition, individuals distributed in T1 did less physical activity compared with those distributed in T3. Individuals distributed in T1 showed higher intake of carbohydrates (255.5 ± 61.6 g/day) compared to those distributed in T3 (238.6 ± 57.4 g/day), whereas regarding CQI components, individuals distributed in T1 consumed lower fiber compared to those distributed in T2 and T3 (22.6 ± 5.9 versus 26.0 ± 6.8 and 33.3 ± 8.3 g/day, respectively) and presented with higher glycemic index compared to those distributed in T2 and T3 (57.3 ± 3.5 versus 53.6 ± 4.7 and 52.3 ± 4.6, respectively). The ratio of whole grains to total grains was lower in individuals distributed in T1 (0.04 ± 0.1) compared to those distributed in T2 (0.2 ± 0.2) and T3 (0.5 ± 0.3) as well as the ratio of solid carbohydrate to solid + liquid carbohydrate.
Table 1. Characteristics of the study population according to tertiles (T) of baseline CQI.
The characteristics of the study population according to tertiles of 1-year change in CQI are described in . Individuals distributed in T1 showed a reduction in CQI (−4.0 ± 2.0) whereas individuals distributed in T3 showed an increase in CQI (4.7 ± 2.1) after 1-year of lifestyle intervention. The percentage of individuals distributed in the intervention group was lower in T1 (30%) compared to T2 (48%) and T3 (75%). In addition, there were significant differences in the number of individuals distributed in the different recruiting centers across tertiles (p = 0.046). After 12 months of lifestyle intervention, individuals distributed in T1 showed a lower decrease in body weight compared to those individuals distributed in T2 and T3 (−1.3 ± 3.3 versus −2.4 ± 3.9 and − 4.6 ± 4.0 kg, respectively), a lower decrease in waist circumference compared to those distributed in T2 and T3 (−1.7 ± 4.9 versus −2.9 ± 4.9 and − 5.4 ± 6.0 cm, respectively), and a lower decrease in body mass index (BMI) compared to those distributed in T2 and T3 (−0.5 ± 1.2 versus −0.9 ± 1.5 and − 1.7 ± 1.5 kg/m2, respectively). A lower decrease in plasma levels of triglycerides after 1-year of lifestyle intervention was observed in the individuals distributed in T1 (−3.5 ± 76.6 mg/dL) compared to those distributed in T3 (−20.0 ± 88.6 mg/dL), as well as a lower decrease in the percentage of glycated hemoglobin (HbA1c) was observed in individuals belonging to T1 (−0.001 ± 0.6%) compared to T3 (−0.2 ± 0.4%). The increase in the adherence to MedDiet score after 1-year of lifestyle intervention was lower in those individuals distributed in T1 (2.2 ± 2.8) compared to those individuals distributed in T2 (3.9 ± 3.2) and T3 (5.8 ± 3.2). In addition, the increase in physical activity was lower in individuals distributed in T1 compared to those distributed in T2 and T3. Individuals distributed in T1 showed a lower decrease in carbohydrate intake after 1-year of follow up (−28.7 ± 68.5 g/day) compared to those individuals distributed in T3 (−45.0 ± 68.8 g/day), whereas regarding the change in individual CQI components following the 1-year lifestyle intervention, fiber intake decreased in individuals distributed in T1 (−2.7 ± 7.6 g/day) and increased in those distributed in T2 (3.1 ± 7.4 g/day) and T3 (10.2 ± 6.7 g/day), as well as the ratio of whole grains to total grains and the ratio of solid carbohydrate to solid + liquid carbohydrate. In addition, glycemic index increased (p < 0.001) in T1 (1.0 ± 4.4) and decreased in T2 (−1.3 ± 4.9) and T3 (−4.7 ± 4.8) after 1-year of lifestyle intervention.
Table 2. Characteristics of the study population according to tertiles (T) of CQI 1-year change.
Fecal microbiota alpha and beta diversity profiles associated with carbohydrate quality
A significant positive association between Shannon index and T3 compared to T1 of baseline CQI was observed (p = 0.045). No significant association was observed between Chao1 index and T3 compared to T1 of baseline CQI, whereas Simpson index shown a p-value trend slightly close to significance (p = 0.058) (). No significant associations between 1-year change in alpha diversity indices Chao1, Shannon and Simpson and tertiles of 1-year change in CQI were observed (Figure S1).
Figure 1. Boxplots representing the differences in alpha diversity indices Chao1, Shannon, and Simpson across tertiles (T) of baseline CQI. Linear regression was used to test the cross-sectional association between tertiles of baseline CQI and selected indices. Models were adjusted for recruiting center (Alicante, Barcelona, Reus, Valencia), smoking status (former smoker, never smoked, smoker), diabetes status, sex, age categories (below the median, < 65 years old; above the median, > 65 years old). T1 set as reference, p < 0.05 deemed as significant.
Principal components calculated over baseline centered log-ratio (clr) transformed taxonomic feature counts showed that PC1 and PC2 accounted for approximately 10.2% and 8.1% to the total variation, respectively. Principal component analysis (PCA) plot showed that the fecal microbiota samples did not cluster based on tertiles of baseline CQI (Figure S2). Principal components calculated over baseline and 1-year clr-transformed taxonomic feature counts shown that PC1 and PC2 account approximately 9.9% and 7.9% to the total variation, respectively. PCA plot showed that the fecal microbiota samples did not cluster based on tertiles of 1-year change in CQI (Figure S3).
The results of the permutational multivariate analysis of variance (PERMANOVA) test based on Aitchison distance did not show statistically significant differences across tertiles of baseline CQI (table S1), nor across tertiles of 1-year change in CQI (table S2).
Taxonomic features and metabolic pathways associated with carbohydrate quality
Cross-sectionally, the multivariable associations between the highest tertile of baseline CQI (T3), compared to the lowest tertile (T1) as reference category, and baseline abundance of taxonomic features at genus level, showed a negative association between T3 and Odoribacter (FDR = 0.008), and T3 and uncultured Rhodospirillales genera (FDR = 0.036). A positive association was observed between T3 and Faecalibacterium (FDR = 0.097), and T3 and Christensenellaceae R7 group (FDR = 0.097) (). In addition, we observed a positive association between T3, and metabolic pathways related to peptidoglycan biosynthesis IV (PWY-6471) (FDR = 0.006), CMP-legionaminate biosynthesis I (PWY-6749) (FDR = 0.007), pyruvate fermentation to butanoate (CENTFERM-PWY) (FDR = 0.011), superpathway of Clostridium acetobutylicum acidogenic fermentation (PWY-6590) (FDR = 0.011), nitrate reduction VI (PWY490–3) (FDR = 0.034), β-(1,4)-mannan degradation (PWY-7456) (FDR = 0.041), glutaryl-CoA degradation (PWY-5177) (FDR = 0.042) ().
Table 3. Fecal microbiota genera associated with the highest tertile (T3) of baseline CQI.
Table 4. Metabolic pathways associated with the highest tertile (T3) of baseline CQI.
Longitudinally, the multivariable associations between the highest tertile (T3) of 1-year change in CQI, compared to the lowest tertile (T1) as the reference category, and 1-year change in the abundance of taxonomic features at genus level showed a negative association between T3 and Monoglobus (FDR = 0.065), and a positive association between T3 and Butyrivibrio (FDR = 0.065) (). No association was observed between metabolic pathways and T3.
Table 5. Fecal microbiota genera associated with the highest tertile (T3) of CQI 1-year change.
CQI-related genera associated with cardiovascular risk factors
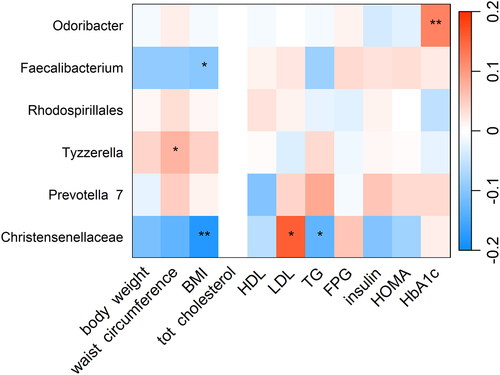
Among baseline CQI related genera, we observed a positive association between Odoribacter and glycated hemoglobin, whereas Faecalibacterium and Christensenellaceae R7 group were negatively associated with BMI. In addition, Christensenellaceae R7 group was negatively associated with triglycerides and positively associated with LDL cholesterol ().
Figure 2. Heatmap showing the cross-sectional association between CQI-related genera and cardiovascular risk factors. Association tested by linear regression adjusted for recruiting center (Alicante, Barcelona, Reus, Valencia), smoking status (former smoker, never smoked, smoker), diabetes status, sex, age categories (below the median, < 65 years old; above the median, > 65 years old). For each cell, colors indicate the association coefficient with cardiovascular risk factors and asterisks denote significance. *p < 0.05; **p < 0.01. TG, triglycerides FPG, fasting plasma glucose; HDL, high-density lipoprotein; LDL, low-density lipoprotein; HOMA, homeostasis model assessment; HbA1c, glycated hemoglobin.
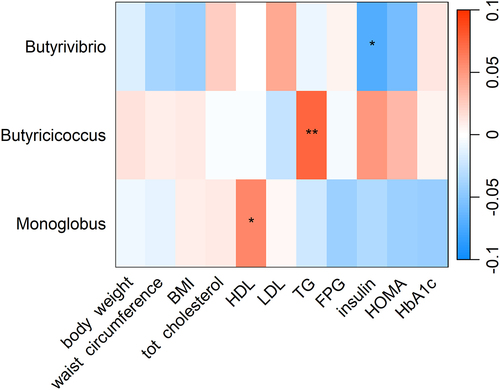
Among CQI 1-year change related genera, we observed a negative association between 1-year change in Butyrivibrio abundance and 1-year change in insulin, and a positive association between 1-year change in Monoglobus abundance and 1-year change in high-density lipoprotein (HDL) cholesterol ().
Figure 3. Heatmap showing the longitudinal association between 1-year change CQI-related genera and 1-year change in cardiovascular risk factors. Association tested with linear mixed model and adjusted for intervention group, timepoint, recruiting center (Alicante, Barcelona, Reus, Valencia), smoking status (former smoker, never smoked, smoker), diabetes status, sex, age categories (below the median, < 65 years old; above the median, > 65 years old). Participant ID was set as random effect. For each cell, colors indicate the association coefficient with cardiovascular risk factors and asterisks denote significance. *p < 0.05; **p < 0.01. TG, triglycerides FPG, fasting plasma glucose; HDL, high-density lipoprotein; LDL, low-density lipoprotein; HOMA, homeostasis model assessment; HbA1c, glycated hemoglobin.
Discussion
To our knowledge, this is the first study analyzing the relationship between CQI and fecal microbiota in Mediterranean population of elderly adults at high cardiovascular risk. Findings suggest that a higher quality of carbohydrate intake is associated with increased alpha diversity and abundance of specific genera, and part of this fecal microbial profile are related to better cardiometabolic health in older Spanish adults with overweight or obesity and metabolic syndrome.
The observed beneficial associations between CQI and cardiometabolic health align with previous evidence showing the consumption of carbohydrates based on individual quality traits, in particular higher intakes of total dietary fiber and whole grains, has a positive impact on population health outcomes, including mortalityCitation5. While the underlying mechanisms responsible for these observations remained incompletely understood, one possible explanation, as demonstrated by the present findings, may be modification of host gut microbiota. This connection is suggested in the present study, as higher CQI was related to better cardiometabolic health, based on associations with assessed clinical risk factors, as well as fecal microbiota. Specifically, in the present study, those individuals with higher CQI had lower waist circumference, and having a higher CQI was observed to be negatively associated with the abundance of members belonging to the Bacteroidetes and Proteobacteria phyla (i.e., Odoribacter, and Rhodospirillales uncultured genus) and positively associated with genera in the Firmicutes phylum (i.e., Faecalibacterium and Christensenellaceae R7 group). Where, lower abundance of Odoribacter was associated with lower glycated hemoglobin, and higher abundance of Faecalibacterium and Christensenellaceae R7 group were related to lower BMI levels. In addition, we observed that higher baseline CQI was positively associated with some pathways related with the metabolism of butyrate precursors (CENTFERM-PWI, PWI-6590) and plants-origin molecules (PWI490–3, PWI-7456).
Bacteroidetes (Gram-negative) and Firmicutes (Gram-positive) are generally the dominant phyla within the gut, with other phyla often comprising 10% or less of the gut microbiota, and largely occupy different functional niches in the gut ecosystem.Citation17 As a result, differences between individuals in their relative proportion can lead to large differences in function, with relevance for host health.Citation18 Members of the Bacteroidetes phylum have been associated with metabolic diseases.Citation18 While there is substantial diversity among members of the Bacteroidetes phylum, they share certain attributes, for instance their superlative ability to utilize polysaccharides, and compared to bacteria of other phyla, Bacteroidetes members encode a proportionally high number of carbohydrate-active enzymes that enable use of both dietary and host mucosal glycans.Citation18 Interestingly, the Bacteroidetes genus Odoribacter has also been linked to metabolic health benefits based on previous studies on metabolism-related pathologies, such as obesity, metabolic syndrome, and diabetes.Citation19–23 However, the role of Odoribacter abundance in metabolic disorders has been inconsistent. Notably, Odoribacter has previously been shown in an older diabetes-free Spanish population to be negatively associated with homeostasis model assessment (HOMA) of insulin resistance.Citation24 Yet, the present findings do not corroborate this as higher carbohydrate quality intakes were associated with lower amounts of Odoribacter, furthermore reduced abundance of Odoribacter was related to elevated glycated hemoglobin. However, it is unclear whether these associations are successive or possibly due to the nature of the study population having overweight or obesity and metabolic syndrome as it is known that these disease states alter the microbiota profile of the gut. As such, reverse causation may play a role in these observations as individuals with higher glycated hemoglobin levels, greater risk of type 2 diabetes, and/or overweight or obesity may initiate a dietary pattern with higher carbohydrate quality.
Recently, in the Firmicutes phylum, the family Christensenellaceae has emerged as an important player in human health where the abundance in the human gut has been inversely related to host BMI in different populations.Citation25,Citation26 While evidence is limited, a positive relationship has previously been observed between adherence to a MedDiet characterized by a high consumption of fiber-rich foods, and Christensenellaceae.Citation27 Similarly, the present study found CQI to be associated with higher levels of Christensenellaceae R7 group and substantiates previous findings with leanness, as indicated by the inverse relationship observed with BMI.
Mechanistically, complex carbohydrates have been shown to shape the composition of the gut microbiome by providing a nutrient source for particular microbes, resulting in their degradation and fermentation in the large intestine.Citation28 This fermentation of complex carbohydrates can also impact gut health through produced metabolites.Citation28 Among these bacteria-derived metabolites, short chain fatty acids (SCFAs), namely acetate, propionate, and especially butyrate, have been linked to a broad range of health promoting activities, including energy homeostasis, hypocholesterolemia, anti-inflammatory, anti-obesity, anti-angiogenesis, and antioxidant.Citation29,Citation30 A MedDiet, characterized by a high consumption of fiber-rich food, has previously been correlated with higher levels of SCFAs and SCFA-producing bacteria.Citation27 Similarly, the present study we observed relationships between CQI and the butyrate-producing microbiota genera Faecalibacterium, and Butyrivibrio. The connection between higher CQI and the abundance of Faecalibacterium coupled with the lower BMI aligns with previous findings.Citation31 Accordingly, we also observed that higher carbohydrate quality was positively associated with metabolic pathways related with SCFA production and molecules from plant-origin, highlighting the potential role that MedDiet, and higher adherence to this dietary pattern, has on improving carbohydrate quality intake and consequent potential beneficial cardiometabolic outcomes mediated by the gut microbiota. Over the 1-year period, increasing CQI by almost 5 points compared to a decrease of 4 points was positively associated with Butyrivibrio genus abundance. Examination of the diversity within the Firmicutes reveals a vast diversity in genomes and capacities, which may partly explain differing responses even in equivalent or comparable environmental conditions in their hosts. Nonetheless, the present observed changes in CQI were related to improvements in cardiometabolic risk factors, specifically greater weight loss and decreased waist circumference, BMI, and glycated hemoglobin, which align with common findings seen with butyrate-production and presence.Citation30,Citation32
Limitations of the present study should be acknowledged. First, given the observational nature of the study design causality cannot be ascertained. Second, given the study participants are older men and women with overweight/obesity and metabolic syndrome from a Mediterranean country, they are not necessarily representative of the general population. However, populations at high risk of cardiometabolic diseases represent an important proportion of the globe and hence findings of the present study may be generalizable to those community-dwelling older adults who may highly benefit from approaches to support good health. Furthermore, the homogeneity among participants reduces the likelihood of misclassification bias, reduces potential confounding, and increases internal validity. Third, CQI was determined based on self-reported data collected from a semiquantitative food frequency questionnaire (FFQ), which may be subject to some degree of measurement error. However, use of a FFQ is considered an appropriate approach to assess food and nutrient intake in large cohorts and moreover, the FFQ used in this adult cohort, has been repeatedly validated and widely used.Citation33,Citation34 Fourth, methodologically, the use of 16S sequencing provides relative rather than absolute quantitative results and generally limits the taxonomic profiling to genus-level resolution as the primers used for amplification bind to regions that may not be completely conserved across all bacteria, hence it typically does not allow for differentiation between closely related bacteria at the species level.Citation35 This lack of data on species-level taxonomy does not allow for further inference of the pathways associated with relationships observed. Nonetheless, 16S sequencing does allow for the feasibility of analyzing a large number of samples and databases are established and well-curated, whereas those for more advanced and expensive techniques (i.e., shotgun metagenomic sequencing) are relatively new and still developing.Citation36,Citation37 Further, it has been shown that 16S rRNA data can yield accurate disease prediction results in comparison to shotgun data.Citation37 Lastly, as in any observational study, some residual confounding might not have been completely excluded. Yet, analyses were adjusted for major potential confounders. For this reason, residual confounding is not considered to be a likely important cause of the observed findings.
Despite these limitations, this study has several strengths. One key strength of this study is that, to the authors’ knowledge, this is the first study to examine the relationship between quality of carbohydrate consumption (CQI) and gut microbiota in subjects at high CVD risk, which may be used as a foundation for future studies and informing practice in this field. Utilization of a multidimensional CQI that has the possibility of dynamically capturing changes in risk factors provides a more comprehensive approach compared to a unidimensional assessment of carbohydrate quality. Additionally, the relatively large cohort sample size, the prospective analysis with a year-long follow-up period, use of validated questionnaires and methods, and the use of multivariable analyses, adjusted for relevant confounders to minimize the possibility of reverse causality bias add to the robustness of the present findings.
Patients and methods
Study design and population
This study integrates a cross-sectional and longitudinal analysis of baseline and 1-year timepoint data from a cohort of participants within the framework of the PREDIMED-Plus lifestyle intervention study. This trial aims to assess the long-term effects of an intensive weight loss lifestyle intervention based on an energy-restricted MedDiet, physical activity promotion, and behavioral support (intervention group), versus a control group following an ad libitum MedDiet without any advice to increase physical activity.Citation38 The trial was registered at the International Standard Randomized Controlled Trial (Number: ISRCTN89898870 -date of registration: 2014) and approved by the research ethics committees of all participating institutions. A detailed protocol is available on the website http://www.predimedplus.com/. Eligible participants were men and women (aged 55–75 years), without documented history of CVD at enrollment, with overweight/obesity (BMI ≥25 and <40 kg/m2) and who met at baseline at least three components of the metabolic syndrome.
The present study encompasses a subsample of participants from the PREDIMED-Plus recruiting centers of Reus, Barcelona (Institut Hospital del Mar d’Investigacions Mèdiques, IMIM), Alicante, and Valencia, not exposed to antibiotic treatment prior to stool sample collection and with available fecal microbiota 16S data at both timepoints after quality filtering steps. Participants who did not complete the FFQ at baseline and after 1-year of follow-up or with total calorie intake outside the pre-specified energy limits (women <500 and > 3,500 kcal/day, and men < 800 and > 4,000 kcal/day) were excluded from the analyses.Citation39
General assessments, anthropometric and blood biochemical measurements
A general questionnaire was administered to collect data on socio-demographics and medical conditions. Leisure time physical activity was measured by the validated Regicor Short Physical Activity Questionnaire.Citation40 Waist circumference was measured midway between the lowest rib and the iliac crest using an anthropometric tape, body weight was measured twice using high-quality electronic calibrated scales and height was measured twice using a wall-mounted stadiometer. Blood pressure was measured in triplicate using a validated semiautomatic oscillometer (Omron HEM-705CP, Kyoto, Japan). The mean of anthropometric and blood pressure measurements was used for the analyses.
Blood samples were collected after an overnight fast, aliquoted, and stored at − 80°C until further analyses. Circulating levels of glucose, total cholesterol, HDL cholesterol and triglycerides were measured using standard enzymatic methods. LDL cholesterol was calculated with the Friedewald formula (whenever triglycerides were <300 mg/dL). Insulin was centrally measured by an electrochemiluminescence immunoassay using an Elecsys immunoanalyzer (Roche Diagnostics, Meylan, France). Insulin resistance was estimated at baseline using the HOMA index.Citation41
Dietary assessment and carbohydrate quality index
Dietary intake was assessed using the Spanish version of the validated 143-item semiquantitative FFQ,Citation34 administered by trained dietitians during face-to-face visits at baseline and at 1-year follow-up. Participants reported their average frequency and quantity of foods consumed during the previous year. The intake of each item was calculated by multiplying a typical portion size by frequency of consumption (9 possible responses ranging from never to > 6 times/day). Spanish food composition tablesCitation42 were used to derive nutrient (sodium, saturated and trans fatty acids), fiber, alcohol (g/day), and total energy intake (kcal/day), as well as determine consumption of specific food groups, such as fruits and vegetables (g/day). Glycemic index and load were determined using International tables.Citation43 Overall adherence to the MedDiet was assessed using a validated 17-point scale.Citation44
CQI was calculated from dietary intake information obtained from the semiquantitative FFQs.Citation9 Specifically, this index was constructed based on 4 items: (i) total dietary fiber intake (g/d); (ii) glycemic index 24; (iii) whole-grain/total grain ratio, and (iv) solid carbohydrate/total carbohydrate ratio. Total grains were estimated including whole grains, refined grains, and their derived products. Liquid carbohydrate intake was estimated as sugar-sweetened beverages and fruit juice consumption, while solid carbohydrate intake included the rest of the carbohydrates contained in solid foods.
To determine the CQI, participants were stratified into quintiles for each of the CQI components, and values ranging from 1 point for the first quintile to 5 points for the fifth quintile were assigned, except for the glycemic index component, which was inversely weighted (1 point for the fifth quintile and 5 points for the first quintile). All values were then added to calculate the CQI (score index ranging from 4 to 20), with higher values representing better carbohydrate quality.Citation9 CQI was used to categorize the study population cross-sectionally, according to tertiles of baseline CQI, and longitudinally according to tertiles of 1-year change (deltas) in CQI.
Stool samples collection, DNA extraction and 16S amplicon sequencing
Steps regarding stool samples collection, storage, and processing; microbial DNA extraction from feces; amplicon libraries preparation; 16S sequencing procedure; pipeline utilized to obtain the final data; are detailed described elsewhere.Citation45
Statistical analyses
16S data was analyzed using R (version 4.2.1) and R Studio (version 2022.07.1). A cut off value of 10% of prevalence at the genus level on the absolute abundances of the Amplicon sequence variants (ASV) counts was used to remove ASV with a prevalence ≤ 10% between samples. In order to probe the drivers of fine-scale bacterial population dynamics, we tested the possible effects of potential covariates on the fecal bacterial community composition adjusting further statistical models for recruiting center (Alicante, Barcelona, Reus, Valencia), smoking status (former smoker, never smoked, current smoker), diabetes status, sex, age categories (below the median, <65 years old; above the median, >65 years old). For longitudinal assessments we also adjusted for intervention group, and timepoint.
Fecal microbiota alpha diversity was assessed on absolute abundance raw counts by calculating Chao1, Shannon, and Simpson indices.Citation46–48 Linear regression was performed to test cross-sectionally the association between calculated alpha diversity indices and tertiles of baseline CQI, and to test longitudinally the association between 1-year change in calculated alpha diversity indices and tertiles of 1-year change in CQI. A clr-transformation over taxonomic feature counts at genus level was performed to deal with the compositionality of 16S sequencing dataCitation49 prior conducting PCA and evaluate cross-sectionally the fecal microbiota distribution of the study population according to tertiles of baseline CQI, and longitudinally to evaluate the fecal microbiota distribution of the study population according to tertiles of 1-year change in CQI.
Beta diversity was calculated in terms of Euclidean distance over clr-transformed counts (Aitchison distance)Citation50 at genus level and PERMANOVA performed using “adonis2” function of vegan package to test cross-sectionally differences in microbiota dissimilarity across tertiles of baseline CQI, and to test longitudinally differences in microbiota dissimilarity across tertiles of 1-year change in CQI setting participant ID as groups within which to constrain permutations.
Multivariable association between tertiles and microbial metataxonomic features was assessed cross-sectionally and longitudinally using the R package MaAsLin2Citation51 (version 1.10.0). General linear models were performed on clr-transformed counts at the genus level without setting any additional normalization or transformation. Both in the cross-sectional and longitudinal analysis the lowest tertile (T1) of baseline CQI or 1-year change in CQI, respectively, was selected as the reference in order to explore those features associated with the highest tertile (T3). Multiple testing correction was performed using Benjamini-Hochberg procedure, and results with FDR < 0.1 were reported. For the longitudinal setup, participant ID was specified as a random effect parameter to address the non-independence between samples belonging to the same participant.
Multiple linear regression and multiple linear mixed models were performed to test the association between significant genera and CVD risk factors.
The baseline clinical characteristics of the study population and changes were described according to tertiles of baseline and 1-year change in CQI, respectively. Numerical variables were considered normally distributed according to the central limit theorem and described as means and standard deviations, whereas categorical variables were described as numbers and percentages. Differences across tertiles were tested with Pearson’s chi square test or one-way analysis of variance (ANOVA) as appropriate, whereas differences between tertiles were tested with independent-sample student’s t-test or Pearson’s chi square test. A p-value <0.05 was deemed as significant.
Phylogenetic Investigation of Communities by Reconstruction of Unobserved States package (PICRUSt2)Citation52 was used to perform an inferential analysis of the functional potential of the microbiome. Demultiplexed sequences were parsed and used as input for PICRUSt2 to generate a table of inferred per-sample MetaCyc pathwaysCitation53. Counts were clr-transformed, and cross-sectional and longitudinal association with tertiles assessed using MaAsLin2 and same settings used for taxonomic features counts.
Conclusions
In conclusion, in this observational study, consumption of higher quality carbohydrates was observed to be associated with greater alpha diversity, and abundance of genera related to beneficial cardiometabolic outcomes. These findings provide valuable information in possible mechanistic pathways implicated in the mediation that gut microbiota have in the associations observed between the quality of carbohydrates and health, and to support the use of carbohydrate dietary recommendations with a microbiota-oriented therapeutic strategy to modulate cardiometabolic disease risk and improve health.
Future studies with a comprehensive set of metabolomics, metagenomics, transcriptomics, and longer follow-up with intermediate time points and investigation of fecal microbiota as a possible mediating factor in the diet-health relationship pathway, would provide a better understanding of the association between CQI and fecal microbiota and the subsequent impact on health. Furthermore, randomized controlled trials are warranted as they would aid in establishing causality.
Largely, findings from the present study contribute to understanding the impact of the quality of dietary carbohydrate on the human fecal microbiota, which may ultimately help understand relationships between carbohydrate quality, microbial populations, and health with potential to better inform future public health strategies.
Abbreviations
| ANOVA | = | one-way analysis of variance |
| ASV | = | amplicon sequence variant |
| BMI | = | body mass index |
| clr | = | centered log-ratio |
| CQI | = | carbohydrate quality index |
| CVD | = | cardiovascular disease |
| FFQ | = | food frequency questionnaire |
| HDL | = | high-density lipoprotein |
| HOMA | = | homeostasis model assessment |
| LDL | = | low-density lipoprotein |
| MedDiet | = | Mediterranean diet |
| PCA | = | principal component analysis |
| PERMANOVA | = | permutational multivariate analysis of variance |
| PREDIMED | = | PREvención con DIeta MEDiterránea |
| SCFA | = | short chain fatty acids |
| T | = | tertile |
Authors’ contributions
All the principal PREDIMED-Plus investigators contributed to study concept and design and to data extraction from the participants. AA performed the statistical analyses. AA and SKN drafted the manuscript. All authors reviewed the manuscript for important intellectual content and approved the final version to be published.
Data sharing
The datasets generated and analyzed during the current study are not publicly available due to data regulations and for ethical reasons, considering that this information might compromise research participants’ consent because our participants only gave their consent for the use of their data by the original team of investigators. However, collaboration for data analyses can be requested by sending a letter to the PREDIMED-Plus steering Committee ([email protected]). The request will then be passed to all the members of the PREDIMED-Plus Steering Committee for deliberation.
Supplemental Material
Download MS Word (3.1 MB)Acknowledgments
We thank all PREDIMED-Plus participants and investigators. CIBEROBN is, an initiative of the Instituto de Salud Carlos III (ISCIII), Madrid, Spain. The Hojiblanca (Lucena, Spain) and Patrimonio Comunal Olivarero (Madrid, Spain) food companies donated extra-virgin olive oil. The Almond Board of California (Modesto, CA), American Pistachio Growers (Fresno, CA), and Paramount Farms (Wonderful Company, LLC, Los Angeles, CA) donated nuts for the PREDIMED-Plus pilot study. The authors also thank the PREDIMED-Plus Biobank Network as a part of the National Biobank Platform of the ISCIII for storing and managing the PREDIMED-Plus biological samples. JSS senior author of this study gratefully acknowledges the financial support by ICREA under the ICREA Academia programme. The research groups want to thank Jasper Koehorst and Bart Nijsse from the Unlock platform for their support in processing the data with the NG-tax pipeline. We also want to thank Athanasia Ioannou for her work with the stool samples preparation.
Disclosure statement
No potential conflict of interest was reported by the author(s).
Supplementary material
Supplemental data for this article can be accessed online at https://doi.org/10.1080/19490976.2023.2246185
Additional information
Funding
References
- Sikorski C, Yang S, Stennett R, Miller V, Teo K, Anand SS, Paré G, Yusuf S, Dehghan M, Mente A. Changes in energy, macronutrient, and food consumption in 47 countries over the last 70 years (1950-2019): a systematic review and meta-analysis. Nutr. 2023;108:111941. doi:10.1016/j.nut.2022.111941.
- Snetselaar LG, de Jesus JM, DeSilva DM, Stoody EE. Dietary guidelines for Americans, 2020–2025. Nutr Today. 2021;56(6):287–15. doi:10.1097/NT.0000000000000512.
- Campos V, Tappy L, Bally L, Sievenpiper JL, KA L. Importance of carbohydrate quality: What does it mean and How to measure it? J Nutr. 2022;152(5):1200–1206. doi:10.1093/jn/nxac039.
- Santiago S, Zazpe I, Bes-Rastrollo M, Sánchez-Tainta A, Sayón-Orea C, De La Fuente-Arrillaga C, Benito S, Martínez JA, Martínez-González M. Carbohydrate quality, weight change and incident obesity in a Mediterranean cohort: the SUN project. Eur J Clin Nutr. 2015;69(3):297–302. doi:10.1038/ejcn.2014.187.
- Reynolds A, Mann J, Cummings J, Winter N, Mete E, Te Morenga L. Carbohydrate quality and human health: a series of systematic reviews and meta-analyses. Lancet. 2019;393(10170):434–445. doi:10.1016/S0140-6736(18)31809-9.
- Augustin LSA, Kendall CWC, Jenkins DJA, Willett WC, Astrup A, Barclay AW, Björck I, Brand-Miller JC, Brighenti F, Buyken AE, et al. Glycemic index, glycemic load and glycemic response: an International scientific consensus summit from the International carbohydrate quality consortium (ICQC). Nutr, Metab, Cardiovasc Dis. 2015;25(9):795–815. doi:10.1016/j.numecd.2015.05.005.
- Zazpe I, Sánchez-Taínta A, Santiago S, De La Fuente-Arrillaga C, Bes-Rastrollo M, Martínez JA, Martínez-González MÁ. Association between dietary carbohydrate intake quality and micronutrient intake adequacy in a Mediterranean cohort: the SUN (seguimiento universidad de Navarra) project. Br J Nutr. 2014;111:2000–2009. doi:10.1017/S0007114513004364.
- Kim DY, Kim SH, Lim H. Association between dietary carbohydrate quality and the prevalence of obesity and hypertension. J Hum Nutr Diet. 2018;31(5):587–596. doi:10.1111/jhn.12559.
- Martínez-González MA, Fernandez-Lazaro CI, Toledo E, Diáz-López A, Corella D, Goday A, Romaguera D, Vioque J, Alonso-Gómez ÁM, Wärnberg J, et al. Carbohydrate quality changes and concurrent changes in cardiovascular risk factors: a longitudinal analysis in the PREDIMED-Plus randomized trial. Am J Clin Nutr. 2020;111(2):291–306. doi:10.1093/ajcn/nqz298.
- Sonnenburg JL, Bäckhed F. Diet–microbiota interactions as moderators of human metabolism. Nature. 2016;535(7610):56–64. doi:10.1038/nature18846.
- Ebrahimzadeh Leylabadlo H, Sanaie S, Sadeghpour Heravi F, Ahmadian Z, Ghotaslou R. From role of gut microbiota to microbial-based therapies in type 2-diabetes. Infect Genet Evol. 2020;81:104268. doi:10.1016/j.meegid.2020.104268.
- Ebrahimzadeh Leylabadlo H, Ghotaslou R, Samadi Kafil H, Feizabadi MM, Moaddab SY, Farajnia S, Sheykhsaran E, Sanaie S, Shanehbandi D, Bannazadeh Baghi H. Non-alcoholic fatty liver diseases: from role of gut microbiota to microbial-based therapies. Eur J Clin Microbiol Infect Dis. 2020;39(4):613–627. doi:10.1007/s10096-019-03746-1.
- Yatsunenko T, Rey FE, Manary MJ, Trehan I, Dominguez-Bello MG, Contreras M, Magris M, Hidalgo G, Baldassano RN, Anokhin AP, et al. Human gut microbiome viewed across age and geography. Nature. 2012;486(7402):222–227. doi:10.1038/nature11053.
- Al-Assal K, Martinez AC, Torrinhas RS, Cardinelli C, Waitzberg D. Gut microbiota and obesity. Clin Nutr Exp. 2018;20:60–64. doi:10.1016/j.yclnex.2018.03.001.
- Ley RE, Turnbaugh PJ, Klein S, Gordon JI. Human gut microbes associated with obesity. Nature. 2006;444(7122):1022–1023. doi:10.1038/4441022a.
- Aron-Wisnewsky J, Warmbrunn MV, Nieuwdorp M, Clément K. Metabolism and metabolic disorders and the microbiome: the intestinal microbiota associated with obesity, Lipid metabolism, and metabolic health—pathophysiology and therapeutic strategies. Gastroenterol. 2021;160(2):573–599. doi:10.1053/j.gastro.2020.10.057.
- Human Microbiome Project Consortium. Structure, function and diversity of the healthy human microbiome. Nature. 2012;486(7402):207–214. doi:10.1038/nature11234.
- Johnson EL, Heaver SL, Walters WA, Ley RE. Microbiome and metabolic disease: revisiting the bacterial phylum bacteroidetes. J Mol Med (Berl). 2017;95(1):1–8. doi:10.1007/s00109-016-1492-2.
- Brahe LK, Le Chatelier E, Prifti E, Pons N, Kennedy S, Hansen T, Pedersen O, Astrup A, Ehrlich SD, Larsen LH. Specific gut microbiota features and metabolic markers in postmenopausal women with obesity. Nutr & Diabetes. 2015;5(6):e159–e159. doi:10.1038/nutd.2015.9.
- Etxeberria U, Hijona E, Aguirre L, Milagro FI, Bujanda L, Rimando AM, Martínez JA, Portillo MP. Pterostilbene-induced changes in gut microbiota composition in relation to obesity. Mol Nutr Food Res. 2017;61(1):1500906. doi:10.1002/mnfr.201500906.
- Lai ZL, Tseng CH, Ho HJ, Cheung CKY, Lin JY, Chen YJ, Cheng FC, Hsu YC, Lin JT, El-Omar EM, et al. Fecal microbiota transplantation confers beneficial metabolic effects of diet and exercise on diet-induced obese mice. Sci Rep. 2018;8(1):15625. doi:10.1038/s41598-018-33893-y.
- Lim MY, You HJ, Yoon HS, Kwon B, Lee JY, Lee S, Song YM, Lee K, Sung J, Ko G. The effect of heritability and host genetics on the gut microbiota and metabolic syndrome. Gut. 2017;66(6):1031–1038. doi:10.1136/gutjnl-2015-311326.
- Huber-Ruano I, Calvo E, Mayneris-Perxachs J, Rodríguez-Peña MM, Ceperuelo-Mallafré V, Cedó L, Núñez-Roa C, Miro-Blanch J, Arnoriaga-Rodríguez M, Balvay A, et al. Orally administered odoribacter laneus improves glucose control and inflammatory profile in obese mice by depleting circulating succinate. Microbiome. 2022;10(1):135. doi:10.1186/s40168-022-01306-y.
- Atzeni A, Bastiaanssen TFS, Cryan JF, Tinahones FJ, Vioque J, Corella D, Fitó M, Vidal J, Moreno-Indias I, Gómez-Pérez AM, et al. Taxonomic and functional fecal microbiota signatures associated with insulin resistance in non-diabetic subjects with overweight/obesity within the frame of the PREDIMED-Plus study. Front Endocrinol (Lausanne). 2022;13. doi:10.3389/fendo.2022.804455.
- Waters JL, Ley RE. The human gut bacteria christensenellaceae are widespread, heritable, and associated with health. BMC Biol. 2019;17(1):17. doi:10.1186/s12915-019-0699-4.
- Tavella T, Rampelli S, Guidarelli G, Bazzocchi A, Gasperini C, Pujos-Guillot E, Comte B, Barone M, Biagi E, Candela M, et al. Elevated gut microbiome abundance of christensenellaceae, porphyromonadaceae and rikenellaceae is associated with reduced visceral adipose tissue and healthier metabolic profile in Italian elderly. Gut Microbes. 2021;13(1):1–19. doi:10.1080/19490976.2021.1880221.
- Garcia-Mantrana I, Selma-Royo M, Alcantara C, Collado MC. 2018. Shifts on gut microbiota associated to Mediterranean diet adherence and specific dietary intakes on general adult population. Front Microbiol. 9. doi:10.3389/fmicb.2018.00890.
- Chassard C, Lacroix C. Carbohydrates and the human gut microbiota. Curr Opin Clin Nutr Metab Care. 2013;16(4):453–460. doi:10.1097/MCO.0b013e3283619e63.
- Liu H, Wang J, He T, Becker S, Zhang G, Li D, Ma X. Butyrate: a double-edged sword for health?. Advanc Nutr. 2018;9:21–29. doi:10.1093/advances/nmx009.
- Amiri P, Hosseini SA, Ghaffari S, Tutunchi H, Ghaffari S, Mosharkesh E, Asghari S, Roshanravan N. Role of butyrate, a gut microbiota derived metabolite, in cardiovascular diseases: a comprehensive narrative review. Front Pharmacol. 2022;12:12. doi:10.3389/fphar.2021.837509.
- Crovesy L, Masterson D, Rosado EL. Profile of the gut microbiota of adults with obesity: a systematic review. Eur J Clin Nutr2020. 2020;74(9):1251–1262. doi:10.1038/s41430-020-0607-6.
- Mayorga-Ramos A, Barba-Ostria C, Simancas-Racines D, Guamán LP. 2022. Protective role of butyrate in obesity and diabetes: new insights. Front Nutr. 9. doi:10.3389/fnut.2022.1067647.
- De La Fuente-Arrillaga C, Vzquez Ruiz Z, Bes-Rastrollo M, Sampson L, Martinez-González MA. Reproducibility of an FFQ validated in Spain. Public Health Nutr. 2010;13(9):1364–1372. doi:10.1017/S1368980009993065.
- Fernández-Ballart JD, Piñol JL, Zazpe I, Corella D, Carrasco P, Toledo E, Perez-Bauer M, Martínez-González MÁ, Salas-Salvadó J, Martn-Moreno JM. Relative validity of a semi-quantitative food-frequency questionnaire in an elderly Mediterranean population of Spain. Br J Nutr. 2010;103(12):1808–1816. doi:10.1017/S0007114509993837.
- Gupta S, Mortensen MS, Schjørring S, Trivedi U, Vestergaard G, Stokholm J, Bisgaard H, Krogfelt KA, Sørensen SJ. Amplicon sequencing provides more accurate microbiome information in healthy children compared to culturing. Commun Biol. 2019;2(1):291. doi:10.1038/s42003-019-0540-1.
- Durazzi F, Sala C, Castellani G, Manfreda G, Remondini D, De Cesare A. Comparison between 16S rRNA and shotgun sequencing data for the taxonomic characterization of the gut microbiota. Sci Rep. 2021;11(1):11. doi:10.1038/s41598-021-82726-y.
- Zuo W, Wang B, Bai X, Luan Y, Fan Y, Michail S, Sun F. 16S rRNA and metagenomic shotgun sequencing data revealed consistent patterns of gut microbiome signature in pediatric ulcerative colitis. Sci Rep. 2022;12(1):12. doi:10.1038/s41598-022-07995-7.
- Salas-Salvadó J, Díaz-López A, Ruiz-Canela M, Basora J, Fitó M, Corella D, Serra-Majem L, Wärnberg J, Romaguera D, Estruch R, et al. Effect of a lifestyle intervention program with energy-restricted Mediterranean diet and exercise on weight loss and cardiovascular risk factors: one-year results of the PREDIMED-Plus trial. Diabetes Care. 2019;42(5):777–788. doi:10.2337/dc18-0836.
- de la Fuente-Arrillaga C, Vázquez Ruiz Z, Bes-Rastrollo M, Sampson L, Martinez-González MA. Reproducibility of an FFQ validated in Spain. Public Health Nutr. 2010;13(9):1364–1372. doi:10.1017/S1368980009993065.
- Molina L, Sarmiento M, Peñafiel J, Donaire D, Garcia-Aymerich J, Gomez M, Ble M, Ruiz S, Frances A, Schröder H, et al. Validation of the regicor short physical activity questionnaire for the adult population. PLoS One [Internet]. 2017;12(1):e0168148. doi:10.1371/journal.pone.0168148.
- Matthews DR, Hosker JP, Rudenski AS, Naylor BA, Treacher DF, Turner RC. Homeostasis model assessment: insulin resistance and β-cell function from fasting plasma glucose and insulin concentrations in man. Diabetologia. 1985;28(7):412–419. doi:10.1007/BF00280883.
- Moreiras O, Carbajal Á, Cabrera L, Cuadrado C. Tablas de composición de alimentos. 19a edició ed. Madrid, Spain: Ediciones Pirámide; 2018.
- Atkinson FS, Foster-Powell K, Brand-Miller JC. International tables of glycemic index and glycemic load values: 2008. Diabetes Care. 2008;31(12):2281–2283. doi:10.2337/dc08-1239.
- Schröder H, Zomeño MD, Martínez-González MA, Salas-Salvadó J, Corella D, Vioque J, Romaguera D, Martínez JA, Tinahones FJ, Miranda JL, et al. Validity of the energy-restricted Mediterranean diet adherence screener. Clin Nutr. 2021;40(8):4971–4979. doi:10.1016/j.clnu.2021.06.030.
- Atzeni A, Martínez MÁ, Babio N, Konstanti P, Tinahones FJ, Vioque J, Corella D, Fitó M, Vidal J, Moreno-Indias I, et al. Association between ultra-processed food consumption and gut microbiota in senior subjects with overweight/obesity and metabolic syndrome. Front Nutr. 2022;9. https://www.frontiersin.org/articles/10.3389/fnut.2022.976547/full.
- Chao A. Estimating the population size for capture-recapture data with unequal catchability. Biometric [Internet]. 1987;43(4):783. https://www.jstor.org/stable/2531532?origin=crossref.
- Shannon CE. A mathematical theory of communication. Bell System Tech J [Internet]. 1948;27(4):623–656. doi:10.1002/j.1538-7305.1948.tb00917.x.
- Simpson EH. Measurement of diversity. Nature [Internet]. 1949;163(4148):688. doi:10.1038/163688a0.
- Bastiaanssen TFS, Quinn TP, Loughman A. Treating bugs as features: a compositional guide to the statistical analysis of the microbiome-gut-brain axis. 2022. https://arxiv.org/pdf/2207.12475v1.pdf
- Aitchison J, Barceló-Vidal C, Martín-Fernández JA, Pawlowsky-Glahn V. Logratio analysis and compositional distance. Math Geol. 2000;32(3):271–275. doi:10.1023/A:1007529726302.
- Mallick H, Rahnavard A, McIver LJ, Ma S, Zhang Y, Nguyen LH, Tickle TL, Weingart G, Ren B, Schwager EH, et al. Multivariable association discovery in population-scale meta-omics studies. PLoS Comput Biol. 2021;17(11):1–27. doi:10.1371/journal.pcbi.1009442.
- Douglas GM, Maffei VJ, Zaneveld JR, Yurgel SN, Brown JR, Taylor CM, Huttenhower C, Langille MGI. PICRUSt2 for prediction of metagenome functions. Nat Biotechnol [Internet]. 2020;38(6):685–688. doi:10.1038/s41587-020-0548-6.
- Caspi R, Billington R, Keseler IM, Kothari A, Krummenacker M, Midford PE, Ong WK, Paley S, Subhraveti P, Karp PD. The MetaCyc database of metabolic pathways and enzymes - a 2019 update. Nucleic Acids Res [Internet]. 2020;48(D1):D445–53. doi:10.1093/nar/gkz862.