
ABSTRACT
Obesity (OB) and cardiometabolic disease are major public health issues linked to changes in the gut microbiome. OB and poor cardiometabolic health status (CHS) are often comorbid, which hinders efforts to identify components of the microbiome uniquely linked to either one. Here, we used a deeply phenotyped cohort of 408 adults from Colombia, including subjects with OB, unhealthy CHS, or both, to validate previously reported features of gut microbiome function and diversity independently correlated with OB or CHS using fecal metagenomes. OB was defined by body mass index, waist circumference, and body fat; CHS as healthy or unhealthy according to blood biochemistry and anthropometric data. We found that OB, more so than metabolic status, drove associations with gut microbiome structure and functions. The microbiome of obese individuals with and without co-existing unhealthy CHS was characterized by reduced metagenomic diversity, reduced fermentative potential and elevated capacity to respond to oxidative stress and produce bacterial antigens. Disease-linked features were correlated with increased host blood pressure and inflammatory markers, and were mainly contributed by members of the family Enterobacteriaceae. Our results link OB with a microbiome able to tolerate an inflammatory and oxygenated gut state, and suggest that OB is the main driver of microbiome functional differences when poor CHS is a comorbidity.
Introduction
Obesity (OB) is defined as excessive and unhealthy fat accumulation,Citation1 based on cutoff values from indices such as the body mass index (BMI), waist circumference (WC) or the percentage of body fat (BF%). OB is frequently accompanied by poor cardiometabolic health status (CHS), including increased blood pressure, elevated glucose levels or insulin resistance, and abnormal concentrations of triglycerides or cholesterol, which collectively increase the risk of related conditions such as heart disease, stroke and type 2 diabetes (T2D).Citation2,Citation3 Obesity has reached epidemic proportions: approximately 60% of residents in OECD countries were obese in 2019, a share that had increased over the previous decade.Citation4 In addition, it was estimated that obesity-related complications were responsible for 5 million deaths worldwide in 2019.Citation5
The root causes of obesity are multi-faceted, as are therapeutic interventions aimed at curbing the obesity epidemic.Citation6,Citation7 The gut microbiome first emerged over a decade ago as a potential therapeutic target for obesity.Citation8,Citation9 The composition of the gut microbiome has been linked to both OB and to unhealthy CHS in human population studies.Citation10–16 Studies of individuals with OB, cardiovascular disease and T2D have revealed similar patterns of microbiome function, including an enrichment of microbial genes linked to membrane transport and xenobiotic metabolism, and a depletion of pathways for enzyme cofactors, vitamin metabolism and butyrate production, compared to healthy controls.Citation10–16 Pathways for production of lipopolysaccharide (LPS) have been reported to be enriched in people with OB,Citation17 and genes associated with oxidative-stress resistance elevated in T2D.Citation14–16 These reports suggest the existence of common microbial patterns in OB and unhealthy CHS. The gut microbiomes of obese individuals, T2D and cardiovascular disease patients are less fermentative and more inflammatory than the intestinal microbiota of healthy individuals. In turn, this could indicate a loss of gut homeostasis and a disruption of the anaerobiosis of the gut linked to an increase in facultative anaerobes.Citation18 Likewise, a reduction in the richness of microbial speciesCitation19 and genes they encodeCitation20,Citation21 is a widespread characteristic of the microbiome in diverse pathologies, including OB and unhealthy CHS.
As OB and poor CHS are generally comorbid, they are often confounded: obese individuals usually suffer from other cardiometabolic afflictions (e.g., T2D, cardiovascular disease, liver disease). Therefore, decoupling unhealthy CHS- and OB-specific associations with the gut microbiome remains a challenge.Citation22 Disentangling the characteristics of the microbiome associated with OB or poor CHS may help to develop microbiome-based, disease-specific therapeutic strategies, as well as focusing efforts on investigating the mechanistic links between the gut microbiome and disease progression. The use of well-characterized cohorts with paired host and microbiome data, such as dietary, socioeconomic, anthropometric and biochemical data, is needed to overcome such a challenge. Here, we aimed to untangle previously reported associations of functional characteristics of the microbiome between OB and unhealthy CHS and test their generalizability. We generated metagenome sequences for 408 fecal samples from adult men and women from a deeply phenotyped cohortCitation23,Citation24 for whom both OB and CHS data were available, and tested for the reproducibility of previously reported microbiome functional associations.Citation13,Citation14,Citation20,Citation25–31 We observed a loss of microbiome diversity and metabolic potential associated with poor metabolic health, consistent with previous studies, and found this to be primarily influenced by host OB when unhealthy CHS is a concomitant condition. Our findings indicate the OB better explains changes in microbiome structure, richness and function when poor CHS is a comorbidity.
Results
Overview of a deeply-characterized human cohort
Prior microbiome studies have reported diverse associations between the microbiome and OB or unhealthy CHS, but these conditions often overlap. We sought to disentangle the association between previously reported microbiome functions and obesity or cardiometabolic health by leveraging a well-phenotyped population, wherein both types of health information were available.Citation23,Citation24
An overview of the cohort, host and microbial data, and the analyses performed is provided in , and summary statistics of subjects are presented in . This cohort consisted of community-dwelling adults living in five large Colombian cities who were previously enrolled in similar proportions by body mass index (BMI) category, city of origin, sex at birth and age group.
Figure 1. Overview of the Colombian cohort, study design, metagenome profiling, functional feature selection and data analysis. We performed shotgun metagenome sequencing on fecal DNA samples from a previous study in which 459 adults from five Colombian cities were enrolled. Subjects were classified according to their cardiometabolic health status (CHS). The functional profile of the gut microbiome was assessed. We selected a subset of functional features previously reported to be associated with cardiovascular disease, type 2 diabetes or obesity (OB). We then determined which associations were overlapping between CHS and OB, and which were uniquely associated to each condition while accounting for the other. Figure made with BioRender.
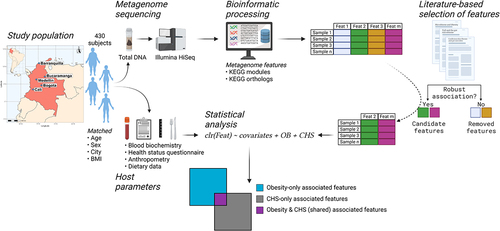
Table 1. General, anthropometric, health-related and dietary characteristics of subjects with microbiome data included in the present study (n = 408). Data presented as the mean ± SD. BMI: body mass index, HDL: high density lipoprotein cholesterol, LDL: low density lipoprotein cholesterol, hsCRP: high-sensitivity C-reactive protein, HOMA-IR: homeostatic model assessment – insulin resistance. P values from ANOVA or Welch’s t-test.
Cardiometabolic health was defined as a binary score (healthy or unhealthy) based on clinical definitions that allowed us to evaluate it independently of obesity.Citation24 Participants were considered cardiometabolically unhealthy when they presented two or more alterations in blood pressure or consumption of antihypertensive medication; fasting triglycerides; cholesterol or consumption of lipid-lowering medication; fasting glucose or consumption of antidiabetic medication; insulin resistance; and systemic inflammation (see Methods).
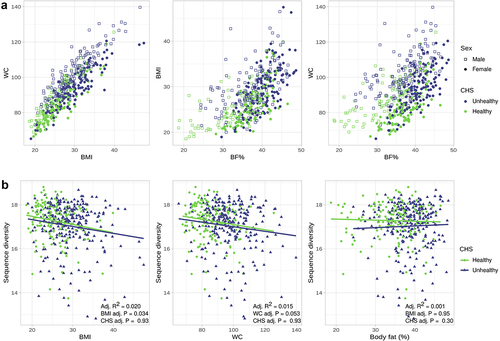
Obesity was defined as a continuous spectrum by one of three possible metrics (BMI, waist circumference [WC] and percentage body fat [BF%]). BMI is widely used to measure obesity and remains a practical tool for large-scale population studies and screening purposes in clinical settings; however, since data on WC and BF%, which require specialized equipment and trained personnel, were available to us, we used and compared all three OB measures for our analyses. Indeed, there is a positive association between the three measures (). Notably, although individuals with obesity tend to have worse cardiometabolic health (), there is a significant overlap of healthy and unhealthy CHS across the entire spectrum of obesity, allowing us to ask which host phenotype associates best with microbiome function.
Figure 2. Obesity (OB) measures are positively associated with each other and negatively correlated with metagenome richness. a) Scatter plots showing the association between OB measures and CHS across all subjects. b) Scatter plot of sequence richness and each OB measure as a continuous variable, regression lines are shown. P values and adjusted R2 from linear models adjusted for age, sex, city and the consumption of medications. Total n = 408, the subjects were further categorized into CHS healthy (n = 153) and unhealthy (n = 255).
OB better explains differences in metagenome sequence richness and beta diversity than CHS
Microbiome diversity has been frequently associated with health status in prior studies; therefore, we first assessed the association of OB and poor CHS with the overall structure of the metagenome. We evaluated metagenome sequence richness using a k-mer-based diversity index, fitting linear models adjusting for selected host factors (Supplementary Text). The use of a k-mer based index overcomes the potential biases of using methods based on databases or marker genes to calculate gene or species richness. As reported in other cohorts,Citation32 we observed a negative association between k-mer-based sequence diversity and host health. Sequence diversity was negatively correlated with BMI and WC (q vals. = 0.006 and 0.010, respectively), but not with BF% (q val. = 0.557), when evaluated individually as continuous variables. Similarly, when considering CHS alone, healthy individuals had significantly higher richness than unhealthy individuals (q val. = 0.092).
CHS correlated negatively with sequence richness (). However, although both metrics correlated with sequence diversity, OB measures better explained differences in sequence richness than CHS. BMI had the lowest Akaike information criterion (AIC) value and explained the highest proportion of variance (AIC = 1144.9, Adj. R2 = 0.021), followed by WC (AIC = 1147.1, R2 = 0.017). Only BF% (AIC = 1154.7, R2 = 0.002) was a worse predictor than CHS (CHS AIC = 1152.7, Adj. R2 = 0.003). When adjusting for CHS, most linear models of sequence richness performed worse than the respective models considering only an OB measure, but better than the model including only the CHS status of the subjects (AIC <1152.7 for BMI and WC, adjusting for CHS). Therefore, a decrease in microbiome sequence richness was better explained by an increase in OB than by CHS.
We further used variance partitioning to assess the contribution of OB and CHS to the functional beta-diversity of the microbiome. Similar to our results with sequence alpha-diversity, we found that BMI explained a higher total and unique proportion of variance for functional beta-diversity than CHS (PERMANOVA BMI: total R2 = 0.0045, unique R2 = 0.0025, P val. = 0.0037; CHS: total R2 = 0.0021, unique R2 = 0.00014, P val. = 0.02. Combined R2 = 0.0020). Likewise, BMI explained a greater proportion of the variance in beta-diversity models fitted with and without age, sex, city and medication consumption as covariates, and remained significantly associated after accounting for CHS; the variance explained by CHS after adjusting for covariates was lower when not accounting for BMI, and was close to zero when BMI was included in the models (Supplementary Text and table S5). We did not observe significant differences in functional beta-diversity when using BF% or WC as measures of OB. Similar results were obtained when the analyses were performed using KEGG ortholog tables.
Overall, these patterns indicate that in populations with metabolic comorbidities, OB rather than unhealthy CHS explains differences in the richness and structure of the adult human gut microbiome.
Literature-based selection of candidate features allows testing of robust associations in a novel population
To narrow down the set of functional features that might be associated with OB or CHS, we used data from publicly available studies looking into cardiometabolic diseases. We obtained KEGG ortholog and KEGG module associations from 10 primary studies and meta-analyses encompassing 5 countriesCitation13,Citation14,Citation20,Citation25–31 (Table S1). We filtered the retrieved data to select functional features that were consistently associated with disease or with healthy controls within and between studies (see Selection of functional features for analysis in Methods and Figure S1). In addition, changes in microbiome richness and structure have been consistently linked to obesity or metabolic disease.Citation19–21 We used these lists of candidate diversity and functional features to filter the metagenome profile data generated for the validation cohort (Table S2 and Table S3) in order to determine the reproducibility of prior analyses and determine which features are associated uniquely with obesity and poor cardiometabolic health.
More functional features are uniquely associated with OB than with unhealthy CHS or shared by both
Having observed robust and reproducible associations between obesity and microbiome diversity, we next sought to verify the individual microbiome functions that correlate with metabolic health. After removal of functional features present in < 50% of our cohort, 2 653 KEGG orthologs and 136 KEGG modules were retained for downstream analyses. The ID and annotation of candidate modules and orthologs can be found in Table S2 and Table S3. We used MaAsLin2 adjusting for age, sex, city and medication consumption, which were selected as covariates after assessing their individual association with metagenome sequence richness (Supplementary Text and Figure S2). A feature was considered to be uniquely associated with a given condition if it was significant after regressing out the other condition. Conversely, we considered a feature as part of the set of shared functions between OB and CHS if it was significantly associated with one condition (e.g., in a model only including OB), but not after the other was included in the model (e.g., in a model including both OB and CHS).
Despite prior reports of association with OB, T2D or cardiovascular disease, only half of the candidate features included in our analyses (Table S2 and Table S3) were significantly associated with unhealthy CHS or any one of the three OB measures (Figure S1B): 67/136 (49.3%) KEGG modules and 1 417/2 653 (53.4%) orthologs were uniquely associated with one of the conditions or belonged to a set of shared features between CHS and OB (Table S6 and Table S7).
Consistent with our analysis of microbiome diversity, OB was also the dominant factor associated with functional features (). Most significantly associated features were uniquely linked to OB or belonged to the OB-CHS shared group (). We found 33 modules uniquely associated with at least one OB measure (26 for BMI, 33 for WC and 5 for BF%). Likewise, 51 modules were shared between conditions (36 BMI-CHS, 32 for WC-CHS and 34 for BF%-CHS). We only observed 5 modules uniquely associated with CHS when adjusting for BF% () and no modules associated with CHS when adjusting for BMI or WC. Similarly, when analyzing orthologs, CHS-unique features were the minority: 610 orthologs were uniquely associated with OB (372 for BMI, 545 for WC and 92 for BF%) and 1 105 orthologs belonged to the shared set (723 for BMI-CHS, 779 for WC-CHS and 505 for BF%-CHS), contrasting with 103 total orthologs unique to CHS (39 after adjusting for BMI, 24 for WC and 96 for BF%) (Table S6).
Figure 3. Obesity (OB), rather than cardiometabolic health status (CHS), drives associations with functional features of the microbiome. a) Scatterplots of linear regression coefficient of KEGG module abundance in models including CHS and measures of OB (BMI: left panel, WC: center panel, BF%: right panel). Colors represent whether a module is uniquely associated with OB or CHS, shared or not significant. b) Barplots show the number of KEGG modules belonging to the unique or shared sets shown in A) for each OB measure. Colors represent the association with health (i.e, health-associated modules are enriched in lean or cardiometabolically healthy individuals). c) Upset plot indicates the overlap in KEGG modules uniquely associated with each OB measure; vertical bars show the size of the union of the sets and horizontal bars the size of each individual set of associated modules.
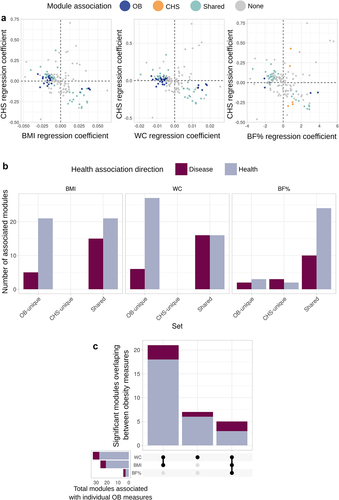
We observed a high overlap between functions uniquely associated with any of the OB measures (), as expected given the positive correlation between BMI, BF% and WC (). Most features belonging to the unique sets correlated with at least two of the OB metrics and had a consistent link with host health ().
Figure 4. Related microbiome functions are highly overlapping between OB measures and distinct between health outcomes. Shown are KEGG modules significantly associated with at least one of the OB measures and its corresponding linear regression coefficient (BMI: left panel, WC: center panel, BF%: right panel). Point colors indicate whether a module is uniquely associated with OB or CHS, shared or not significant; line colors represent the association with health outcomes for a particular OB measure (i.e, health-associated modules are enriched in lean individuals).
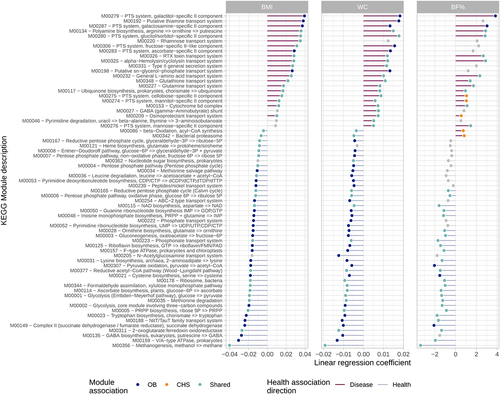
The majority of significant functions were enriched in lean and cardiometabolically healthy subjects and depleted in those with obesity (). Health-related features included orthologs and modules involved in microbial energy and fermentative pathways, such as: glycolysis, the pentose phosphate pathway, the bifidobacterium shunt and methanogenesis; acetogenesis and the production of propionate and succinate; degradation of mucin; vitamin biosynthesis; and degradation of amino acids (, Table S6 and Table S7).
A smaller number of features were enriched in obese individuals. Disease-associated modules and orthologs revealed an increased capacity to metabolize sulfur and nitrogen compounds through an increased abundance of thioredoxins, thiosulfate sulfurtransferases, thioesterases, nitrate reductases, nitrate/nitrite transporters and sensor proteins, and other nitrogen regulatory proteins (, Table S6 and Table S7). Disease-associated features also included modules and orthologs involved in the metabolism of choline, glycine betaine and trimethylamine; notably, the downstream metabolite trimethylamine N-oxide (TMAO) has been strongly associated with cardiovascular disease riskCitation33. Disease-associated modules were also indicative of a metal acquisition response, with features related to the synthesis and export of the siderophore enterobactin, in addition to zinc uptake regulators and manganese/iron transport systems. Other signatures of the gut of diseased subjects included increases in the transport of simple sugars via the phosphotransferase (PTS) system; the synthesis of lipopolysaccharide and polyamine production; and the utilization of ethanolamine. Furthermore, disease-enriched functions were indicative of an increased potential to tolerate reactive oxygen species by glutathione-regulated efflux systems and glutathione transferases.
A sensitivity analysis in which we carried out similar tests after removal of subjects who consumed medications for diabetes, hypertension, dyslipidemia and PPIs showed results largely consistent with the main analysis (supplementary text). This indicates that even though these factors might act as surrogate markers for cardiometabolic disease, their inclusion as covariates in models does not dampen the signal of the association between CHS and the functional profile of the microbiome.
Finally, we used hypertension, a simpler phenotype to differentiate subjects according to their cardiovascular health independent of OB, and compared the association of microbial features with those reported above. Subjects were classified as hypertensive if their systolic/diastolic blood pressure ≥ 130/85 mm Hg or if they consumed antihypertensive medication, otherwise they were classified as non-hypertensive; this resulted in 193 hypertensive and 215 non-hypertensive individuals. We performed analyses of KEGG module and ortholog abundances after adjusting for age, sex, city of origin and medication consumption as covariates. The results of these tests were largely concordant with analyses of OB and CHS (tables S8 and S9). A larger share of features were uniquely associated with OB measures after accounting for hypertension status (OB-unique modules;orthologs. BMI 41;573. WC 39;773, BF% 17;206), followed by features shared between conditions (shared modules;orthologs. BMI 18;521. WC 24;550, BF% 20;310), and lastly, features uniquely linked to hypertension when adjusting for OB (hypertension-unique modules;orthologs. BMI 11;213. WC 9;189, BF% 12;386). Similarly, functional features associated with poor health outcomes included osmoprotectant and toxin transport systems, membrane transport of simple sugars by the PTS system, and secretion systems, whereas features enriched in healthy subjects were involved in processes such as methanogenesis and energy metabolism. The former group of features had a lower abundance and prevalence than the latter, in agreement with the results of the analyses performed with the cardiometabolic health status.
Together, these data suggest that obesity drives a depletion in healthy microbiome functions in individuals with metabolic co-morbidities.
Functional features significantly associated with OB or unhealthy CHS also correlate with blood pressure, inflammatory markers and short chain fatty acid excretion
To better understand the relevance of these microbiome functions to host metabolism and inflammation, we analyzed the link of functional features with anthropometric, biochemical and host dietary factors. For this, we identified groups of correlated host parameters and microbial functional features (i.e., blocks) using Hierarchical All-against-All Association testing (HAllA) on the set of functional features significantly associated with OB, CHS or both. We found 1 573 correlation blocks when using KEGG orthologs and 66 blocks when using KEGG modules. We observed a large overlap between the functions that formed these blocks; that is, multiple functions were linked to several host parameters.
The set of variables forming the largest correlation blocks were the fecal concentration of short chain fatty acids (SCFA): butyrate, acetate and propionate. Twenty-five module blocks (comprising 49 modules) () and 244 ortholog blocks (comprising 1073 orthologs) significantly correlated with at least one SCFA. Functional modules that positively correlated with SCFAs were predominantly involved in simple sugar and osmoprotectant transport systems, including components of the PTS system, and glutamine, glutathione, thiamine, sn-glycerol-phosphate, rhamnose, RTX toxin, N-acetylglucosamine and alpha-hemolysin/cyclolysin transport systems (Table S10 and Table S11). Conversely, modules that negatively correlated with SCFAs were involved in methanogenesis and the Wood-Ljungdahl pathway; the citrate cycle, glycolysis and gluconeogenesis; and the biosynthesis of ascorbate, NAD and several nucleotides and amino acids (Table S10 and Table S11). It is worth noting that in our cohortCitation34 and multiple other studiesCitation35 higher fecal SCFA levels have been linked to OB and altered CHS.
Figure 5. Functional features of the microbiome form correlation blocks with host factors, including blood pressure and fecal short chain fatty acid levels. Heatmap showing the correlations between modules significantly associated with OB measures, CHS or shared between both. Association blocks were obtained using hierarchical all-against-all association testing (HAllA) and are demarcated by black borders. Significance of individual associations are denoted by white dots (q val. <0.1), color indicates Spearman’s correlation coefficient (rho). Association blocks are sorted by high correlation and low P values, as denoted by the white numbers. Colored bands represent the association group to which each module belongs in association with each OB measure. For the annotation of each module see Table S6.
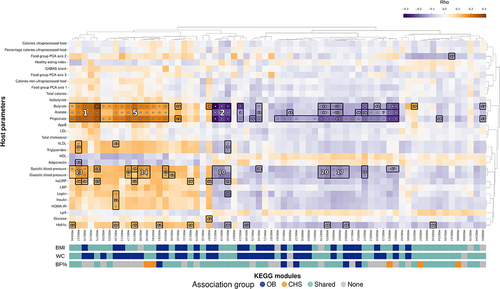
Besides SCFAs, diastolic and systolic blood pressure were the host factors with the largest blocks of correlated features; we detected 15 blocks (comprising 23 modules) and 434 ortholog blocks (comprising 602 orthologs) correlated with either. Most of these blocks overlapped with the large correlation blocks formed by SCFAs. The direction of the association was largely the same as above, with higher abundance of transport of simple sugars and osmoprotectants linked to increased blood pressure, while the opposite was true for the abundance of methanogenesis, glycolysis, gluconeogenesis and associated biosynthesis modules (). Smaller correlation blocks were also detected for inflammatory and metabolic markers measured by high-sensitivity C-reactive protein (hsCRP), glycated hemoglobin (HbA1c), insulin resistance (HOMA-IR), leptin, insulin, triglycerides, adiponectin and very low density lipoprotein (VLDL) cholesterol (). Collectively, multiple microbiome functions that were associated with OB were also directly correlated with fecal SCFA concentrations and with other host health biomarkers including blood pressure and inflammatory markers.
Disease-linked features are less prevalent, abundant and diverse than health-linked ones, and are mainly contributed by members of Enterobacteriaceae
Based on the reductions in metagenomic diversity observed with increasing OB or poor CHS, we expected a limited number of taxa to dominate microbial functions in unhealthy individuals. To test this, we first assessed the overall prevalence and abundance of the KEGG modules that were significant in the above analyses across all subjects. Although the mean prevalence of all tested features was high (Supplementary Text and Figure S3), disease-associated features were less prevalent and abundant than health-associated ones, regardless of the association group to which they belonged (e.g., OB-unique, shared) (Figure S4). This pattern, together with a functional profile enriched in stress resistance and alternative energy pathways in the case of disease-linked modules, might indicate that disease-linked modules are contributed to the microbiome by a restricted set of microbial taxa.
The above is consistent with the germ-organ theory of non-communicable diseases,Citation36 wherein inflammation in the gut is linked to a disruption of anaerobiosis in the gut and an expansion of facultative anaerobes, especially the family Enterobacteriaceae (Phylum Proteobacteria).Citation37 Therefore, we assessed the contribution of individual taxa to the overall functional profile of the microbiome, also known as a function’s ‘contributional diversity’ (using HUMAnN2’s tiered search; see Methods), focusing on members of Enterobacteriaceae.
We compared the total contributional diversity of the modules significantly associated with the OB metrics, CHS or both, between health- and disease-linked modules. Overall, we observed that modules associated with health were more diverse than those associated with disease (). For example, in the case of modules unique to BMI, 253.43 ± 129.54 taxa contributed on average to disease-associated modules across all subjects, whereas 2 600.94 ± 1 537.17 contributed to health-associated modules across all subjects (Mann-Whitney U = 4, q val. <0.01). Very similar patterns were observed with other OB measures, both in uniquely associated or shared modules with CHS ().
Figure 6. Enterobacteriaceae are the main contributors to disease-linked modules. a) contributional diversity, that is, number of species contributing modules significantly associated with OB measures, CHS or shared by both. b) relative contribution of Enterobacteriaceae taxa to the total module diversity. Black points and bars represent mean and standard errors.
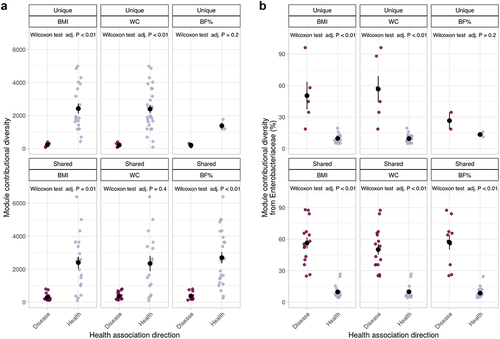
In contrast, Enterobacteriaceae taxa contributed more to the total abundance of disease-linked modules than to health-associated ones (). In the case of modules uniquely associated to BMI, the mean contribution of Enterobacteriaceae to disease-linked modules was 53.51% ± 24.75, while only of 8.71% ± 3.61 in the case of health-related modules across all subjects (Mann-Whitney U = 202, q val. <0.01). This was consistent across OB measures, and unique or shared sets of modules () and suggests that differences in the abundance of members of Enterobacteriaceae drives the observed functional microbiome changes in OB.
As a comparison, we performed a similar analysis using microbial families that had an overall high contribution to the detected modules and that are known to be associated with human health: Lachnospiraceae, Ruminococcaceae, Oscillospiraceae, Acutalibacteraceae, Streptococcaceae (phylum Bacillota_A), Lactobacillaceae (phylum Bacillota), Actinomycetaceae, Bifidobacteriaceae (phylum Actinomycetota) and Bacteroidaceae (phylum Bacteroidota). In general, the differences between the contribution of these families to the health- and disease-linked modules were smaller than those observed in Enterobacteriaceae. We observed that the health-linked modules had a higher contribution of the families Lachnospiraceae, Ruminococcaceae, Oscillospiraceae, Acutalibacteraceae and Bifidobacteriaceae compared to disease-linked modules. Conversely, the family Bacteroidaceae had a significantly higher contribution to disease-linked modules. We did not observe significant differences in the share of contributional diversity attributed to the families Streptococcaceae, Lactobacillaceae and Actinomycetaceae. (Figure S5).
To validate that the increased contribution of Enterobacteriaceae to the diseased-linked modules is due to an enrichment of these taxa as opposed to an alteration in gene content within this family, we evaluated the taxonomic profile of the subjects of our cohort. In agreement with the above results, the abundance of Enterobacteriaceae was increased in subjects with poorer health outcomes, both for OB (Median abundance of Enterobacteriaceae across BMI categories: Lean: 2.97%, IQR: 6.920; Overweight: 5.03%, IQR: 22.014; Obese: 6.88%, IQR 24.17) and cardiometabolic status (Healthy 3.55%, IQR: 12.17; Abnormal 5.86%; IQR: 22.43). We then used MaAsLin2 to test the association of the abundance of Enterobacteriaceae with BMI and CHS, adjusting for age, sex, city and the consumption of medication. The association between Enterobacteriaceae was shared between OB and CHS: when one main effect was included in the models, only BMI was significantly associated with the abundance of the family (BMI P value: 0.02; CHS P value: 0.32). When both main effects were considered, the association between Enterobacteriaceae and BMI ceased to be significant (BMI adjusting for CHS P value: 0.08; CHS adjusting for BMI P value: 0.25). Therefore, the increase in the contribution of this taxon to the functions associated with disease in our cohort can be attributed to a concomitant increase in the overall abundance in the species that encode them.
Discussion
Relative to a healthy state, OB and unhealthy CHS have been repeatedly associated with changes in the composition and function of the gut microbiome. However, OB and poor CHS are often confounded in analyses, which hinders subsequent efforts to identify and use disease-specific microbiome markers. A primary goal of this study was to identify associations with OB and CHS independently of each other. Our approach was to single out previously reported associations between gut microbial functions and human metabolic health and validate them in a deeply-phenotyped population of a country in the midst of westernization that allowed OB and CHS to be tested independently for associations with microbiome features.
Not all candidate features resulting from the mining of publicly available results were considered in our analyses, since some were not detected and others were not present at a high enough prevalence (Table S2 and Table S3). Candidate modules and orthologs were distributed across the range of frequencies and abundances observed in the Colombian cohort (Figure S3); however, we excluded those with low prevalence, as they also had low overall abundances, and it could be assumed that they do not make a large contribution to gut microbiome function.
Our results indicate that OB is the main driver of microbiome functional changes regardless of CHS status. Most features were significantly associated with OB when the CHS of subjects was accounted for, in addition to other potential confounders, namely, age, sex and the consumption of medications. These findings validate the previously reported loss of beneficial functions and diversity associated with metabolic diseases.Citation20,Citation32 Moreover, our results are consistent with a previous study that compared healthy individuals with obese and non-obese diabetics;Citation22 to the best of our knowledge, no other studies have incorporated information of both cardiometabolic health and obesity in the analysis of community-dwelling subjects.
We speculate that OB drives the association with gut microbiome functions over CHS because the former is linked with factors that can swiftly influence the composition of the microbial community, including diet, exercise, disease, and the consumption of medications, as well as to medium- and long-term exposures, which occur prior to the development of comorbidities. In contrast, the risk of T2D, cardiovascular disease and other conditions seems to be mainly associated with long-term OB history rather than at a single time point.Citation38,Citation39 Long-term OB is positively correlated with inflammation,Citation39 coronary artery calcification,Citation40 dyslipidemiaCitation41,Citation42 and increased mortality risk.Citation38 We posit that large changes in the composition of the microbiome occur early in the development of OB, explaining the dominance of OB over CHS in our results. The subsequent appearance of cardiometabolic abnormalities linked to an unhealthy CHS would only be associated with relatively minor changes in the microbial community. In other words, changes in the potential functions encoded by the gut microbiome in subjects with unhealthy CHS would correspond to the exacerbation of preexisting deviations from a healthy state.
The metabolism of trimethylamine (TMA) and trimethylamine-N-oxide (TMAO) in the gut provide one example of how changes in the microbiome that are initially associated with OB could, in the long term, lead to the development of conditions such as atherosclerotic cardiovascular disease. In our Colombian cohort, as well as in others,Citation13 functions involved in the metabolism of TMA from TMAO were increased in OB. TMAO can be used by diverse gut Enterobacteriaceae as an electron acceptor, who convert it to TMA;Citation43,Citation44 the latter can also be synthesized from dietary carnitine, choline or glycine betaine. Once in the gut, TMA is absorbed by the host and converted into TMAO in the liver, where it enters the bloodstream. Circulating TMAO inhibits cholesterol transport and promotes its accumulation in macrophages, inducing the formation of atherosclerotic plaques.Citation45 Thus, increased TMAO metabolism during obesity could itself contribute to worsened cardiovascular health. This further supports the notion that the contribution of the gut microbiome to TMAO cycling may represent a direct mechanistic link to host metabolism during OB and unhealthy CHS.Citation33
The microbiome of obese subjects with and without comorbid unhealthy CHS was characterized by lower sequence richness and decreased fermentative ability. Furthermore, functional modules that were abundant in these subjects were contributed by a lower diversity of taxa stemming disproportionately from the Enterobacteriaceae family. These modules were involved in the tolerance to reactive oxygen species, the utilization of sulfur and nitrogen in alternative energy metabolism pathways and metal ion sequestering. Together, the presence of facultative anaerobic functions and the expansion of phylum Proteobacteria suggest the loss of the hypoxic status of the gut epitheliumCitation46 and the disruption of gut barrier function. Indeed, functions enriched in OB and comorbid unhealthy CHS were involved in the utilization of ethanolamine, which can be derived from the cell membranes of dead epithelial cells.Citation44,Citation47 Moreover, modules positively associated with OB and comorbid unhealthy CHS were correlated with other host parameters such as lipopolysaccharide-binding protein (LBP), a marker of translocation of bacterial antigens to the host bloodstreamCitation48 and hsCRP, a marker of systemic inflammation.Citation49
Multiple inflammatory mechanisms have been associated with the development of OB, insulin resistanceCitation50 and cardiovascular disease.Citation51 Inflammation of the gut epithelium causes an increase in neutrophil transmigration to the gut lumen,Citation52 where reactive oxygen species and iron and zinc sequesters are released,Citation53 consistent with the increase in siderophores and zinc transporters we observed. Indeed, in murine models, gut epithelial inflammation precedes and correlates with diet-induced OB, and interactions between the gut microbiome and diet are required for the induction of inflammation.Citation18,Citation54 Our findings of functional and taxonomic analyses complement these studies to support a model whereby the expansion of Enterobacteriaceae in obese microbiomes is tied to host inflammation, contributing to worsening in cardiometabolic health. However, this clade was the main but not the sole contributor of features enriched in individuals with poorer health outcomes, moreover, functions encoded by other taxa, particularly fiber-degraders, were correlated with a healthy status, underscoring the complex ecological dynamics within the microbial community.
We observed that modules linked with poor health outcomes were positively correlated with fecal SCFA levels. The absorption of SCFAs is controlled by anion transport proteins expressed in the gut epithelium.Citation55 SCFAs are typically associated with health,Citation56 however, gut SCFAs are sometimes observed to be higher in the obese state.Citation35 In previous work performed in our cohort, SCFA levels positively correlated with pathobiont abundance.Citation34 It is likely that expression of SCFA transporters, uptake rates, and SCFA production rates are all influenced by the diversity of the microbiome, and therefore context-dependent.
Data from other large cohorts with host and metagenome information comparable to those used in the present study are scarce. Thus, performing a multi-population analysis to decouple the association of the microbiome with OB and CHS, while controlling confounding factors, was not feasible. Nevertheless, we were able to incorporate findings from published studies into our analyses by focusing on a set of functional features that were previously linked to OB or cardiometabolic conditions. This allowed us to assess the robustness and generalizability of the associations on an understudied population from South America using a rigorous statistical framework.
We did not observe complete replication of associations reported by previous studies. There are multiple non-exclusive explanations for this. First, we used a stringent threshold of feature prevalence, which precludes certain candidate features from the analysis. However, because of the functional redundancy of the microbiome (supplementary text), the features removed based on prevalence represented only one fifth of all detected features. Moreover, the features removed had an overall low contribution to the total metagenome profile in terms of abundance. We considered that the disadvantages of a reduced number of potential associations discovered by the use of this cutoff were offset by the benefits of a lower burden of multiple comparisons to be performed. Second, we used a statistical framework in which feature abundance was transformed to account for the compositional nature of sequencing data. In addition, we accounted for host factors known to influence the composition of the microbiome: age, sex, local geographical origin, and the consumption of medication by the subjects. Incorporating known confounders can reduce the risk of obtaining false positives in cross-sectional studies.Citation57,Citation58 In other words, accounting for common confounders might facilitate the comparison between studies by ameliorating biases introduced by the confounding variables.Citation57 Third, some of the non-significant results could be due to differences in the composition of the microbiome between human populations. Indeed, the degree to which microbiome-health associations are conserved across populations is still an open question in microbiome research.Citation59 Lastly, the effect size of the correlation between certain human phenotypes and the gut microbiome tends to be small. Therefore, some associations can only be recovered by studying cohorts with even larger sample sizes than the one used here.Citation57
Our study is not without limitations. Although in vitro studies demonstrated that drugs with human targets of all therapeutic classes inhibit the growth of human commensals,Citation60 we only considered medications with direct relevance to OB and CHS, with no dosage information. Thus, we are unable to rule out residual confounders not measured in our study.Citation61 In addition, our findings are based on cross-sectional data from a single human population used for validation; our approach might result in the omission of population-specific associations not present in this Colombian cohort. Finally, our study used shotgun metagenomics to assess the functional profile of the microbiome, which does not directly measure the transcripts or proteins expressed by the microbiota, but rather the genomic potential.Citation62 Therefore, the activity of the community at a specific point in time as a response to the studied conditions cannot be measured.Citation12,Citation63
The present study strengthens our understanding of the metabolic potential of the gut microbiome in OB and unhealthy CHS in an understudied population from a middle-income country. We expect that the robust associations we report will serve to inform mechanistic studies of the role of the microbiome in disease, and to guide the development of microbiome-based interventions for personalized nutrition and medicine.
Materials and methods
Selection of functional features for analysis
We focused our analyses on a set of protein orthologs or metabolic modules previously reported to be associated with OB, T2D and cardiovascular disease. Altogether, the included primary studies and meta-analyses incorporated data from 10 studies and 5 industrialized countries:Citation13,Citation14,Citation20,Citation25–31 China, Sweden, Finland, Denmark and Spain (Table S1). We systematized the selection of features to include by retrieving the results of studies reporting analyses of novel populations or meta-analyses, which used similar databases to group functional features, and that were easily accessible in the original publication. We selected studies that reported their results using the Kyoto Encyclopedia of Genes and Genomes (KEGG) modulesCitation13,Citation31 or KEGG orthogroups,Citation13,Citation21 which inform about the functions of the microbiome at levels analogous to those of pathways or proteins, respectively. Selection was performed in three steps (Figure S1A): first, for each study we selected features that were consistently associated with diseased subjects or healthy controls (e.g., by removing features enriched in both lean and diabetic subjects within the same study). Next, we merged the resulting lists of features and performed a similar selection of features with consistent associations across studies. Finally, the shortlisted functional features that were detected in the validation cohort (see below) were further filtered to include only those present in at least 50% of individuals. This resulted in 2 653 KEGG orthologs and 136 KEGG modules, which were used for further analyses (Figure S1B, Table S1 and Table S2).
Validation population
The validation population (Colombian cohort) is a previously characterized cohort from a cross-sectional study of community-dwelling adults from Colombia, South America,Citation23,Citation64 enrolled between June and December 2014. Detailed information regarding study design and ethics approval can be found elsewhere.Citation23,Citation64 Briefly, this cohort consisted of 459 adult men and women aged 18 to 62 from five Colombian cities and insured by the health insurance provider EPS Sura. Underweight participants (BMI <18.5 kg m−2), pregnant women, and individuals who had consumed antibiotics or antiparasitics in the three months prior to enrollment were excluded. Subjects diagnosed with any of the following diseases: Alzheimer’s disease, Parkinson disease or any other neurodegenerative disease; current or recent cancer (<1 year); and gastrointestinal diseases (Crohn’s disease, ulcerative colitis, short bowel syndrome, diverticulosis or celiac disease) were also excluded. The gut microbiome of this study population in relation to OB and CHS was previously characterized by 16S rRNA sequencing.Citation23 Here, we used the DNA extracts from 430 fecal samples generated by de la Cuesta-Zuluaga et al.Citation23,Citation64
The Colombian cohort was previously deeply phenotyped: measurements include clinical variables in blood serum, anthropometric characteristics, blood pressure, fecal short-chain fatty acids (SCFAs), dietary parameters and the use of medications.Citation23,Citation34 Data used in the present work include total cholesterol, high density lipoprotein (HDL) cholesterol, low density lipoprotein (LDL) cholesterol, very low density lipoprotein (VLDL) cholesterol, triglycerides, fasting glucose, fasting insulin, glycated hemoglobin (HbA1C), adiponectin, lipopolysaccharide-binding protein (LBP), high-sensitivity C-reactive protein (hsCRP) and insulin resistance using the homeostasis model assessment (HOMA-IR). We also included waist circumference (WC, classified as normal or central obesity), the body mass index (BMI classified as lean (18.5 ≤ BMI <25.0 kg m−2), overweight (25.0 ≤ BMI <30.0 kg m−2) or obese (BMI ≥30.0 kg m−2)) and body fat percentage measured from skin foldsCitation65 (BF% classified as low, lean, excess, obese), and systolic and diastolic blood pressures.
Participants were considered cardiometabolically unhealthy when they presented 2 or more of the following conditions: systolic/diastolic blood pressure ≥ 130/85 mm Hg or consumption of antihypertensive medication; fasting triglycerides ≥150 mg dl−1; HDL >40 mg dl−1 (men), > 50 mg dl−1 (women) or consumption of lipid-lowering medication; fasting glucose ≥100 mg dl−1 or consumption of antidiabetic medication; HOMA-IR > 3, and hsCRP >3 mg dl−1. Citation24
Pharmacological treatments were previously registered by the participants in specific questionnaires.Citation23 Previously published stool SCFA measures included butyrate, propionate, acetate, and the branched-chain fatty acid isobutyrate.Citation34
The dietary information of each subject was obtained using 24-hour dietary recall interviews, from which total calories, fiber, marco- and micro-nutrient intake in the habitual diet of participants was quantified.Citation23 We then used these data to reproduce the analyses previously reported by García-Vega et al.,Citation66 and available at https://github.com/Vidarium/diet_microbiota_MiSalud1.0 in the subjects for whom we had metagenome data. Briefly, diet quality was measured using two indices: the adapted healthy eating index (HEI) and the Colombian Food-Based Dietary Guidelines (GABA, from the Spanish ‘guías alimentarias basadas en alimentos’); these indices measure the number of food portions consumed compared to the total recommended for a healthful and nutritionally adequate diet. We also included the caloric intake in our analyses differentiated into total caloric intake, calories from ultraprocessed foods, calories from non-ultraprocessed foods, and the percentage of calories from ultraprocessed foods. In addition, García-Vega et al., showed that a principal component analysis based on the consumption of major food groups differentiated individuals according to high or low consumption of tubers, meats, fats and sugars along PC1, and according to a high consumption of grains and dairy vs a high consumption of fruits and vegetables along PC2. Thus, we included the first two axes of the food group PCA in our analyses.
Generation of fecal metagenomes for the validation population
Feces collection and total DNA extraction are described elsewhere.Citation23,Citation64 We prepared shotgun metagenome libraries with a modified Nextera protocol.Citation67 Briefly, we used 1 ng of total fecal DNA for Nextera Tn5 tagmentation. After purification with Agencourt AMPure XP beads (Beckman Coulter, Brea, CA, USA), we normalized and pooled the samples. Next, we performed size selection of the pooled samples using BluePippin (Sage Sciences, Beverly, MA, USA) to restrict fragment sizes to 400 to 700 bp. Barcoded pools were sequenced using the Illumina HiSeq 3000 platform with 2 × 150 bp paired-end sequencing. Library preparation and sequencing was performed at the Max Planck Institute for Biology Tübingen, Germany. We included blank DNA extraction samples as negative controls and DNA from synthetic mock communities as well as fecal samples from a previously sequenced donor as positive controls.
We validated raw sequence reads with fqtools v.2.0Citation68 and de-duplicated with the “clumpify” command of bbtools v37.78 (https://jgi.doe.gov/data-and-tools/bbtools/). Adapters were trimmed, and read quality control was performed using the “bbduk” command of bbtools and skewer v0.2.2.Citation69 We removed human genome reads in silico by mapping them to the hg19 assembly with the “bbmap” command of bbtools. Quality reports for each sample were created with fastqc v0.11.7 (https://github.com/s-andrews/FastQC) and multiQC v1.5a.Citation70 Metagenome coverage for each sample was estimated using Nonpareil v.3.3.4.Citation71 Samples with a sequencing depth < 500 000 reads or a metagenome coverage < 60% were discarded from downstream analyses.
Overall, we attempted microbiome sequencing in 430 samples and succeeded in the shotgun characterization in 408 of them. After metagenomic library construction, sequencing, and bioinformatic curation of sequencing reads, the retained 408 samples had a sequencing depth > 500 000 reads (mean ± SD: 6 719 985 reads sample−1 ± 8 960 996) or a metagenome coverage calculated using Nonpareil > 60% (82.36% ± 8.38).
To make the obtention of the functional profile computationally feasible on samples with a large number of sequences, we subsampled the filtered reads to a maximum of 10 million reads per sample using seqtk v.1.3; the functional profiling was then performed using HUMAnN2 v.2.8.1.Citation72 We mapped reads against custom databases of archaeal and bacterial genes and genomes generated using Struo v.0.1.6Citation73 based on the Release 89 of the Genome Taxonomy DatabaseCitation74 (available at http://ftp.tue.mpg.de/ebio/projects/struo/). We obtained the taxonomic profile of the samples by classifying the subsampled reads using Kraken v.2.1 (34) and Bracken v.2.2 (35) with a custom database generated using Struo v.0.1.6Citation73 based on the Release 89 of the Genome Taxonomy Database.Citation74
Statistical analyses
Statistical analyses were performed using R v.4.0.2Citation75 unless stated otherwise. We adjusted P values for multiple comparisons using the Benjamini-Hochberg method (henceforth “q val.”), with a significance threshold of 0.1.
Transformation of functional feature abundances
The abundances of functional features from Colombian subjects were transformed using the centered log-ratio (clr). Using the unfiltered abundance tables, we replaced zero values with pseudocounts in a compositionally aware manner with the zCompositions v.1.3.4 package of R,Citation76 and used the propr v.4.2.6Citation77 and compositions v.2.0Citation78 packages to compute the clr transformation. Positive clr values imply that the feature is more abundant than the average feature, conversely, negative values imply that the feature is less abundant than the averageCitation79
Selection of host factors used as covariates in association analyses
We evaluated the individual association of age, sex, city, socioeconomic status (according to the official Colombian strata division, from 1 [lowest income] to 6 [highest income]), and the consumption of medications for diabetes, hypertension, dyslipidemia and proton pump inhibitors (PPIs) with the overall composition of the microbiome. We used k-mer-based richness calculated using Nonpareil for alpha-diversity, and Aitchison’s distance (Euclidean distance using clr-transformed abundances) calculated using KEGG module abundances as our measure of beta-diversity. For each medication category, we performed a 1:3 nearest neighbor propensity score matching without replacement using the MatchIt v.4.1.0 package of R,Citation80 matching consumers with non-consumers by age, sex, city and BF%.
We tested differences in alpha-diversity by sex and medication consumption using Welch’s t-test, ANOVA for city and socioeconomic status, and Spearman’s rank correlation for age (Figure S2). Next, we assessed multivariate homogeneity of group dispersions, and performed a permutational multivariate analysis of variance (PERMANOVA) on Aitchison distance matrices using the vegan v.2.5–7 package of R.Citation81 Host factors that were significantly associated with at least one of the two diversity metrics were selected for inclusion as covariates in downstream analyses.
Assessment of metagenome sequence richness and beta-diversity
For each sample, we estimated k-mer based sequence richness using Nonpareil.Citation71 Importantly, the use of a k-mer-based index allows to overcome the biases introduced by insufficient coverage of reference database-dependent estimations of diversity. We then performed linear regression analyses to test the association of BMI, BF% or WC (as continuous variables), and CHS of the subjects with sequence richness after adjusting for age, city, sex and medication usage. Goodness-of-fit of each model was assessed using Akaike information criterion (AIC), and the proportion of variance was estimated by means of the adjusted coefficient of determination (R2). Next, we assessed differences in beta-diversity estimates of functional features by BMI (lean, overweight, obese), BF% (low, lean, excess, obese) or WC (normal, central obesity), and CHS. For this, we performed a permutational multivariate analysis of variance (PERMANOVA) on a matrix of Aitchison’s distances of KEGG modules after adjusting for age, city, sex and medication usage, as implemented in the vegan v.2.5–7 package of R.Citation81 The proportion of variance was estimated using the adjusted coefficient of determination (R2). We calculated the unique and shared contributions of OB measures and CHS to the functional beta-diversity by variance partitioning.
Identification of a set of shared functions between OB and cardiometabolic health status, and association of functional features with host parameters
We identified individual functional features (i.e., KEGG modules and orthologs) uniquely associated with OB or CHS using the MaAsLin2 v.1.0.0 packageCitation82 on R v.3.6.2. For this, we fitted Gaussian linear models and assessed each feature’s clr-transformed abundance including both a measure of OB (e.g., BMI, WC or BF%) and the cardiometabolic health status as main effects. We used type II ANOVAs to test for significance. A functional feature was considered to be uniquely associated with a given condition if it was significant after regressing out the other condition. Conversely, we considered a feature as part of the set of shared functions between OB and CHS if it was significantly associated with a single condition (e.g., in a model only including OB) but was non-significant after the other was included in the model (e.g., in a model including both OB and CHS). Features that did not reach significance in models with a single or two main effects were considered not associated with OB or CHS. All models included age, sex, city and the consumption of the aforementioned medications as covariates; other host factors evaluated above were not included. We also performed a sensitivity analysis by removing all subjects who consumed medications for diabetes, hypertension, dyslipidemia and PPIs, and repeating the analysis; results were largely consistent with the main analysis (supplementary text).
Next, the association of blocks of related microbial features and host biochemical and anthropometric parameters was tested using HALLA v.0.8.19 (hierarchical all-against-all association testing; https://github.com/biobakery/halla). We used matrices of residuals of the microbial features and host parameters after adjusting each for age, sex, city and medication consumption. Spearman’s rank correlation was used as the similarity measure, and hierarchical clustering was performed with Ward’s method.
Quantification of contributional diversity and abundance of functional features
We used HUMAnN2’s tiered search,Citation72 combined with the Struo-generated custom databases,Citation73 to quantify the contribution of different members of the microbial community to the total abundance of the detected modules and orthologs. In addition, we used these data to quantify the contributional diversity of the functional features, measured as the number of taxa that contributed to its total abundance, that is, the contributional richness.Citation72 We restricted our analyses to the set that were uniquely associated to any of the OB measures, the CHS, or that were shared between conditions. For each set, we compared the contributional richness between modules associated with health and disease.
Assessment of Enterobacteriaceae in the taxonomic profile
The taxonomic profile table was filtered by removing species with a mean relative abundance < 0.01%; on average, the retained species accounted for 94.5% ± 3.7 of the reads across all samples. We then collapsed the taxa abundances at the family level and focused on the abundance of the family Enterobacteriaceae. For summary statistics we used the relative abundance and for hypothesis testing we transformed total counts using the centered log-ratio (clr). We assessed the association of Enterobacteriaceae abundance with OB or CHS using the MaAsLin2 v.1.0.0 packageCitation82 on R v.3.6.2, including age, sex, city and medication consumption as covariates.
Data and code availability
The metagenomic sequence data generated during this study have been deposited in the European Nucleotide Archive with accession ID PRJEB58436. The R notebooks and associated data are available at https://github.com/leylabmpi/Col_OB_CHS. This manuscript was prepared in accordance with the Strengthening The Organization and Reporting of Microbiome Studies (STORMS) guidelines.Citation83 The STORMS checklist is presented in Table S14.
Supplemental Material
Download Zip (6.9 MB)Acknowledgments
We thank the participants who took part in the study, and the Vidarium, EPS SURA and Dinámica IPS staff that helped with recruitment and field work. Some authors of this work collaborate through the Microbiome & Health Network. We are grateful to Alejandra Duque, Albane Ruaud, Taichi Suzuki, William Walters and Laura Salazar-Jaramillo for the fruitful discussions and comments.
Disclosure statement
While engaged in this project, J.S.E. was employed by a research centre that belongs to a food company (Grupo Empresarial Nutresa). J.d.l.C-Z., K.H., N.D.Y. and R.E.L. report no conflict of interest.
Supplementary material
Supplemental data for this article can be accessed online at https://doi.org/10.1080/19490976.2023.2246634
Additional information
Funding
References
- World Health Organization. Obesity. [Accessed 2022 Feb 23]. https://www.who.int/en/health-topics/obesity#tab=tab_1
- Grundy SM, Brewer HB Jr, Cleeman JI, Smith SC Jr, Lenfant C, American Heart Association, National Heart, Lung, and Blood Institute. Definition of metabolic syndrome: Report of the National Heart, lung, and blood Institute/American Heart association conference on scientific issues related to definition. Circulation. 2004;109:433–22. doi:10.1161/01.CIR.0000111245.75752.C6.
- Wildman RP, Muntner P, Reynolds K, McGinn AP, Rajpathak S, Wylie-Rosett J, Sowers MR. The obese without cardiometabolic risk factor clustering and the normal weight with cardiometabolic risk factor clustering: prevalence and correlates of 2 phenotypes among the US population (NHANES 1999-2004). Arch Intern Med. 2008;168(15):1617–1624. doi:10.1001/archinte.168.15.1617.
- OECD. Health at a glance 2021: OECD Indicators. Paris: OECD Publishing; 2021 [accessed 2023 Feb 9]. https://www.oecd-ilibrary.org/social-issues-migration-health/health-at-a-glance-2021_ae3016b9-en
- Institute for Health Metrics and Evaluation (IHME). GBD 2019 cause and risk summary: High body-mass index — level 2 risk; 2020 [accessed 2022 Feb 23]. https://www.healthdata.org/results/gbd_summaries/2019/high-body-mass-index-level-2-risk
- Valsamakis G, Konstantakou P, Mastorakos G. New targets for drug treatment of obesity. Annu Rev Pharmacol Toxicol. 2017;57(1):585–605. doi:10.1146/annurev-pharmtox-010716-104735.
- Kumanyika SK. Advancing health equity efforts to reduce obesity: changing the course. Annu Rev Nutr. 2022;42(1):453–480. doi:10.1146/annurev-nutr-092021-050805.
- Ley RE, Turnbaugh PJ, Klein S, Gordon JI. Microbial ecology: human gut microbes associated with obesity. Nature. 2006;444(7122):1022–1023. doi:10.1038/4441022a.
- Turnbaugh PJ, Ley RE, Mahowald MA, Magrini V, Mardis ER, Gordon JI. An obesity-associated gut microbiome with increased capacity for energy harvest. Nature. 2006;444(7122):1027–1031. doi:10.1038/nature05414.
- Greenblum S, Turnbaugh PJ, Borenstein E. Metagenomic systems biology of the human gut microbiome reveals topological shifts associated with obesity and inflammatory bowel disease. Proc Natl Acad Sci U S A. 2012;109(2):594–599. doi:10.1073/pnas.1116053109.
- Zhernakova A, Kurilshikov A, Bonder MJ, Tigchelaar EF, Schirmer M, Vatanen T, Mujagic Z, Vila AV, Falony G, Vieira-Silva S, et al. Population-based metagenomics analysis reveals markers for gut microbiome composition and diversity. Sci. 2016;352(6285):565–569. doi:10.1126/science.aad3369.
- Franzosa EA, Morgan XC, Segata N, Waldron L, Reyes J, Earl AM, Giannoukos G, Boylan MR, Ciulla D, Gevers D , et al. Relating the metatranscriptome and metagenome of the human gut. Proc Natl Acad Sci. 2014;111(22):E2329–38. PMCID: 24843156. doi:10.1073/pnas.1319284111.
- Jie Z, Xia H, Zhong S-L, Feng Q, Li S, Liang S, Zhong H, Liu Z, Gao Y, Zhao H, et al. The gut microbiome in atherosclerotic cardiovascular disease. Nat Commun. 2017;8(1):845. doi:10.1038/s41467-017-00900-1.
- Qin J, Li Y, Cai Z, Li S, Zhu J, Zhang F, Liang S, Zhang W, Guan Y, Shen D, et al. A metagenome-wide association study of gut microbiota in type 2 diabetes. Nature. 2012;490(7418):55–60. doi:10.1038/nature11450.
- Forslund K, Hildebrand F, Nielsen T, Falony G, Le Chatelier E, Sunagawa S, Prifti E, Vieira-Silva S, Gudmundsdottir V, Pedersen HK, et al. Disentangling type 2 diabetes and metformin treatment signatures in the human gut microbiota. Nature. 2015;528(7581):262–266. doi:10.1038/nature15766.
- Yassour M, Lim MY, Yun HS, Tickle TL, Sung J, Song Y-M, Lee K, Franzosa EA, Morgan XC, Gevers D, et al. Sub-clinical detection of gut microbial biomarkers of obesity and type 2 diabetes. Genome Med. 2016;8(1):17. doi:10.1186/s13073-016-0271-6.
- Liu R, Hong J, Xu X, Feng Q, Zhang D, Gu Y, Shi J, Zhao S, Liu W, Wang X, et al. Gut microbiome and serum metabolome alterations in obesity and after weight-loss intervention. Nat Med. 2017;23(7):859–868. doi:10.1038/nm.4358.
- Litvak Y, Byndloss MX, Tsolis RM, Bäumler AJ. Dysbiotic Proteobacteria expansion: a microbial signature of epithelial dysfunction. Curr Opin Microbiol. 2017;39:1–6. doi:10.1016/j.mib.2017.07.003.
- Walters WA, Xu Z, Knight R. Meta-analyses of human gut microbes associated with obesity and IBD. FEBS Lett. 2014;588(22):4223–4233. doi:10.1016/j.febslet.2014.09.039.
- Le Chatelier E, Nielsen T, Qin J, Prifti E, Hildebrand F, Falony G, Almeida M, Arumugam M, Batto J-M, Kennedy S, et al. Richness of human gut microbiome correlates with metabolic markers. Nature. 2013;500(7464):541–546. doi:10.1038/nature12506.
- Armour CR, Nayfach S, Pollard KS, Sharpton TJ. A metagenomic meta-analysis reveals functional signatures of health and disease in the human gut microbiome. mSystems. 2019 14;4(4):e00332–18. doi:10.1128/mSystems.00332-18.
- Thingholm LB, Rühlemann MC, Koch M, Fuqua B, Laucke G, Boehm R, Bang C, Franzosa EA, Hübenthal M, Rahnavard A, et al. Obese individuals with and without type 2 diabetes show different gut microbial functional capacity and composition. Cell Host & Microbe. 2019;26(2):252–64.e10. doi:10.1016/j.chom.2019.07.004.
- de la Cuesta-Zuluaga J, Corrales-Agudelo V, Velásquez-Mejía EP, Carmona JA, Abad JM, Escobar JS. Gut microbiota is associated with obesity and cardiometabolic disease in a population in the midst of Westernization. Sci Rep. 2018;8(1):11356. doi:10.1038/s41598-018-29687-x.
- de la Cuesta-Zuluaga J, Corrales-Agudelo V, Carmona JA, Abad JM, Escobar JS. Body size phenotypes comprehensively assess cardiometabolic risk and refine the association between obesity and gut microbiota. Int J Obes. 2018;42(3):424–432. doi:10.1038/ijo.2017.281.
- Karlsson FH, Tremaroli V, Nookaew I, Bergström G, Behre CJ, Fagerberg B, Nielsen J, Bäckhed F. Gut metagenome in European women with normal, impaired and diabetic glucose control. Nature. 2013;498(7452):99–103. doi:10.1038/nature12198.
- Feng Q, Liang S, Jia H, Stadlmayr A, Tang L, Lan Z, Zhang D, Xia H, Xu X, Jie Z, et al. Gut microbiome development along the colorectal adenoma–carcinoma sequence. Nat Commun. 2015;6(1):6528. doi:10.1038/ncomms7528.
- Zhang X, Zhang D, Jia H, Feng Q, Wang D, Liang D, Wu X, Li J, Tang L, Li Y, et al. The oral and gut microbiomes are perturbed in rheumatoid arthritis and partly normalized after treatment. Nat Med. 2015;21(8):895–905. doi:10.1038/nm.3914.
- Qin N, Yang F, Li A, Prifti E, Chen Y, Shao L, Guo J, Le Chatelier E, Yao J, Wu L, et al. Alterations of the human gut microbiome in liver cirrhosis. Nature. 2014;513(7516):59–64. doi:10.1038/nature13568.
- Nielsen HB, Almeida M, Juncker AS, Rasmussen S, Li J, Sunagawa S, Plichta DR, Gautier L, Pedersen AG, Le Chatelier E, et al. Identification and assembly of genomes and genetic elements in complex metagenomic samples without using reference genomes. Nat Biotechnol. 2014;32(8):822–828. doi:10.1038/nbt.2939.
- Li J, Jia H, Cai X, Zhong H, Feng Q, Sunagawa S, Arumugam M, Kultima JR, Prifti E, Nielsen T, et al. An integrated catalog of reference genes in the human gut microbiome. Nat Biotechnol. 2014;32(8):834–841. doi:10.1038/nbt.2942.
- Wu H, Tremaroli V, Schmidt C, Lundqvist A, Olsson LM, Krämer M, Gummesson A, Perkins R, Bergström G, Bäckhed F. The gut microbiota in Prediabetes and diabetes: A population-based cross-sectional study. Cell Metab. 2020;32(3):379–90.e3. doi:10.1016/j.cmet.2020.06.011.
- Sze MA, Schloss PD, Fraser CM. Looking for a signal in the Noise: Revisiting obesity and the microbiome. MBio. 2016;7(4):e01018–16. doi:10.1128/mBio.01018-16.
- Zeisel SH, Warrier M. Trimethylamine N-Oxide, the microbiome, and Heart and Kidney disease. Annu Rev Nutr. 2017;37(1):157–181. doi:10.1146/annurev-nutr-071816-064732.
- de la Cuesta-Zuluaga J, Mueller NT, Álvarez-Quintero R, Velásquez-Mejía EP, Sierra JA, Corrales-Agudelo V, Carmona JA, Abad JM, Escobar JS. Higher fecal short-chain fatty acid levels are associated with gut microbiome dysbiosis, obesity, hypertension and cardiometabolic disease risk factors. Nutrients. 2019;11(1):51. doi:10.3390/nu11010051.
- Kim KN, Yao Y, Ju SY, Short chain fatty acids and fecal microbiota abundance in humans with obesity: A systematic review and meta-analysis. Nutrients. 2019 18;11(10):2512. doi:10.3390/nu11102512.
- Byndloss MX, Bäumler AJ. The germ-organ theory of non-communicable diseases. Nat Rev Microbiol. 2018;16(2):103–110. doi:10.1038/nrmicro.2017.158.
- Bäumler AJ, Sperandio V. Interactions between the microbiota and pathogenic bacteria in the gut. Nature. 2016;535(7610):85–93. doi:10.1038/nature18849.
- Xu H, Cupples LA, Stokes A, Liu C-T. Association of obesity with mortality over 24 Years of weight history: findings from the Framingham Heart study. JAMA Netw Open. 2018;1:e184587. doi:10.1001/jamanetworkopen.2018.4587.
- Dowd JB, Zajacova A. Long-term obesity and cardiovascular, inflammatory, and metabolic risk in U.S. adults. Am J Prev Med. 2014;46(6):578–584. doi:10.1016/j.amepre.2014.01.016.
- Reis JP, Loria CM, Lewis CE, Powell-Wiley TM, Wei GS, Carr JJ, Terry JG, Liu K. Association between duration of overall and abdominal obesity beginning in young adulthood and coronary artery calcification in middle age. JAMA. 2013;310(3):280–288. doi:10.1001/jama.2013.7833.
- Pinto Pereira SM, Power C. Life course body mass index, birthweight and lipid levels in mid-adulthood: a nationwide birth cohort study. Eur Heart J. 2013;34(16):1215–1224. doi:10.1093/eurheartj/ehs333.
- Janssen I, Katzmarzyk PT, Ross R. Duration of overweight and metabolic health risk in American men and women. Ann Epidemiol. 2004;14(8):585–591. doi:10.1016/j.annepidem.2004.01.007.
- Barrett EL, Kwan HS. Bacterial reduction of trimethylamine oxide. Annu Rev Microbiol. 1985;39(1):131–149. doi:10.1146/annurev.mi.39.100185.001023.
- Zeng MY, Inohara N, Nuñez G. Mechanisms of inflammation-driven bacterial dysbiosis in the gut. Mucosal Immunol. 2017;10(1):18–26. doi:10.1038/mi.2016.75.
- Geng J, Yang C, Wang B, Zhang X, Hu T, Gu Y, Li J. Trimethylamine N-oxide promotes atherosclerosis via CD36-dependent MAPK/JNK pathway. Biomed Pharmacother. 2018;97:941–947. doi:10.1016/j.biopha.2017.11.016.
- Palleja A, Mikkelsen KH, Forslund SK, Kashani A, Allin KH, Nielsen T, Hansen TH, Liang S, Feng Q, Zhang C, et al. Recovery of gut microbiota of healthy adults following antibiotic exposure. Nat Microbiol. 2018;3(11):1255–1265. doi:10.1038/s41564-018-0257-9.
- Garsin DA. Ethanolamine utilization in bacterial pathogens: roles and regulation. Nat Rev Microbiol. 2010;8(4):290–295. doi:10.1038/nrmicro2334.
- Guo S, Al-Sadi R, Said HM, Ma TY. Lipopolysaccharide causes an increase in intestinal tight junction permeability in vitro and in vivo by inducing enterocyte membrane expression and localization of TLR-4 and CD14. Am J Pathol. 2013;182(2):375–387. doi:10.1016/j.ajpath.2012.10.014.
- Gentile M, Panico S, Rubba F, Mattiello A, Chiodini P, Jossa F, Marotta G, Pauciullo P, Rubba P. Obesity, overweight, and weight gain over adult life are main determinants of elevated hs-CRP in a cohort of Mediterranean women. Eur J Clin Nutr. 2010;64(8):873–878. doi:10.1038/ejcn.2010.69.
- Rorato R, Borges BDC, Uchoa ET, Antunes-Rodrigues J, Elias CF, Elias LLK. LPS-Induced low-Grade inflammation increases hypothalamic JNK expression and causes central insulin resistance irrespective of body weight changes. IJMS query. 2017;18(7):1431. doi:10.3390/ijms18071431.
- Scheithauer TPM, Rampanelli E, Nieuwdorp M, Vallance BA, Verchere CB, van Raalte DH, Herrema H. Gut microbiota as a trigger for metabolic inflammation in obesity and type 2 diabetes. Front Immunol. 2020;11:571731. doi:10.3389/fimmu.2020.571731.
- Fournier BM, Parkos CA. The role of neutrophils during intestinal inflammation. Mucosal Immunol. 2012;5(4):354–366. doi:10.1038/mi.2012.24.
- Zhang D, Frenette PS. Cross talk between neutrophils and the microbiota. Blood. 2019;133(20):2168–2177. doi:10.1182/blood-2018-11-844555.
- Ding S, Chi MM, Scull BP, Rigby R, Schwerbrock NMJ, Magness S, Jobin C, Lund PK, Gaetani S. High-fat diet: bacteria interactions promote intestinal inflammation which precedes and correlates with obesity and insulin resistance in mouse. PLoS One. 2010;5(8):e12191. doi:10.1371/journal.pone.0012191.
- Stumpff F. A look at the smelly side of physiology: transport of short chain fatty acids. Pflugers Arch - Eur J Physiol. 2018;470(4):571–598. doi:10.1007/s00424-017-2105-9.
- van der Hee B, Wells JM. Microbial regulation of host physiology by short-chain fatty acids. Trends Microbiol. 2021;29(8):700–712. doi:10.1016/j.tim.2021.02.001.
- Vujkovic-Cvijin I, Sklar J, Jiang L, Natarajan L, Knight R, Belkaid Y. Host variables confound gut microbiota studies of human disease. Nature. 2020;587(7834):448–454. doi:10.1038/s41586-020-2881-9.
- Ghosh TS, Das M, Jeffery IB, O’Toole PW. Adjusting for age improves identification of gut microbiome alterations in multiple diseases. Elife. 2020;9. doi:10.7554/eLife.50240.
- Porras AM, Brito IL. The internationalization of human microbiome research. Curr Opin Microbiol. 2019;50:50–55. doi:10.1016/j.mib.2019.09.012.
- Maier L, Pruteanu M, Kuhn M, Zeller G, Telzerow A, Anderson EE, Brochado AR, Fernandez KC, Dose H, Mori H, et al. Extensive impact of non-antibiotic drugs on human gut bacteria. Nature. 2018;555(7698):623–628. doi:10.1038/nature25979.
- Forslund SK, Chakaroun R, Zimmermann-Kogadeeva M, Markó L, Aron-Wisnewsky J, Nielsen T, Moitinho-Silva L, Schmidt TSB, Falony G, Vieira-Silva S, et al. Combinatorial, additive and dose-dependent drug–microbiome associations. Nature. 2021;600(7889):500–505. doi:10.1038/s41586-021-04177-9.
- Shakya M, Lo C-C, Chain PSG. Advances and Challenges in Metatranscriptomic analysis. Front Genet. 2019;10:904. doi:10.3389/fgene.2019.00904.
- Maurice CF, Haiser HJ, Turnbaugh PJ. Xenobiotics shape the physiology and gene expression of the active human gut microbiome. Cell. 2013;152(1–2):39–50. doi:10.1016/j.cell.2012.10.052.
- de la Cuesta-Zuluaga J, Mueller NT, Corrales-Agudelo V, Velásquez-Mejía EP, Carmona JA, Abad JM, Escobar JS. Metformin is associated with higher relative abundance of mucin-degrading akkermansia muciniphila and several short- chain fatty acid – Producing microbiota in the gut. Diabetes Care. 2017;40(1):54–62. doi:10.2337/dc16-1324.
- Siri WE. Body composition from fluid spaces and density: analysis of methods. Tech Measuring Body Compos. 1961;61:223–244.
- García-Vega ÁS, Corrales-Agudelo V, Reyes A, Escobar JS. Diet quality, food groups and Nutrients associated with the gut microbiota in a nonwestern population. Nutrients. 2020;12(10):2938. doi:10.3390/nu12102938.
- Karasov TL, Almario J, Friedemann C, Ding W, Giolai M, Heavens D, Kersten S, Lundberg DS, Neumann M, Regalado J, et al. Arabidopsis thaliana and pseudomonas pathogens exhibit stable associations over evolutionary timescales. Cell Host & Microbe. 2018;24(1):168–79.e4. doi:10.1016/j.chom.2018.06.011.
- Droop AP. Fqtools: an efficient software suite for modern FASTQ file manipulation. Bioinformatics. 2016;32(12):1883–1884. doi:10.1093/bioinformatics/btw088.
- Jiang H, Lei R, Ding S-W, Zhu S. Skewer: a fast and accurate adapter trimmer for next-generation sequencing paired-end reads. BMC Bioinform. 2014;15(1):182. doi:10.1186/1471-2105-15-182.
- Ewels P, Magnusson M, Lundin S, Käller M. MultiQC: summarize analysis results for multiple tools and samples in a single report. Bioinformatics. 2016;32(19):3047–3048. doi:10.1093/bioinformatics/btw354.
- Rodriguez-R LM, Gunturu S, Tiedje JM, Cole JR, Konstantinidis KT. Nonpareil 3: Fast estimation of metagenomic coverage and sequence diversity. mSystems. 2018;3(3):e00039–18. doi:10.1128/mSystems.00039-18.
- Franzosa EA, McIver LJ, Rahnavard G, Thompson LR, Schirmer M, Weingart G, Lipson KS, Knight R, Caporaso JG, Segata N, et al. Species-level functional profiling of metagenomes and metatranscriptomes. Nat Methods. 2018;15(11):962–968. doi:10.1038/s41592-018-0176-y.
- de la Cuesta-Zuluaga J, Ley RE, Youngblut ND. Struo: a pipeline for building custom databases for common metagenome profilers. Bioinformatics. 2019;36(7):2314–2315. doi:10.1093/bioinformatics/btz899.
- Parks DH, Chuvochina M, Waite DW, Rinke C, Skarshewski A, Chaumeil P-A, Hugenholtz P. A standardized bacterial taxonomy based on genome phylogeny substantially revises the tree of life. Nat Biotechnol. 2018;36(10):996–1004. doi:10.1038/nbt.4229.
- R Core Team. R: A language and environment for statistical computing. 2018.
- Palarea-Albaladejo J, Martín-Fernández JA. zCompositions — R package for multivariate imputation of left-censored data under a compositional approach. Chemom Intellig Lab Syst. 2015;143:85–96. doi:10.1016/j.chemolab.2015.02.019.
- Quinn TP, Richardson MF, Lovell D, Crowley TM. Propr: An R-package for identifying proportionally abundant features using compositional data analysis. Sci Rep. 2017;7:16252. doi:10.1038/s41598-017-16520-0.
- van den Boogaart KG, Tolosana-Delgado R. “Compositions”: A unified R package to analyze compositional data. Comput Geosci. 2008;34(4):320–338. doi:10.1016/j.cageo.2006.11.017.
- Quinn TP, Erb I, Gloor G, Notredame C, Richardson MF, Crowley TM. A field guide for the compositional analysis of any-omics data. Gigascience. 2019;8(9):giz107. doi:10.1093/gigascience/giz107.
- Ho DE, Imai K, King G, Stuart EA. Matching as nonparametric preprocessing for reducing model dependence in parametric causal inference. Polit Anal. 2007;15(3):199–236. doi:10.1093/pan/mpl013.
- Oksanen J, Simpson G, Blanchet F, Kindt R, Legendre P, Minchin P, O’Hara R, Solymos P, Stevens M, Szoecs E, et al. Vegan: community ecology package. R Package Version 2.3. https://CRAN.R-project.org/package=vegan.
- Mallick H, Rahnavard A, McIver LJ, Ma S, Zhang Y, Nguyen LH, Tickle TL, Weingart G, Ren B, Schwager EH, et al. Multivariable association discovery in population-scale meta-omics studies. PLoS Comput Biol. 2021;17(11):e1009442. doi:10.1371/journal.pcbi.1009442.
- Mirzayi C, Renson A, Zohra F, Elsafoury S, Geistlinger L, Kasselman LJ, Eckenrode K, van de Wijgert J, Genomic Standards Consortium, Massive Analysis and Quality Control Society, et al. Reporting guidelines for human microbiome research: the STORMS checklist. Nat Med. 2021;27(11):1885–1892. doi:10.1038/s41591-021-01552-x.