
ABSTRACT
Shifts in the gut microbiota composition, called dysbiosis, have been directly associated with acute and chronic diseases. However, the underlying biological systems connecting gut dysbiosis to systemic inflammatory pathologies are not well understood. Phospholipids (PLs) act as precursors of both, bioactive inflammatory and resolving mediators. Their dysregulation is associated with chronic diseases including cancer. Gut microbial-derived lipids are structurally unique and capable of modulating host’s immunity. Lactobacillus johnsonii N6.2 is a Gram-positive gut symbiont with probiotic characteristics. L. johnsonii N6.2 reduces the incidence of autoimmunity in animal models of Type 1 Diabetes and improves general wellness in healthy volunteers by promoting, in part, local and systemic anti-inflammatory responses. By utilizing bioassay-guided fractionation methods with bone marrow-derived dendritic cells (BMDCs), we report here that L. johnsonii N6.2 purified lipids induce a transcriptional signature that resembles that of migratory (mig) DCs. RNAseq-based analysis showed that BMDCs stimulated with L. johnsonii N6.2 total lipids upregulate maturation-mig related genes Cd86, Cd40, Ccr7, Icam1 along with immunoregulatory genes including Itgb8, Nfkbiz, Jag1, Adora2a, IL2ra, Arg1, and Cd274. Quantitative reverse transcription (qRT)-PCR analysis indicated that PLs are the bioactive lipids triggering the BMDCs response. Antibody-blocking of surface Toll-like receptor (TLR)2 resulted in boosted PL-mediated upregulation of pro-inflammatory Il6. Chemical inhibition of the IKKα kinase from the non-canonical NF-κB pathway specifically restricted upregulation of Il6 and Tnf. Phenotypically, PL-stimulated BMDCs displayed an immature like-phenotype with significantly increased surface ICAM-1. This study provides insight into the immunoregulatory capacity of Gram-positive, gut microbial-derived phospholipids on innate immune responses.
Introduction
Alterations in bacterial diversity lead to microbiota structural imbalances in the gut called dysbiosis. Important shifts in the microbiota composition have been extensively documented and directly associated with acute and chronic diseases.Citation1–3 But the underlying biological systems explaining such correlations are poorly described. Certainly, dysbiosis has been attributed as a major cause of several inflammatory and autoimmune disorders, including diabetes, inflammatory bowel disease (IBD), and rheumatoid arthritis. However, the mechanisms connecting gut dysbiosis and systemic effects linked to such specific pathologies are not well understood.Citation4 Gut dysbiosis can be corrected by using fecal transplant obtained from healthy donors, as well as by using therapeutic probiotics.Citation5 Specific bacterial strains used as probiotics can contribute to restore the gut microbiota balance and modulate the immune response. Several microbial-derived bioactive metabolites such as short-chain fatty acids (SCFAs), tryptophan metabolites, and secondary bile acids diffuse through the mucosa, interact with specific receptors and regulate host’s physiology and immunity.Citation6–8
The immune system surveillance in the gut epithelium is mainly performed by antigen presenting cells (APCs), also called dendritic cells (DCs). These specialized cells work as a direct link between innate and adaptive immune responses. After up taking a new antigen (Ag), DCs intracellularly process it and present it to T cells in the draining lymph nodes (LNs), triggering the activation of adaptive immunity. Thus, DCs are distributed in both lymphoid and non-lymphoid tissues, displaying great heterogeneity regarding their functional and maturation state.Citation9 While DCs present peptide Ags and activate conventional T cells for the initiation of adaptive immune responses, they also control the tolerogenic response, and as such, are key modulators of the host’s overall immunity.Citation10 DCs can sense, process, and present lipid Ags through their CD1d molecules, for the stimulation of invariant NKT (iNKT) cells and subsequent modulation of immune responses.Citation11 In the gut, DCs are distributed throughout the intestinal mucosa and play a central role in maintaining intestinal immune homeostasis, as they are the sentinel cells that control both innate and adaptive immunity in such an Ag-diverse environment.Citation12
Lipids are increasingly being recognized for their signaling roles in fundamental cellular processes such as cell proliferation, survival, apoptosis, and cell metabolism. In fact, they are key bioactive mediators of inflammatory responses, and their dysregulation is involved in the development of chronic diseases including rheumatoid arthritis, inflammatory bowel disease, diabetes, and cancer.Citation13,Citation14 Structurally, they are highly diverse molecules with over 40,000 species, divided into eight basic categories according to their structure.Citation15 Particularly, phospholipids are a diverse group of lipids with important signaling properties. Endogenous phospholipids act as precursors of either bioactive lipid mediators of inflammation (mainly eicosanoids) or of bioactive resolving mediators of inflammatory responses (lysophospholipids and endocannabinoids).Citation14 While endogenous signaling phospholipids have been widely studied and their indispensable roles in tissue homeostasis are actively being determined, little is known about the involvement of gut commensal-derived lipids in the modulation of host’s immunity.
We recently reported the immunological properties of Lactobacillus johnsonii nanovesicles isolated directly from the bacterial culture supernatants.Citation16 L. johnsonii N6.2 nanovesicles, composed of a complex lipid profile, surface proteins, and nucleic acids, were able to induce a strong innate immune response in vitro.Citation17 Those in vitro results showed a direct correlation with the presence of IgA and IgG antibodies in human blood samples from healthy adults consuming the probiotic.Citation16 Nonetheless, the specific components of these complex nanovesicles prompting the immune response were not yet identified.
Unique, gut-microbial derived lipids have been recently characterized in the murine intestine.Citation18 Strikingly, these microbial-derived lipids are structurally different from host’s endogenous lipids and are emerging as active modulators of host’s immunity.Citation19–21 The involvement of sphingolipids, specifically α-galactosylceramides (α-GalCers), derived from the Gram-negative bacteria and gut symbionts Bacterioides spp., on the homeostasis of gut immune cell is well documented.Citation19,Citation22–24 Recently, phospholipids and ornithine lipids derived from Akkermansia muciniphila were described as modulators of the innate immune response.Citation21,Citation25 Indeed, the participation of microbial components (including bacterial-derived lipids) in maintenance of host’s health has been described for several species of the Bacteroidetes and Verrucomicrobia families.Citation21,Citation25–28 Undoubtedly, the involvement of bacterio-lipids in host’s gut homeostasis is driving a strong scientific interest.
The central goal of the present article was to evaluate the immune-stimulating properties of lipids synthesized by L. johnsonii N6.2, a probiotic strain with proven beneficial effects on humans’ immune system.Citation29 L. johnsonii N6.2 is a gut symbiont isolated from the gut of diabetic resistant rats. This bacterial strain presents probiotic characteristics and has been demonstrated to 1) delay the onset of Type 1 Diabetes (T1D) in diabetic prone (BBDP) rats, 2) modulate host’s phospholipid dynamics under a high fat diet and 3) improve general wellness in healthy adults.Citation29–31 L. johnsonii N6.2 exerts its effect, in part, by interacting with the innate and adaptive immune system; inducing a Th17 cell bias in mesenteric lymph nodes of BBDP rats and modulating innate and adaptive immune cell populations in healthy volunteers.Citation29,Citation32 By combining transcriptional and phenotypical analyses in cell-based assays, we report here that L. johnsonii N6.2 phospholipids are immunogenic and induce a migratory-regulatory-like transcriptional signature in BMDCs.
Results
Purified lipids induce a gene expression pattern in bone marrow-derived dendritic cells
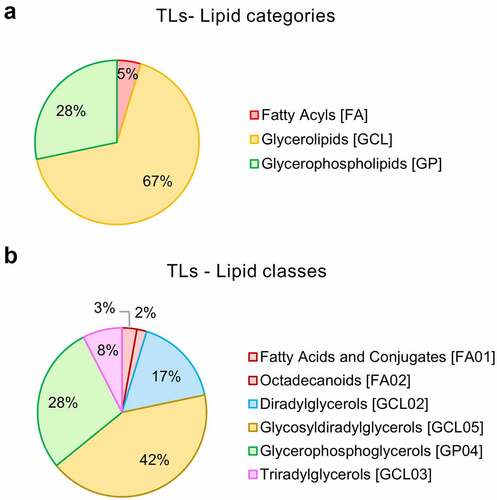
Qualitative lipidomic profiling of L. johnsonii N6.2-purified lipids revealed that total lipids (TLs) from L. johnsonii N6.2 are comprised of 67% glycerolipids (as glycosyldiradylglycerols (42%), diradylglycerols (17%), and triradylglycerols (8%)); 28% glycerophospholipids (as glyerophosphoglycerols) and 5% fatty acids (including 3% of fatty acids and conjugates and 2% octadecanoids) (). The lipidomic features detected for L. johnsonii N6.2 TLs as spectral (MS-2) annotations are displayed in Table S1. A total of 106 annotations were identified by spectral matching, representing only 6% of total readouts (see Table S2).
Figure 1. Global lipidomics analysis of Lactobacillus johnsonii N6.2 total lipids (TL). Total lipids from L. johnsonii N6.2 were purified and pooled from a large-scale culture and profiled by qualitative LC-MS/MS analysis. a: Percentage abundances in lipid categories. b: Percentage abundances in lipid classes. The abbreviation GCL for glycerolipids was selected to avoid confusion with GL (denotation used for the glycolipid fraction obtained after lipid fractionation of L. johnsonii N6.2 total lipids).
To determine the immune-stimulating properties of L. johnsonii N6.2-purified lipids, we generated rat BMDCs and stimulated the cultures with TLs. Cytotoxicity of the purified lipids was assessed by the 3-(4,5-dimethylthiazol-2-yl)-2,5-diphenyltetrazolium bromide (MTT) assay. No significant detrimental effects were found (Figure S1a). Complementary, cell viability was also assessed by flow cytometry during each assay and determined to consistently be over 95% (Figure S1b). The lipid samples were used as a homogeneous emulsion in PBS buffer pH 7.2. This assay was carried out in 7-day-old cultures having 106 BMDCs per treatment. The cells were stimulated for 6 h with 600 ng/mL of L. johnsonii N6.2 TLs. The TL concentration tested was previously titrated and selected based on its stimulatory capability as determined by gene expression changes (Figure S2). We measured the induction of Il6, Il10 and Tnf to evaluate the stimulatory capacity of the TLs obtained (Figure S2a) and posteriorly, expression of Il6 and Il10 for each lipid fraction assayed (Figure S2b). A minimum stimulation period of 6 h was determined to be enough to reproducibly follow the changes in gene expression among TLs and the fractions. In addition, stimulations with TLs from representative Gram-positive and Gram-negative bacteria showed that L. johnsonii N6.2 TLs induce a significantly distinct gene expression profile for the genes evaluated (Figure S3).
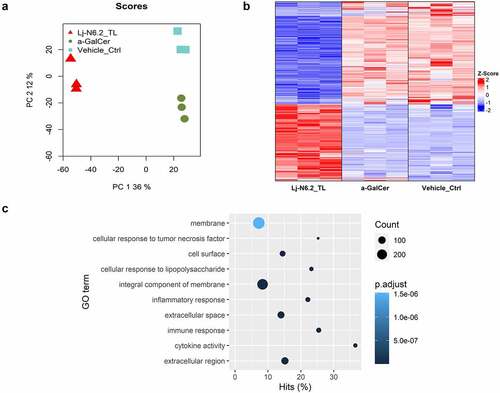
We used 100 ng/mL of synthetic α-GalCer (KRN700) or the vehicle control to compare the global stimulation patterns obtained with L. johnsonii N6.2 TLs. RNAseq-based analysis demonstrates that stimulation of BMDCs with TLs induces a distinct pattern of gene expression. We identified 2515 significantly differentially expressed genes (DEGs) (p.adjust < 0.01, |log2FC| > 0.3) when compared to the prototypical α-GalCer. When the samples were compared to the vehicle control (), 2283 genes exhibited differential expression (p.adjust < 0.01, |log2FC| > 0.3, Table S3). From this group of DEGs, we selected Il6, Il10, Tlr2, Tlr4, Adora2a and Cyp2s1 as representative genes of TL-response, to be analyzed in the subsequent assays performed. Thus, we used the expression pattern of those selected genes as quality control to certify that the BMDCs generated in each batch will display similar responses in all subsequent assays. The same genes were used to evaluate the effects of the lipid fractions separated by chromatographic methods. In all cases, the expression of these response-markers was monitored by qRT-PCR.
Figure 2. RNAseq-based global evaluation of BMDCs responses to total lipids derived from Lactobacillus johnsonii N6.2. a: Principal component analysis of treatment groups (Lj-N6.2_TL: L. johnsonii N6.2-TL-treated group; a-GalCer: α-GalCer-treated group; and Vehicle_control). b: Heatmap of total significantly differentially expressed genes (DEG) in Lj-N6.2_TL group (p.adjust < 0.01). The data showed a specific expression signature induced by total lipids from L. johnsonii N6.2 on BMDCs. c: Gene ontology enrichment analysis of DEG in L. johnsonii N6.2 treatment with absolute values of log2FC ≥ 1. Data represent three independent assays.
To rule out possible L. johnsonii N6.2 exopolysaccharide (EPS) contamination in our lipid extractions, we stimulated BMDCs with EPS extracted from the same strain. The polymer was extracted from both the cell culture medium and that associated with bacterial cells. Our results showed that BMDCs stimulated with TLs from L. johnsonii N6.2 significantly upregulate Il6, Tlr2, and Adora2a; and downregulate Tlr4 and Cyp2s1 to a greater magnitude when compared to EPS from the same bacteria. Both EPS and TLs significantly induce Il10 at similar levels (Figure S4).
L. johnsonii N6.2 lipids suppress the inflammatory response
Given the extent of significant DEGs, we conducted Gene Ontology (GO) enrichment analysis using DEGs with an absolute log2FC ≥ 1 (719 DEGs). shows the top 10 significantly enriched GO terms (p.adjust < 0.01, for a full list see Table S4). BMDCs exposed to L. johnsonii N6.2 TLs are responding to the stimulus as it was expected. The significant biological processes affected (BPs) corresponded to: “immune response” (GO:0006955), “inflammatory response” (GO:0006954), “cellular response to tumor necrosis factor” (GO:0071356) and interestingly, “cellular response to lipopolysaccharide” (GO:0071222). These results are intriguing because L. johnsonii N6.2 is a Gram-positive bacterium that does not produce LPS. Furthermore, “response to bacterium” (GO:0009617) and “response to molecule of bacterial origin” (GO:0002237) were also enriched (p.adjust < 0.01, Table S4). Remarkably, the cellular components (CCs) that corresponded to “extracellular region” (GO:0005576), “extracellular space” (GO:0005615), “integral component of membrane” (GO:0016021), “cell surface” (GO:0009986) and “membrane” (GO:0016020) () were also over-stimulated by the treatment.
The results also showed 14 GO terms of positive regulation and 8 GOs of negative regulation. Interestingly, the negatively regulated group is composed of several BPs related to immune/inflammatory responses (see Table S4). Interferon-gamma, tumor necrosis factor, interleukin-12, NF-kappaB transcription factor activity, and the inflammatory response (see Figure S5a) were classified in this negatively regulated group. The top 10 BPs of positive regulation included cytokine production, angiogenesis-related genes, and the peptidyl-tyrosine phosphorylation pathway (see Figure S5b).
The GO enrichment analysis altogether with the results obtained with the RNAseq-based exploratory assay and pair-wise differential expression analyses suggest that TLs from L. johnsonii N6.2 exert a transcriptional signature upon stimulation of BMDCs.
BMDC maturation and regulatory factors are upregulated after TLs induction
To perform a deeper analysis of the BMDCs response, we selected DEGs with a transcriptional change higher than |log2FC| > 2; a total of 293 were included in this group. displays the expression patterns of selected DEGs; the figure includes positively and negatively regulated genes.
Figure 3. RNAseq-based analysis of BMDCs response to total lipids derived from L. johnsonii N6.2. Heatmap displays selected DEGs with absolute values of log2FC between 1 and 2 and greater than 2 (p.adjust < 0.01). Total lipids (TLs) from L. johnsonii N6.2 significantly upregulate several regulatory molecules involved in the regulation and suppression of immune responses. The graphic displays the results obtained from three independent assays.
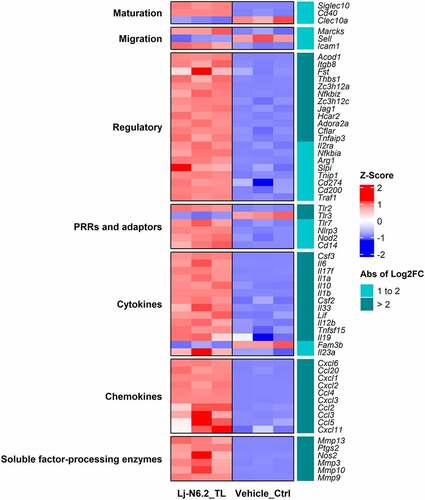
DCs stimulated with TLs from L. johnsonii N6.2 induced transcriptional upregulation of cytokines and chemokines, including Il6, Il17f, Il1a, Il1b, Il12b, Il23a, Ccl2–5, Cxcl1–3, Cxcl6, Cxcl20, and the anti-inflammatory cytokine Il10. High induction of hematopoietic growth factors such as colony stimulating factor 2 and 3 (Csf2, Csf3) was also observed. Pattern recognition receptors (PRR) such as Toll-like receptor (Tlr)-2, Tlr7 and Nucleotide-binding oligomerization domain 2 (Nod2) were also induced. Interestingly, Tlr3 and Tlr4 were downregulated. Matrix metalloproteases Mmp3, Mmp9, Mmp10, and Mmp13, known to process and regulate the extracellular milieu of soluble factors, were highly upregulated (logFC >2) along with the prostaglandin E2-producing enzyme Ptgs2 and inducible nitric oxide synthase (iNOS, gene Nos2).
Intriguingly, L. johnsonii N6.2 TLs induced the expression of Siglec10 while downregulating Clec10a; both markers characteristic of the immature state.Citation33 Furthermore, the BMDCs displayed weak to moderate upregulation of co-stimulatory molecules Cd40, Cd86, and downregulation of Cd83. These genes are associated with DC maturation. Nonetheless, moderate upregulation of migration markers Marcks, Icam1, Ccr7, and Fscn1 along with moderate downregulation of L-selectin or CD62L (gene Sell, Log2FC = −1.5) was also observed. These molecules are important for the migration of DCs present in nonlymphoid-tissues to the draining lymph nodes to regulate T-cell immunity.Citation9,Citation34
L. johnsonii N6.2-TL stimulation induced high upregulation of a selected group of immunoregulatory molecules. This includes direct or indirect T cell suppressors ( – Regulatory category). As such, upregulation of Adora2a (encoding the adenosine A2A receptor), Jag1 (encoding Jagged-1, a Notch ligand), Itgb8 (encoding the integrin subunit beta 8), Zc3h12a (encoding the endonuclease Regnase-1), Hcar2 (encoding the hydroxycarboxylic acid receptor 2 or GPR109A) and negative regulators of Nf-κB signaling was observed. This is associated to the upregulation of Arg1, Cd200, Il2ra (encoding CD25), Cd274 (encoding PD-L1). Other regulatory molecules such as Il4i1, Aldh1a2, and the suppressor of cytokine signaling (Socs) 1 showed lower levels of induction. Interestingly, Fam3b, a pro-apoptotic cytokine associated with diabetogenic pancreatic cells,Citation35 was highly downregulated (Log2FC = −2.2). This result correlates with the ability of this strain to mitigate the incidence of T1D in Bio-Breeding diabetic prone rats (a rat strain that spontaneously develops a T-cell dependent autoimmune disease comparable to T1D in humans) as previously published.Citation30
Transcriptomic analyses of DC subsets have revealed that DCs undergoing maturation and activation display a similar transcriptional signature regardless of their ontology. Similarly, steady-state migratory-like DCs also share a particular signature of immunoregulatory genes irrespective of their tissue or lineage origin.Citation9,Citation36 Rat BMDCs generated with CSF2/granulocyte/macrophage colony-stimulating factor (GM-CSF) and FLT3L represent a heterogeneous population that comprises mainly of classical (c)DCs and some plasmacytoid (p)DCs.Citation37 Indeed, the expression of classical-related genes for these DC populations was varied in our transcriptomic analysis (see Figure S6). We observed upregulation of the cDC-related genes: Itgax (encoding CD11c) and Glipr2 along with downregulation of other cDC-related genes such as Ifi30, Ly86, Entpd1, and Siglec1. Nonetheless, classical cDC2-related genes Itgam (encoding CD11b) and Nfil3 were upregulated while cDC1-related genes Irf8, Itgae and the typical pDC-related gene Ptcra were downregulated.Citation38,Citation39 We also observed downregulation of Clec10a, and upregulation of the monocyte-related gene CD14. These results suggest that the dendritic cells are polarized toward the cDC2-like subsets cDC2A and DC3, respectively.Citation38,Citation39
In summary, our analysis of expression patterns allowed us to conclude that BMDCs stimulated with L. johnsonii N6.2 TLs displayed a cDC2-related transcriptomic profile with a migratory-regulatory-like transcriptional signature.
Purified phospholipids induce a similar gene expression than TLs
TLs from L. johnsonii N6.2 are comprised of glycerolipids (glycosyldiradylglycerols, diradylglycerols and triradylglycerols), glycerophospholipids, and fatty acids as determined by mass spectroscopy (MS-2) ( and Table S1). We have utilized a bioassay-guided fractionation to further separate L. johnsonii N6.2-purified lipids and determine the bioactive lipid fraction with the capability to stimulate DCs. We obtained the following fractions: simple lipids (SL, nonpolar and fatty acids), glycolipids (GL), and phospholipids (PL) by silica gel column chromatography. The fractionation was performed using the modified Frostegård method described by Dickson et al.Citation40 Analysis of the fractions (SL, GL, and PL) revealed that the method produced only negligible amounts of carryover of lipid species when the fractions were compared (see Figure S7a).
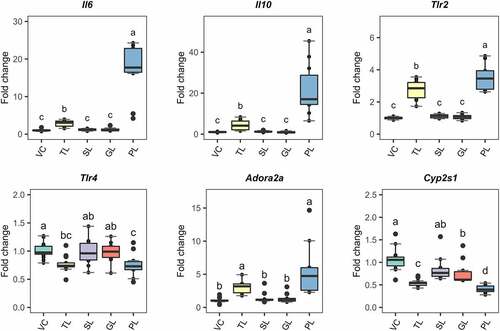
These fractions were used to challenge DCs using identical procedures to those described for the RNAseq-based experiment. 7-day BMDCs were stimulated during 6 h with either 0.5 µg/mL of TLs (as a control) or 5 µg/mL of the respective lipid fractions. These concentrations were selected to ensure that the cells would get sufficient stimulation to detect reproducible changes in gene expression with qRT-PCR. To compare the effects of each fraction, we quantified the expression of Il6, Il10, Tlr2, and Adora2a (). We also included Tlr4 and Cyp2s1; these genes were downregulated in the RNAseq analysis. The PL fraction resulted in significant differential expression (p.value < 0.05) of the selected response-markers. The impact on the gene transcription was higher or similar when the values were compared to those observed using TLs. As such, PLs from L. johnsonii N6.2 induced significant upregulation of Il6, Il10, and Tlr2 at a higher magnitude when compared to TLs and greater downregulation of Cyp2s1. Similar changes were observed for Tlr4 and Adora2a. The GL fraction induced significant downregulation of Cyp2s1 but at lower extent when compared to TLs and the PL fraction.
Figure 4. Gene expression of selected response-markers after fractionation of L. johnsonii N6.2 lipids into simple lipids (SL), glycolipids (GL) and phospholipids (PL). BMDCs were stimulated with total lipids (TL) at 500 ng/mL or three different fractions, at 5 µg/mL (SL, GL, and PL) for 6 h. VC: Vehicle control. The graphic displays the results obtained from three independent assays. Different letter labels denote statistically significant changes (p.value < 0.05).
L. johnsonii N6.2 phospholipids stimulate an immature-migratory-like phenotype in BMDCs
Once DCs are exposed to Ags, DCs undergo phenotypic changes to increase their surface expression of MHC class I (MHC-I) and MHC class II (MHC-II), costimulatory molecules and cell migration molecules. As such, mature DCs are capable of migrating to draining lymph nodes for the efficient Ag presentation and initiation of T-cell immunity.Citation34,Citation41 Given that BMDCs stimulated with L. johnsonii N6.2 TLs highly upregulate gene expression of immunoregulatory molecules, we set out to determine their maturation state by measuring the surface expression of MHC-II, costimulatory molecules CD80, CD86 and CD40 and the migration marker ICAM-1 after L. johnsonii N6.2 TL- and lipid fractions stimulations.
To this end, BMDCs were stimulated with L. johnsonii N6.2 TLs or fractionated lipids (SL, GL, and PL) as described above and the levels of maturation markers on the cell surface were determined by flow cytometry. The fluorescence intensity levels for each marker are presented in as a log2 value of the ratio between the median fluorescence intensities (MFI) for each lipid stimulation (TL, SL, GL, and PL) and the MFI levels of the vehicle control-treated cells. The histogram overlays corresponding to significant changes are shown in Figure S8. Remarkably, the surface expression of CD86 was significantly and exclusively decreased (p.value < 0.05) only on BMDCs stimulated with L. johnsonii N6.2 PLs and no changes in the surface levels of MHC-II, CD80 and CD40 molecules were observed. Interestingly, the migration marker ICAM-1 was significantly and comparably increased (p.value < 0.05) on the surface of BMDCs stimulated with either L. johnsonii N6.2 TLs or PLs. Furthermore, the surface expression levels of the CD1d molecule, a non-polymorphic MHC-I-like transmembrane molecule that presents antigenic lipids to iNKT cells, was significantly decreased on SL-stimulated cells when compared to GL and PL-stimulated BMDCs.
Figure 5. Relative surface expression of maturation and migration markers in BMDCs normalized to vehicle-treated cells and presented as Log2 values. BMDCs were stimulated with total lipids (TLs) at 500 ng/mL or fractions at 5 µg/mL for 6 h. SL: simple lipids, GL: glycolipids, PL: phospholipids. PLs significantly reduce surface expression of CD86 and induce a sig. increase of migration marker ICAM-1. VC: Vehicle control. The graphic displays the results obtained from three independent assays. Different letter labels denote statistically significant changes (p.value < 0.05).
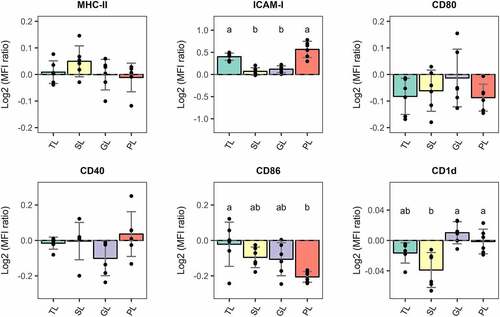
Overall, BMDCs stimulated with L. johnsonii N6.2 PLs for 6 h displayed an immature-migratory-like phenotype with no increase in the surface expression levels of MHC-II, and costimulatory molecules CD80, CD86, and CD40, but higher levels of the migratory marker ICAM-1.
Blockage of toll-like receptor 2 (TLR2) during BMDCs stimulation with phospholipids
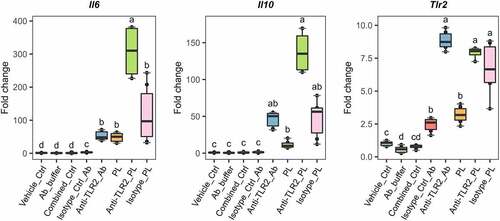
After BMDC stimulation with L. johnsonii N6.2 TLs, the expression of Tlr2 was significantly upregulated when compared to other Toll-like receptors (TLRs) (). To confirm the involvement of TLR2 in the response observed, we blocked the receptors on the surface of BMDCs with monoclonal anti-TLR-2 antibody (Ab). BMDCs were treated with anti-TLR2 and the isotype control Abs using a concentration of 9 µg/mL during 1 h before addition of L. johnsonii N6.2 PLs and further incubation for 6 more hours. As negative controls, cells were stimulated with the vehicle control (for PLs), the Ab storage buffer and both combined. BMDCs were also incubated with anti-TLR2 or isotype control Abs without the addition of L. johnsonii N6.2 PLs.
Strikingly, the specific blocking of TLR2 with antibodies significantly enhanced the PL-mediated upregulation of Il6 by six fold while Il10 did not reach significance (). The expression levels of Tlr2 upon TLR2 Ab-blocking and PL stimulation were not significantly different, suggesting that the signaling induced by L. johnsonii N6.2 PLs does not greatly induce Tlr2 expression. We also observed Tlr2 induction upon stimulations with anti-TLR2 and isotype control Abs alone. We reasoned that the induction observed may be mediated by basal Fc receptor activity on the BMDCs. Indeed, to rule out basal Fc-receptor activity in the results depicted in , we normalized gene expression changes to the isotype control treatment. The fold changes are depicted in Figure S9. This normalization of the data results in comparable statistically significant changes to the results presented in . Overall, these results suggest that TLR2 signaling limits upregulation of pro-inflammatory Il6 observed by the PL stimulation.
Figure 6. Antibody blocking of TLR2 on the surface of L. johnsonii N6.2 phospholipids-stimulated BMDCs. 7-day BMDCs were Ab-blocked with anti-TLR2 or isotype control Abs at 9 µg/mL for 1 h before addition of L. johnsonii N6.2 PLs at 5 µg/mL and further incubation for 6 h. Negative controls: vehicle control for PLs (Vehicle_ctrl), the Ab storage buffer (Ab_buffer) and both combined (Combined_ctrl). Ab controls: anti-TLR2_Ab and Isotype_Ctrl_Ab. Data was compared to Vehicle_Ctrl for statistical analysis. Data represent the values from three independent assays. Different letter labels denote statistically significant changes (p.value < 0.05).
Phospholipids from L. johnsonii N6.2 signal through the non-canonical NF-κB pathway
DCs are well equipped with a variety of pattern recognition receptors (PRRs) that recognize conserved microbial products generally known as pathogen-associated molecular patterns (PAMPs). DCs can sense a variety of PAMPs through TLRs and respond to the PAMP with a stimulus-specific gene expression program. A key feature of TLR signaling is the shared usage of NF-κB dimers downstream of TLR activation. Canonical NF-κB signaling in DCs regulates the pathogen-responsive gene expression patterns. As such, we utilized synthetic, cell permeable, NF-κB pathway inhibitors to determine whether the signaling induced by L. johnsonii N6.2 lipids was governed by the canonical NF-κB pathway. BMDCs were pre-incubated for 1 h with the IKKβ inhibitor IMD-0354 (IC50 = 250 nM, ab144823, Abcam) at three different concentrations (100, 250 and 500 nM) and with the IKKα inhibitor BMS-345541 (IC50 of 4 µM, ab144822, Abcam) at 5 µM. These inhibitors, and their concentrations, were selected to be able to discern canonical vs. non-canonical NF-κB signaling, as the non-canonical NF-κB pathway exclusively relies on the IKKα kinase alone.
After 1 h of incubation with the inhibitors, L. johnsonii N6.2 TLs or PLs were added to the cultures and incubated further for 6 more hours. As negative controls, cells were only incubated with the respective vehicle-controls (for L. johnsonii N6.2 lipids and synthetic inhibitors) combined as well as with the inhibitors alone for the duration of the assay. Cells were harvested and RNA was isolated for qRT-PCR gene expression analysis of Il6, Il10 and Tnf (the latter as a prototypical, pro-inflammatory and canonical NF-κB-regulated gene).
Remarkably, inhibition of the IKKβ kinase alone (with IMD-0354), and hence, of canonical NF-κB signaling did not alter the expression levels of all three genes analyzed when BMDCs were treated with TLs (Figure S10). We observed a significant downregulation of Il6 after PL stimulation only at the highest concentration of the inhibitor. However, there were not statistically significant differences between all three concentrations tested (Figure S10, left panel). Furthermore, the gene expression levels of Tnf were unchanged after IMD-0354 pre-treatment at all the concentrations evaluated in both TLs and PLs stimulations (Figure S10, right panel). These results suggest that canonical NF-κB signaling does not govern the gene expression patterns induced after L. johnsonii N6.2-lipid-stimulation of BMDCs.
Conversely, we observed a significant downregulation of Tnf to basal levels when the cells were pre-treated with BMS-345541 in both, TLs and PLs stimulations (, left panel). A similar and significant downregulation was observed with the expression levels of Il6 but only after stimulation of PLs (, right panel). The results observed for this gene after stimulation with TLs did not reach significance and may reflect the fact that TLs represent a mixture of L. johnsonii N6.2-purified lipids. Finally, gene expression levels of Il10 under BMS-345541 pre-treatment did not show significant differences for both, TL- and PL-stimulated BMDCs (, middle panel); suggesting that non-canonical NF-κB signaling does not play a central role in the control of this gene.
Figure 7. Blocking non-canonical NF-kB signaling in Lactobacillus johnsonii N6.2 lipid-stimulated BMDCs. 7-day BMDCs were pre incubated with the IKKα kinase inhibitor BMS-345541 at 5 µM for 1 h before addition of L. johnsonii N6.2 total lipids (TLs) or phospholipids (PLs) at 0.5 or 5 µg/mL respectively and further incubated for 6 h. Negative controls: vehicle control for L. johnsonii N6.2 lipids mixed with vehicle control for inhibitors (Vc_combined), NF- kB inhibitor alone. Data were obtained from three independent assays. Different letter labels denote statistically significant changes (p.value < 0.05).
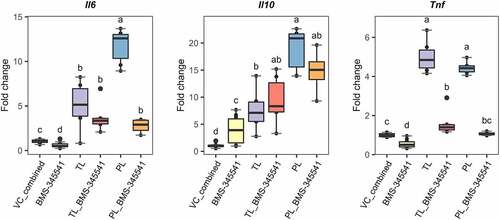
Overall, the results described above suggest that the transcriptional signature observed after stimulation of BMDCs with phospholipids from L. johnsonii N6.2 is controlled in part, by non-canonical NF-κB signaling, including that of pro-inflammatory genes (as evidenced by Il6 and Tnf).
Discussion
The impact of dietary lipids on the immunological system plays a central role in many chronic diseases.Citation19,Citation42 As such, studies discussing the importance of dietary fats are overly abundant in the scientific literature.Citation43,Citation44 Immunological scape of pathogens linked to the modification of lipids by lipolytic enzymes in local inflammatory responses is also meticulously described.Citation45 This vast amount of information contrasts with the scarcity of research papers describing the contribution of lipids synthesized by commensal bacteria on the tolerogenic immune response. The host has developed sophisticated mechanisms recognizing and accepting symbionts while rejecting pathogens. Commensals co-evolved with their host largely by promoting the development and education of a healthy immune system.Citation46 In this context, commensals-synthesized lipids play a major role in the tolerogenic process. Indeed, a correlation between A. muciniphila genome features and unique A. muciniphila lipid species in the cecum has been recently found.Citation25 Following this trend, recent studies have determined the immunoregulatory capacity of Gram-negative-commensal-derived lipids; like α-GalCers synthesized by Bacteroides spp.Citation19,Citation22–24,Citation27 and more recently, of phospholipids and ornithine lipids from A. muciniphila. Citation21,Citation25 However, the immunoregulatory capacity of Gram-positive-commensal-derived lipids has not yet motivated scientific attention.
We have previously shown that oral administration of L. johnsonii N6.2 induces a Th17 bias in the mesenteric lymph node of BBDP rats, consistent with immune stimulation exerted by the probiotic administration.Citation32 The stimulation of BMDCs with L. johnsonii N6.2-purified lipids induced upregulation of Il6, Il17f, Il1b, Il12b, and Il23a. When L. johnsonii N6.2 was administered as a live-probiotic preparation, the strain induced transcriptional upregulation of Il17a and Il23r, along with induction of Il6 and Il23 in the mesenteric lymph nodes of the animals.Citation32 The RNAseq-based analysis herein described could not identify induction of Il17a or Il23r, suggesting that upregulation of those genes may not be directly triggered by L. johnsonii N6.2-purified lipids. The cytokine receptors Il6r and Il17ra were downregulated (see Table S3), indicating that those cytokines might not act in an autocrine or in a trans-presenting manner.Citation47 While IL-23 and IL-1β support a cellular differentiation toward the Th17 effector module,Citation48 the expression of Il17f has been associated with nonpathogenic activity of TGF-β-polarized Th17 T cells.Citation49
IL-10 is a potent anti-inflammatory and immunosuppressive cytokine known to repress functions of various innate and adaptive immune cells. Therefore, it suppresses inflammatory cytokine burst, prevents host damage, and maintains tissue integrity (reviewed in detail in).Citation50 The induction of this cytokine in a pro-inflammatory context upon PRR stimulation mediates the resolution of inflammation after intestinal infections to restore homeostasis.Citation51–53 We have previously described the upregulation of this cytokine after stimulation of human THP1 macrophages with L. johnsonii N6.2 nanovesicles.Citation17 The results described herein suggest that the lipidic component of the nanovesicles may be responsible for such effects. Furthermore, the upregulation of anti-inflammatory cytokine Il10 appears to be a specific response to L. johnsonii N6.2 phospholipids (). This cytokine was not detected in culture supernatants of murine BMDCs and human monocytes stimulated with A. muciniphila phospholipids.Citation21 The opposite effect was observed with TNFα. This cytokine was released by the monocytes after stimulation with A. muciniphila phospholipids, whereas it was slightly upregulated as detected by qRT-PCR and undetected by our RNAseq study. The immune-stimulating effects observed by A. muciniphila phospholipids were TLR2-dependent. The effects obtained with L. johnsonii N6.2 phospholipids were not dependent on TLR2 because they were enhanced after TLR2-Ab specific blocking ().
Stimulation of BMDCs with L. johnsonii N6.2 lipids also induced the hematopoietic growth factors Csf2 (GM-CSF) and Csf3 (or granulocyte colony stimulating factor, G-CSF) along with several chemotaxis cytokines or chemokines: Ccl2–5, Ccl20, Cxcl1–3, Cxcl6, and Cxcl11. These molecules are important in cell migration as well as other biological processes, such as proliferation, survival, differentiation, and cytokine production. The chemokine groups CCL2–5 and CXCL1-3,6 mediate trafficking of innate immune cells, mainly of monocytes and granulocytes.Citation54 CCL20 binds to CCR6 that is expressed on mature DCs, Th17, CD8+ T cells, Treg, and B cells.Citation55–58 CXCL11 displays tolerogenic functions that restrain inflammatory autoimmune diseases. This chemokine induces Foxp3- regulatory T cells from both naïve T cells and disease-associated effector T cells in an autoimmune model.Citation59,Citation60 The induction pattern observed suggests that BMDCs stimulated with the probiotic lipids have the potential of mediating the migration of immune cells to the lymph nodes.
The obtained BMDCs displayed a cDC2-like transcriptional profile, evidenced by expression of Itgax (CD11c), Itgam (CD11b), and Nfil3 observed after the stimulation. This DC subset can migrate from peripheral tissues to local LNs, where they present Ags to T cells and prime T-cell effector responses.Citation12 Clec10a was downregulated, indicating that the BMDCs should be classified in the cDC2A subset.Citation39 cDC2A were shown to possess anti-inflammatory and tissue-repair functions, as they secreted less pro-inflammatory cytokines IL-6 and TNF-α and polarizing activity toward IFNγ or IL-17A producing T cells.Citation39
The purified lipids also induced the gene expression of Tlr2, Tlr7, Nlrp3, Nod2, and suppressed expression of Tlr3 and Tlr4 (see Table S3). A similar gene transcriptional pattern for Tlr2, Tlr3, and Tlr7 was observed in macrophages responding to L. johnsonii N6.2 nanovesicles. That is, downregulation of Tlr3 and upregulation of Tlr2 and Tlr7. Citation17 NOD2 is an intracellular microbial sensor for both Gram-negative and Gram-positive bacteria while NLRP3 is a cytoplasmic protein that senses cellular stress and intracellular damage upon pathogen uptake. The synergistic activity of both NOD2 and NLRP3 has been shown to induce a particular profile of maturation markers (MHC-II, CD80, CD86); cytokines (IL-1α, IL-1β, IL-6, IL-2, IL-23p19 and IL-12p40); and chemokines (CXCL1 and 2) in murine BMDCs.Citation61
We observed upregulation of costimulatory molecules Cd86 and Cd40, downregulation of Cd83 and upregulation of migratory markers Marcks, Icam1, Ccr7, and Fscn1 along with moderate downregulation of CD62L (Sell). DCs migrate from non-lymphoid tissues into the draining LNs to present processed Ags to T cells. These migDCs display a mature state characterized by upregulated surface expression of MHC-I and -II along with CD86 and CD40. migDCs can transport both self- and exogenous Ags, and therefore exert tolerogenic or inflammatory T-cell responses (tol-migDC and inf-migDC, respectively).Citation41 The surface expression levels of CD86 and CD40 along with MHC-II levels were not significantly increased. However, the migratory molecule ICAM-1 was highly increased at the surface of BMDC stimulated with both L. johnsonii N6.2-TLs and PLs. The phenotypic analysis of maturation markers supports the results transcriptionally observed (and described above). The downregulation of CD62L has been observed during T-cell activation and routinely reduced in these cells when transmigrating within LNs.Citation62 These results suggest maturation of L. johnsonii N6.2-lipid-stimulated BMDC into a tol-migDC-like phenotype. This phenotype has important implications regarding DC function, as clonal anergy of T cells has been shown to be induced upon cognate stimulation in the presence of MCH-II and ICAM-1.Citation63
Interestingly, we also observed upregulation of Jagged-1 (Jag1). This Notch ligand has been shown to contribute to cell proliferation and Treg induction, sustaining the immunosuppressive environment (Reviewed in.Citation64 Expression of Jagged-1 on mesenchymal stromal cells has been shown to induce expansion of existing Foxp3+ T reg cells.Citation65 This effect was partially dependent on PD-L1 interactions on DCs.Citation66 Indeed, an increased activation of peripheral memory Tregs after the washout period (p.value = 0.07) was observed after oral administration of live L. johnsonii N6.2 cells to healthy adults. While this trend did not reach significance, we hypothesize that L. johnsonii N6.2 lipids may play an important role in those observations.Citation29
The NF-κB family of transcription factors is widely known for its central role in coordinating cellular responses to external stimuli. NF-κB dimers regulate the transcription of genes that control inflammation, immune cell development, cell survival, and proliferation (extensively reviewed inCitation67,Citation68). Activation of canonical NF-κB signaling depends on the kinase IKKβ, whereas non-canonical signaling entirely relies on IKKα alone. The classical (canonical) NF-κB signaling is a hallmark of inflammatory challenge in both immune and nonimmune cells. It is activated by a variety of stimuli, including binding of PAMPs, damage-associated molecular patterns (DAMPs) and pro-inflammatory cytokines to their cognate receptors. Hence, dysregulations of canonical NF-κB signaling are contributed to the pathogenesis of various inflammatory diseases.Citation69,Citation70 Given the importance of the classical pathway in an immunological context, we assessed whether L. johnsonii N6.2-purified lipids trigger its activation in BMDCs. Strikingly, pre-treatment of BMDCs with the IKKβ inhibitor IMD-0354 did not significantly change the gene expression levels of Il6, Il10 and Tnf induced by L. johnsonii N6.2 TLs and PLs at all the concentrations tested (see Figure S10). In contrast, highly selective inhibition of IKKα (by BMS-345541) led to a significant downregulation of Il6 and Tnf to basal levels ().
Recent studies have demonstrated that the expression control of NF-κB-targeted genes is not only stimulus-specific but also cell type-specific.Citation71,Citation72 Moreover, crosstalk with non-canonical NF-κB signaling may either extend or restrain the duration of canonical NF-κB activation in a cell type-specific manner.Citation67,Citation73 In DCs, non-canonical NF-κB activity restrains maturation under steady-state conditions, but upon TLR ligation, canonical signaling is activated and regulates the expression of inflammatory gene programs and DC-surface activation markers.Citation74 While different PAMPs are known to activate canonical NF-κB signaling downstream of TLR-ligation,Citation72 little is known about the involvement of PAMPs, and particularly of commensal-derived bioactive lipids in stimulating DCs through a non-canonical NF-κB-manner. We observed that the gene expression of Tnf is specifically controlled by the non-canonical NF-κB pathway. This gene has been previously demonstrated to show a codependency either on canonical or non-canonical NF-κB transcription factors in DCs.Citation74 Moreover, Baratin et al.Citation75 demonstrated that homeostatic NF-κB signaling in DCs is required to maintain tissue immune tolerance, and that steady-state migDCs displayed a different NF-κB-regulated network of genes that support DC immune homeostasis as opposed to inflammatory conditions. Our NF-κB-inhibition experiments suggest that L. johnsonii N6.2-purified lipids activate a tol-mig-like gene expression program that is mediated in part by non-canonical NF-κB signaling. This response is hence highly specific to the stimulus presented and to the cells stimulated.
Cell-based assays identified the phospholipid (PL) fraction as the immune-stimulating, bioactive fraction. Phospholipids (specifically glycerophospholipids, GP) represent 28% of L. johnsonii N6.2-purified lipids (). Among those GPs, 90% represented diacylglycerophosphoglycerols or phosphatidylglycerols (PGs) (see Figure S7b). The major phospholipids in Lactobacillus spp. are cardiolipins (CLs), GPs and dihexaosyl diacylglycerols (DH-DGs).Citation16 Interestingly, GPs enriched in L. johnsonii N6.2 nanovesicles include PGs such as PG(16:0_18:1), PG(18:1_18:1), PG(17:1_20:2), PG(37:3) and PG(36:2).Citation16 The anionic pulmonary surfactant PG(16:0_18:1) or palmitoyl-oleoyl-PG (POPG) and the di-oleoyl PG (DOPG) or PG(18:1_18:1) have been shown to inhibit TLR2 and TLR4 activation in murine macrophages upon stimulation with either the TLR ligands LPS (TLR4), Pam3Cys (TLR2/1), MALP-2 (TLR2/6), lipoprotein (TLR2) or Mycoplasma pneumoniae membranes for POPG or with the antimicrobial peptide S100A9 for DOPG.Citation76,Citation77 Furthermore, the anti-inflammatory effects of DOPG on S100A9-stimulated macrophages are driven by inhibition of p65 (a canonical NF-κB TF) phosphorylation and translocation to the nucleus.Citation77 POPG also decreases influenza A viral-induced inflammation when administered to mice intranasally.Citation78 Moreover, drug delivery systems based on anti-inflammatory PGs are also being explored. As such, phosphatidylserine (PS) and PG as DOPS- or DOPG-formulated mixed micelles and liposomes were shown to suppress TNFα production from mouse peritoneal macrophages stimulated with IFNγ or LPS.Citation79
Overall, our analysis reveals that BMDCs stimulated with L. johnsonii N6.2-purified lipids share similar transcriptional signature to that of steady state migDCs, including upregulation of maturation-mig related genes Cd86, Cd40, Ccr7, Marcks, Icam1, and immunoregulatory genes that include Itgb8, Nfkbiz, Jag1, Hcar2, Adora2a, IL2ra, Arg1, Cd274, and Cd200. This gene expression program suggests the partial involvement of by TLR2-signaling and the non-canonical NF-κB pathway in a context- and cell type-specific manner. These BMDCs present a tol-migDC-like phenotype as determined by surface expression of maturation and migratory markers. Our results herein provide insights into how Gram-positive-commensal-derived bioactive lipids may regulate and educate cellular immunity in the gut and further suggest that L. johnsonii N6.2 lipid stimulated-BMDCs have the potential of dampening immune responses and induce/promote regulatory T cell responses, a subject of further investigation.
Experimental procedures
Bacterial cultures
L. johnsonii N6.2 was cultivated under anaerobic, static conditions in de Man, Rogosa, Sharpe (MRS) media. For EPS isolation, MRS media was subjected to ultracentrifugation (Beckman) at 175 000 × g for 2 h at 4°C followed by filter-sterilization (0.2 µm), to remove any EPS from the yeast extract present as part of the media formulation. L. johnsonii N6.2 was inoculated in MRS at 1% (v/v) and incubated at 37°C for 24 h for total lipid extraction, or for 48 h for EPS isolation. E. coli MG1655 and B. subtilis 168 were cultured in Luria-Bertani (LB) broth at 37°C for 24 h under shaking conditions.
EPS isolation
1 L cultures of L. johnsonii N6.2 grown for 48 h were harvested by centrifugation at 15,900 × g for 20 min at 4°C. The culture supernatant was collected as well as supernatants generated following the subsequent cell pellet washes. Cell pellet was resuspended and washed twice with PBS pH 7.2 and once with Milli-Q water. The washed biomass was frozen at −80°C overnight and freeze-dried (Labconco) for 24 h. The cell culture supernatant and wash supernatants were combined. EPS was extracted from both the cell biomass and the culture supernatants as separated procedures following the methods by Górska et al.Citation80 and Horn et al.,Citation81 respectively. In brief, freeze-dried biomass was treated with 10% TCA for 2.5 h at room temperature (RT) followed by centrifugation at 14 500 × g, 20 min. The EPS contained in the supernatant was then precipitated with 5× V of cold 96% ethanol overnight (kept at 4°C) and collected by centrifugation at 23 500 × g, 50 min. The pellet was resuspended in water (with gentle heating at 37°C if needed), dialyzed (in water) for 48 h, lyophilized and stored at 4°C.
EPS from the culture supernatants was precipitated by adding an equal volume of ethanol and incubated at 37°C overnight. Precipitated EPS was collected by centrifuging at 14 500 × g, 20 min. EPS in the pellet was resuspended in water (with gentle heating) and precipitated with 2× V of chilled (−20°C) ethanol. The EPS was recovered by centrifugation at 14 500 × g, 20 min. Precipitated EPS was resuspended in water and dialyzed for 72 h. Culture supernatant EPS was further purified by dissolving in 10% TCA overnight. Precipitated protein was removed by centrifugation at 10,000 × g for 15 min, 4°C. The supernatant pH was adjusted to 7 with 1 M NaOH and EPS was precipitated again with 2× Volume of chilled ethanol, centrifuged, and resuspended in water prior to its lyophilization and storage at 4°C.
EPS from bacterial cells and culture supernatants were further cleaned by resuspending in buffer (50 mM Tris-HCl pH 7.5, 10 mM MgCl2) and treating with DNase I (2 units/100 µL) and RNase H (5 units/100 µL) (New England Biolabs) at 37°C for 6 h followed by a proteinase K (Fisher scientific) treatment (100 ug/mL) overnight (37°C). After all digestions, EPS was re-purified as described above for culture supernatants, lyophilized, and stored at 4°C.
Total lipid extraction and fractionation
Bacterial cells from 24 h-L. johnsonii N6.2, E. coli MG1655, or B. subtilis 168 cultures were harvested by centrifugation at 15,900 × g for 20 min at 4°C. Cells were washed twice with 1% (w/v) NaCl, frozen at − 80°C overnight and freeze-dried (Labconco) for 24 h. Total lipids from the bacterial strains were extracted using a modified Bligh and Dyer method.Citation82 In short, one gram of freeze-dried cells was added into a clean glass separatory funnel. A total of 114 mL of solvents were added in sequence to achieve a final cloroform:methanol:water ratio of 1:2:0.8 (v/v/v). All solvents used were ACS or HPLC grade. The mixture was allowed to stand for 18 h with occasional shaking and subsequent phase separation was achieved by adding chloroform and water to reach a chloroform:methanol:water ratio of 1:1:0.9 (v/v/v). The lower chloroform phase was collected. The majority of the solvent was evaporated in a rotavapor (Buchi) at 474 mbar and a water bath of 40°C. Remaining solvent was evaporated under a nitrogen stream and dried lipid extractions were sealed in glass tubes and stored at −80°C.
Total lipids (TL) from L. johnsonii N6.2 were fractionated by column chromatography using a modified Frostegård method.Citation40 In brief, pooled total lipids extracted from a large-scale culture (14 g of freeze-dried biomass) were resuspended and combined in chloroform:acetic acid (100:1 v/v); and loaded to a column (3.2 × 45.7 cm) of oven-activated (125°C) silica gel 60 (0.063–0.200 mm, Millipore) conditioned with the same solvent mixture. A simple lipid fraction (SL, including fatty acids) was then eluted with chloroform:acetic acid (100:1 v/v, 1200 mL), followed by a glycolipid (GL) fraction eluted with acetone (2400 mL) and a phospholipid (PL) fraction eluted with methanol (1200 mL). The solvents were evaporated as indicated above. Individual lipid fractions were aliquoted as needed in glass tubes, and remaining solvent was evaporated under a stream of nitrogen. Dried lipid amounts obtained were measured gravimetrically. Lipid fractions were stored at −80°C until further use.
Untargeted qualitative lipidomics
Qualitative LC-MS/MS Analysis was performed to follow the lipid fractionation process. The service was provided by the Mass Spectrometry Research and Education Center, Department of Chemistry, University of Florida, Gainesville, FL, United States. Two biological aliquots of TL and lipid fractions (SL, GL and PL) were used for this analysis. Dried lipid samples were reconstituted in chloroform (TL), 1:1 DMSO:ethanol (SL and GL), and 1:1 chloroform:ethanol (PL) and diluted further in ethanol. A portion of the dilute sample was transferred to an autosample vial for LC-MS/MS analysis. The samples were analyzed by reversed phase (Acclaim PepMap C18) under a 70 min gradient. Mobile phases of isopropanol, acetonitrile, and water, both containing ammonium formate and formic acid was used for positive polarity LC-MS/MS and negative polarity LC-MS/MS. Eluent was analyzed on a QTOF-MS with data-dependent MSMS programmed for fragmentation of singly charged ions between m/z 500–1500 for positive mode and ions between m/z 250–1500 for negative mode. The MS(MS) data was then searched using lipidomic libraries in Metaboscape and SimLipid.
Animals
Sprague-Dawley (SD) rats were purchased from Charles River Laboratories (USA). Animals were housed under a 12-h light:dark cycle and controlled climate as prescribed by the Association for Assessment and Accreditation of Laboratory Animal Care. All animals were fed standard rodent chow and water ad libitum. Experiments were performed with 8–12 weeks old rats. All animal procedures were approved by the University of Florida Animal Care and Use Committee with protocol #202011186.
Primary cell cultures
Bone marrow progenitors were isolated from SD rats (8–12 weeks old) by flushing femurs with Hank’s Balanced Salt Solution (HBSS). Bone marrow progenitors were resuspended in RPMI-1640 supplemented with 10% heat-inactivated fetal bovine serum (FBS, Sigma), 2 mM L-glutamine (as GlutaMAXTM supplement), 50 µM 2-mercaptoethanol (Sigma), 100 units/mL of penicillin, 100 µg/mL streptomycin (complete medium, all components from Gibco unless otherwise stated). Complete RPMI-1640 medium was supplemented with 20 ng/mL of rat GM-CSF and 200 ng/mL of human FLT3-L (both from R&D Systems) to generate bone marrow-derived dendritic cells (BMDCs) (complete BMDC medium). BMDCs were cultured in non-treated T-75 flasks (Thermo Scientific) for 7 days at 37°C and 5% CO2 with medium changes every 2–3 days. On day 7, the loosely adherent and nonadherent cells were harvested for the cell-based assays. Flow cytometry with anti-rat CD11b/c antibody (Clone OX-42, BioLegend) was used to confirm the purity of 7-d non-adherent BMDCs. Figure S11 displays the gating strategy followed for flow cytometry analysis. Purity was routinely > 90%.
Lipid stimulation experiments
For our RNAseq-based experiment, TLs were resuspended in PBS pH 7.2. For our bioassay-guided fractionation experiments, TL, SL and GL were resuspended in DMSO:ethanol (1:1 v/v). PL was resuspended in DMSO:ethanol:PBS (1:1:2 v/v/v). Lipid suspensions were vortexed at max speed and heated up to 40°C for 10 min in a heat block to aid in resuspension. This process was repeated one more time before further dilutions. Working lipid suspensions were prepared by diluting 1:4 in PBS. The solvent mixture DMSO:ethanol:PBS (1:1:6 v/v) constituted the vehicle solution as it represented the mixture with the greater amount of solvents. Working suspensions were further diluted in the vehicle if needed prior to addition to complete BMDC medium. Equal volumes of working lipid suspensions were added to the medium to achieve the concentrations assayed. Synthetic α-GalCer (KRN700) was purchased from Adipogen, dissolved in DMSO following manufacturer’s recommendations, diluted 1:10 in PBS pH 7.2 and added to the cells at 100 ng/mL. 7-d nonadherent BMDCs were added to a 6-well non-treated plate (Thermo Scientific) at 106 cells per well in 3 mL of complete BMDC medium supplemented with either the lipid treatments or the vehicle control. Cells were incubated at 37°C and 5% CO2 for 6 h and harvested for RNA isolation and immunostaining.
MTT assay
7-d nonadherent BMDCs were added to a 96-well non-treated plate at 104 cells per well and 200 µL of complete BMDC medium supplemented with either the lipid treatments at evaluated concentrations or the vehicle control. Cells without any treatment were also assayed as a positive control. Complete BMDC medium alone was added as a blank control. Cells were incubated at 37°C and 5% CO2 for 7 h. After the incubation period, 20 µL of MTT (as a 5 mg/mL solution in PBS) was added to each well and further incubated for 2 more hours. Subsequently, the plate was centrifuged to pellet down the cells at 300 × g for 5 min, the culture medium removed and the MTT crystals were dissolved with 200 uL of acidified isopropanol (prepared by adding 50 mL of 2 M HCl to 2.5 L of isopropanol). The generated amount of blue formazan was determined spectrophotometrically at 570 nm.
RNAseq analysis
After isolation of total RNA, library construction and sequencing were performed by Novogene, (Novogene Co., Davis, CA, USA). A total amount of 1 µg RNA per sample was used as input material for the RNA sample preparations. Sequencing libraries were generated using NEBNext® Ultra TM RNA Library Prep Kit for Illumina® (NEB) following manufacturer’s recommendations and index codes were added to attribute sequences to each sample. Briefly, mRNA was purified from total RNA using poly-T oligo-attached magnetic beads. Fragmentation was carried out using divalent cations under elevated temperature in NEBNext First Strand Synthesis Reaction Buffer (5X) or by using sonication with Diagenode bioruptor Pico for breaking RNA strands. First strand cDNA was synthesized using random hexamer primer and M-MuLV Reverse Transcriptase (RNase H). Second strand cDNA synthesis was subsequently performed using DNA Polymerase I and RNase H. Remaining overhangs were converted into blunt ends via exonuclease/polymerase activities. After adenylation of 3’ ends of DNA fragments, NEBNext Adaptor with hairpin loop structure were ligated to prepare for hybridization. In order to select cDNA fragments of preferentially 150 ~ 200 bp in length, the library fragments were purified with AMPure XP system (Beckman Coulter). Then 3 µl USER Enzyme (NEB) was used with size-selected, adaptor-ligated cDNA at 37°C for 15 min followed by 5 min at 95°C before PCR. Then PCR was performed with Phusion High-Fidelity DNA polymerase, Universal PCR primers and Index (X) Primer. At last, PCR products were purified (AMPure XP system) and library quality was assessed on the Agilent Bioanalyzer 2100 system. The clustering of the index-coded samples was performed on a cBot Cluster Generation System using PE Cluster Kit cBot-HS (Illumina) according to the manufacturer’s instructions. After cluster generation, the library preparations were sequenced on an Illumina platform and paired-end reads were generated. Raw data (raw reads) of FASTQ format were firstly processed through fastp to generate clean reads.Citation83 Paired-end clean reads were mapped to the reference genome using HISAT2 software.Citation84 Novogene Co., Ltd Quantification FeatureCountsCitation85 was used to count the read numbers mapped of each gene.
Raw counts normalization and filtration, along with differential expression analysis were performed with RStudio version 2022.7.1.554 as follows: RNAseq length and GC content biases correction was performed with the EDAseq package v2.30.0Citation86 for both, within and between lane normalizations. Outlier detection was performed with the iterative leave-one-out (iLOO) approach, described by George et al.Citation87, and filtration of low-count data was performed with the NOISeq package v2.40.0.Citation88,Citation89 Exploratory analyses were performed with the graphical tools of NOISeq and ComplexHeatmap v2.12.1.Citation90,Citation91 Pairwise comparisons were performed with NOISeqBIO from the package NOISeq. The probability of differential expression applying NOISeqBIO is 1-FDR, where FDR is considered as an adjusted p-value and no further adjusting was performed. Significant differentially expressed genes (DEGs) were defined as those DEGs with a p.adjust < 0.01 and an absolute log2FC value greater than 0.3. Gene ontology (GO) enrichment analysis was performed with the package goseq v1.48.0Citation92 and over-represented p-values were adjusted with the Benjamini–Hochberg method.
RT-qPCR analyses
Total RNA was isolated with the RNeasy mini kit (Qiagen) according to the manufacturer’s instructions. DNA was digested with the TURBO DNA-freeTM kit (Invitrogen). cDNA was produced with the iScriptTM cDNA synthesis kit (Bio-Rad) and qPCR assays were performed using the PowerUp™ SYBR™ Green Master Mix (Applied Biosystems) in a QuantStudio 6 machine (Applied Biosystems). Glyceraldehyde-3-phosphate dehydrogenase (GAPDH) was used as an internal control in each experiment. All primers were designed to specifically bind rat cDNA. The sequence of primer used are shown in Table S5.
TLR2 blocking experiment
TLR2 on the surface of 7-d BMDCs was blocked by pre-incubating the cells with 9 µg/mL of recombinant monoclonal anti-rat TLR2 antibody (ab209217, Abcam) or isotype control (ab172730, Abcam) for 1 h prior to the addition of 5 µg/mL of L. johnsonii N6.2 PLs (as described above) and further incubation for 6 h. The antibody storage buffer (59% PBS pH 7.2, 40% glycerol, 0.05% BSA, 0.01% sodium azide) was prepared in-house and added at equal volumes as a negative control along with the vehicle control for the lipids. Cells were also treated with the Abs alone throughout the duration of the assay. 3∙10Citation5 BMDCs per well were assayed in 1 mL of complete BMDC medium in a 12-well non-treated plate (Thermo Scientific).
Inhibition of NF-κB signaling
The NF-κB signaling pathway was inhibited by 1 h pre-treatment with the IKKβ inhibitor IMD-0354 (IC50 = 250 nM, ab144823, Abcam) at three different concentrations (100, 250, and 500 nM) and with the IKKβ and IKKα inhibitor BMS-345541 (IC50 of 0.3 and 4 µM, respectively, ab144822, Abcam) at 5 µM. Stock solutions of the inhibitors at 25 mM were prepared in DMSO following manufacturer’s recommendations, further diluted in PBS pH 7.2 and added to complete BMDC medium as PBS-diluted solutions to achieve the concentrations analyzed. The vehicle control for the inhibitors constituted the least diluted DMSO:PBS solution (1:2). As a negative control, both vehicle controls (for lipids and inhibitors) were combined and added to the cells at equal volumes as their tested counterparts. The inhibitors alone were also assessed throughout the duration of the assay. L. johnsonii N6.2 lipids were added as TLs or PLs at 0.5 or 5 µg/mL and cells were stimulated for 6 additional hours. 3∙105 7-d BMDCs per well were assayed in 1 mL of complete BMDC medium in a 12-well non-treated plate (Thermo Scientific).
Flow cytometry
BMDCs phenotype was characterized with a panel of cell surface, fluorescent dye-conjugated/biotinylated mouse anti-rat antibodies (Abs). All centrifugation steps were performed at 300 × g, 5 min. An Ab cocktail was prepared by combining 50 µL of BD Horizon™ Brilliant Stain Buffer (BD Biosciences) with PerCP-OX-6 Ab (anti-MHC-II, BD Biosciences), PE/Cy7-OX-42 Ab (anti-CD11b/c, BioLegend), biotin-3H5 Ab (anti-CD80, Thermo Fisher Scientific), FITC-24F Ab (anti-CD86, BioLegend), APC-HM40-3 Ab (anti-CD40, Thermo Fisher Scientific), BV711-1A29 Ab (anti-ICAM-1, BD Biosciences) and BV421-WTH1 Ab (anti-CD1d, BD Biosciences). Cells were harvested by centrifugation and washed twice with PBS prior to viability staining with the eFluorTM 780 fixable viability dye (FVD) (Invitrogen) for 30 min at 4°C. Cells were washed twice with staining buffer (BioLegend) and blocked with mouse anti-rat CD32 Ab for 10 min. The Ab cocktail was then added, and cells were incubated for an additional 30 min at room temperature (RT). Cells were washed twice with staining buffer and fixed with the Cyto-Fast™ Fix/Perm Buffer Set (BioLegend) according to the manufacturer’s recommendations. Flow cytometry was performed with an Aurora 5 (Cytek) instrument and the data were analyzed with the FCS Express 7 Flow software.
Statistical analyses
RStudio was used to perform statistical analysis. To identify genes with statistically significant differences between treatments, a one-way ANOVA followed by a Tukey post-hoc test was performed. Median fluorescence intensity (MFI) values obtained from the immunophenotyping experiments were normalized to their respective vehicle control, converted into log2 values, and analyzed by a one-way ANOVA and a Tukey test as described for qRT-PCR data. Statistical significance was defined as p.value < 0.05.
Author contributions
AC designed and performed the experiments. LT, CG, AC and GL contributed to the conception and design of the study. CG supervised the study. AC analyzed the data. AC wrote the original draft. AC, LT, CG, and GL reviewed and edited the manuscript. All authors have read and agreed to the published version of the manuscript.
Supplemental Material
Download Zip (1.7 MB)Acknowledgments
The authors thank Dr. Laura S. Bailey and Dr. Kari B. Basso from the Mass Spectrometry Research and Education Center, Department of Chemistry, University of Florida, Gainesville, FL, United States, for their expertise and technical support, and to Camila Cardona, for her help as an undergraduate research volunteer in Dr. Gonzalez’s lab.
Disclosure statement
GL holds U.S. patent No. 9,474,773 and 9,987,313 on Lactobacillus johnsonii N6.2.
The remaining authors declare that the research was conducted in the absence of any commercial or financial relationships that could be constructed as a potential conflict of interest.
Data availability statement
RNAseq data is deposited at the Gene Expression Omnibus (GEO; accession number: GSE221588). Lipidomics data generated in this study is provided in this manuscript as Table S2. Datasets for Table S2 and Table S3 have been uploaded to the Zenodo repository and can be found following the DOIs: 10.5281/zenodo.8044437 and 10.5281/zenodo.8044444, respectively.
Supplementary material
Supplemental data for this article can be accessed online at https://doi.org/10.1080/19490976.2023.2252447
Additional information
Funding
References
- Kriss M, Hazleton KZ, Nusbacher NM, Martin CG, Lozupone CA. Low diversity gut microbiota dysbiosis: drivers, functional implications and recovery. Curr Opin Microbiol. 2018;44:34–22. doi:10.1016/J.MIB.2018.07.003.
- Cheng L, Qi C, Zhuang H, Fu T, Zhang X. gutMdisorder: a comprehensive database for dysbiosis of the gut microbiota in disorders and interventions. Nucleic Acids Res. 2020;48(D1):D554–D560. doi:10.1093/NAR/GKZ843.
- Wilkins LJ, Monga M, Miller AW. Defining dysbiosis for a Cluster of chronic diseases. Sci Rep. 2019;9(1):1–10. doi:10.1038/s41598-019-49452-y.
- Kim D, Zeng MY, Núñez G. The interplay between host immune cells and gut microbiota in chronic inflammatory diseases. Exp Mol Med. 2017;49(5):e339–e339. doi:10.1038/emm.2017.24.
- Dixit K, Chaudhari D, Dhotre D, Shouche Y, Saroj S. Restoration of dysbiotic human gut microbiome for homeostasis. Life Sci. 2021;278:119622. doi:10.1016/J.LFS.2021.119622.
- van der Hee B, Wells JM. Microbial regulation of host physiology by short-chain fatty acids. Trends Microbiol. 2021;29(8):700–712. doi:10.1016/J.TIM.2021.02.001.
- Scott SA, Fu J, Chang PV. Microbial tryptophan metabolites regulate gut barrier function via the aryl hydrocarbon receptor. Proc Natl Acad Sci USA. 2020;117(32):19376–19387. doi:10.1073/pnas.2000047117.
- Winston JA, Theriot CM Diversification of host bile acids by members of the gut microbiota. Gut Microbes. 2019;11(2):158–171. doi:10.1080/19490976.2019.1674124
- Miller JC, Brown BD, Shay T, Gautier EL, Jojic V, Cohain A, Pandey G, Leboeuf M, Elpek KG, Helft J, et al. Deciphering the transcriptional network of the dendritic cell lineage. Nat Immunol. 2012;13(9):888–899. doi:10.1038/ni.2370.
- Audiger C, Rahman MJ, Yun TJ, Tarbell KV, Lesage S. The importance of dendritic cells in maintaining immune tolerance. J Immunol. 2017;198(6):2223–2231. doi:10.4049/jimmunol.1601629.
- Keller CW, Freigang S, Lünemann JD. Reciprocal crosstalk between dendritic cells and natural killer T cells: Mechanisms and therapeutic potential. Front Immunol. 2017;8(MAY):570. doi:10.3389/fimmu.2017.00570.
- Luciani C, Hager FT, Cerovic V, Lelouard H. Dendritic cell functions in the inductive and effector sites of intestinal immunity. Mucosal Immunol. 2021;15(1):40–50. doi:10.1038/s41385-021-00448-w.
- Chiurchiù V, Leuti A, Maccarrone M. Bioactive lipids and chronic inflammation: Managing the fire within. Front Immunol. 2018;9(JAN):38. doi:10.3389/FIMMU.2018.00038.
- Leuti A, Fazio D, Fava M, Piccoli A, Oddi S, Maccarrone M. Bioactive lipids, inflammation and chronic diseases. Adv Drug Deliv Rev. 2020;159:133–169. doi:10.1016/J.ADDR.2020.06.028.
- Liebisch G, Fahy E, Aoki J, Dennis EA, Durand T, Ejsing CS, Fedorova M, Feussner I, Griffiths WJ, Köfeler H, et al. Update on LIPID MAPS classification, nomenclature, and shorthand notation for MS-derived lipid structures. J Lipid Res. 2020;61(12):1539–1555. doi:10.1194/JLR.S120001025.
- Harrison NA, Gardner CL, da Silva DR, Gonzalez CF, Lorca GL. Identification of biomarkers for systemic distribution of nanovesicles from Lactobacillus johnsonii N6.2. Front Immunol. 2021;12:3491. doi:10.3389/FIMMU.2021.723433.
- Teixeira LD, Harrison NA, da Silva DR, Mathews CE, Gonzalez CF, Lorca GL. Nanovesicles from Lactobacillus johnsonii N6.2 reduce apoptosis in human beta cells by promoting AHR translocation and IL10 secretion. Front Immunol. 2022;13:2829. doi:10.3389/FIMMU.2022.899413.
- Yasuda S, Okahashi N, Tsugawa H, Ogata Y, Ikeda K, Suda W, Arai H, Hattori M, Arita M. Elucidation of gut microbiota-associated lipids using LC-MS/MS and 16S rRNA sequence analyses. iScience. 2020;23(12):101841. doi:10.1016/J.ISCI.2020.101841.
- Oh SF, Praveena T, Song H, Yoo J-S, Jung D-J, Erturk-Hasdemir D, Hwang YS, Lee CC, Le Nours J, Kim H, et al. Host immunomodulatory lipids created by symbionts from dietary amino acids. Nature. 2021;600(7888):302–307. doi:10.1038/s41586-021-04083-0.
- Nagatake T, Kishino S, Urano E, Murakami H, Kitamura N, Konishi K, Ohno H, Tiwari P, Morimoto S, Node E, et al. Intestinal microbe-dependent ω3 lipid metabolite αKetoA prevents inflammatory diseases in mice and cynomolgus macaques. 2022;15(2):289–300. Mucosal Immunol. Published online January 10, doi:10.1038/S41385-021-00477-5.
- Bae M, Cassilly CD, Liu X, Park S-M, Tusi BK, Chen X, Kwon J, Filipčík P, Bolze AS, Liu Z, et al. Akkermansia muciniphila phospholipid induces homeostatic immune responses. Nature. 2022;608(7921):168–173. doi:10.1038/s41586-022-04985-7.
- Wieland Brown LC, Penaranda C, Kashyap PC, Williams BB, Clardy J, Kronenberg M, Sonnenburg JL, Comstock LE, Bluestone JA, Fischbach MA, et al. Production of α-galactosylceramide by a prominent member of the human gut microbiota. PLoS Biol. 2013;11(7):e1001610. doi:10.1371/JOURNAL.PBIO.1001610.
- An D, Oh SF, Olszak T, Neves J, Avci F, Erturk-Hasdemir D, Lu X, Zeissig S, Blumberg R, Kasper D, et al. Sphingolipids from a symbiotic microbe regulate homeostasis of host intestinal natural killer T cells. Cell. 2014;156(1–2):123–133. doi:10.1016/J.CELL.2013.11.042.
- von Gerichten J, Lamprecht D, Opálka L, Soulard D, Marsching C, Pilz R, Sencio V, Herzer S, Galy B, Nordström V, et al. Bacterial immunogenic α-galactosylceramide identified in the murine large intestine: dependency on diet and inflammation. J Lipid Res. 2019;60(11):1892–1904. doi:10.1194/jlr.RA119000236.
- Zhang Q, Linke V, Overmyer KA, Traeger LL, Kasahara K, Miller IJ, Manson DE, Polaske TJ, Kerby RL, Kemis JH, et al. Genetic mapping of microbial and host traits reveals production of immunomodulatory lipids by Akkermansia muciniphila in the murine gut. Nat. Microbiol. 2023;8(3):424–440. doi:10.1038/s41564-023-01326-w.
- Brown EM, Ke X, Hitchcock D, Jeanfavre S, Avila-Pacheco J, Nakata T, Arthur TD, Fornelos N, Heim C, Franzosa EA, et al. Bacteroides-derived Sphingolipids are critical for maintaining intestinal homeostasis and symbiosis. Cell Host & Microbe. 2019;25(5):668–680.e7. doi:10.1016/J.CHOM.2019.04.002.
- Johnson EL, Heaver SL, Waters JL, Kim BI, Bretin A, Goodman AL, Gewirtz AT, Worgall TS, Ley RE. Sphingolipids produced by gut bacteria enter host metabolic pathways impacting ceramide levels. Nat Commun. 2020;11(1):1–11. doi:10.1038/s41467-020-16274-w.
- Lee JS, Song WS, Lim JW, Choi T-R, Jo S-H, Jeon H-J, Kwon J-E, Park J-H, Kim Y-R, Yang Y-H, et al. An integrative multiomics approach to characterize anti-adipogenic and anti-lipogenic effects of Akkermansia muciniphila in adipocytes. Biotechnol J. 2022;17(2):2100397. doi:10.1002/BIOT.202100397.
- Marcial GE, Ford AL, Haller MJ, Gezan SA, Harrison NA, Cai D, Meyer JL, Perry DJ, Atkinson MA, Wasserfall CH, et al. Lactobacillus johnsonii N6.2 modulates the host immune responses: A double-blind, randomized trial in healthy adults. Front Immunol. 2017;8(JUN). doi:10.3389/fimmu.2017.00655.
- Valladares R, Sankar D, Li N, Williams E, Lai K-K, Abdelgeliel AS, Gonzalez CF, Wasserfall CH, Larkin J, Schatz D, et al. Lactobacillus johnsonii N6.2 mitigates the development of type 1 diabetes in BB-DP rats. PLoS One. 2010;5(5):e10507. doi:10.1371/journal.pone.0010507.
- Teixeira LD, Torrez Lamberti MF, DeBose-Scarlett E, Bahadiroglu E, Garrett TJ, Gardner CL, Meyer JL, Lorca GL, Gonzalez CF. Lactobacillus johnsonii N6.2 and blueberry phytophenols affect lipidome and gut microbiota composition of rats under high-fat diet. Front Nutr. 2021;8:785. doi:10.3389/FNUT.2021.757256/BIBTEX.
- Lau K, Benitez P, Ardissone A, Wilson TD, Collins EL, Lorca G, Li N, Sankar D, Wasserfall C, Neu J, et al. Inhibition of type 1 diabetes correlated to a Lactobacillus johnsonii N6.2-mediated Th17 bias. J Immunol. 2011;186(6):3538–3546. doi:10.4049/jimmunol.1001864.
- Gao Y, Li H, Li Z, Xie L, Liu X, Huang Z, Chen B, Lin X, Wang X, Zheng Y, et al. Single-cell analysis reveals the heterogeneity of monocyte-derived and peripheral type-2 conventional dendritic cells. J Immunol. 2021;207(3):837–848. doi:10.4049/JIMMUNOL.2100094/-/DCSUPPLEMENTAL.
- Liu J, Zhang X, Cheng Y, Cao X. Dendritic cell migration in inflammation and immunity. Cell Mol Immunol. 2021;18(11):2461–2471. doi:10.1038/s41423-021-00726-4.
- Cao X, Gao Z, Robert CE, Greene S, Xu G, Xu W, Bell E, Campbell D, Zhu Y, Young R, et al. Pancreatic-derived factor (FAM3B), a novel islet cytokine, induces apoptosis of insulin-secreting β-cells. Diabetes. 2003;52(9):2296–2303. doi:10.2337/diabetes.52.9.2296.
- Villar J, Segura E. Decoding the heterogeneity of human dendritic cell subsets. Trends Immunol. 2020;41(12):1062–1071. doi:10.1016/J.IT.2020.10.002.
- Ndiaye M, Warnecke A, Flytzani S, Abdelmagid N, Ruhrmann S, Olsson T, Jagodic M, Harris RA, Guerreiro-Cacais AO. Rat bone marrow-derived dendritic cells generated with GM-CSF/IL-4 or FLT3L exhibit distinct phenotypical and functional characteristics. J Leukoc Biol. 2016;99(3):437–446. doi:10.1189/jlb.1ab0914-433rr.
- Villani AC, Satija R, Reynolds G, Sarkizova S, Shekhar K, Fletcher J, Griesbeck M, Butler A, Zheng S, Lazo S, et al. Single-cell RNA-seq reveals new types of human blood dendritic cells, monocytes, and progenitors. Science. 2017;356(6335):479–87. 1979. doi: 10.1126/SCIENCE.AAH4573/SUPPL_FILE/AAH4573_VILLANI_SM.PDF.
- Brown CC, Gudjonson H, Pritykin Y, Deep D, Lavallée V-P, Mendoza A, Fromme R, Mazutis L, Ariyan C, Leslie C, et al. Transcriptional basis of mouse and human dendritic cell heterogeneity. Cell. 2019;179(4):846–863.e24. doi:10.1016/J.CELL.2019.09.035.
- Dickson L, Bull ID, Gates PJ, Evershed RP. A simple modification of a silicic acid lipid fractionation protocol to eliminate free fatty acids from glycolipid and phospholipid fractions. J Microbiol Methods. 2009;78(3):249–254. doi:10.1016/j.mimet.2009.05.014.
- Lutz MB, Backer RA, Clausen BE. Revisiting current concepts on the tolerogenicity of steady-state dendritic cell subsets and their maturation stages. J Immunol. 2021;206(8):1681–1689. doi:10.4049/JIMMUNOL.2001315.
- Radzikowska U, Rinaldi AO, Sözener ZÇ, Karaguzel D, Wojcik M, Cypryk K, Akdis M, Akdis CA, Sokolowska M. The influence of dietary fatty acids on immune responses. Nutrients. 2019;11(12):2990. doi:10.3390/NU11122990.
- Saika A, Nagatake T, Kunisawa J. Host- and microbe-dependent dietary lipid metabolism in the control of allergy, inflammation, and immunity. Front Nutr. 2019;6:36. doi:10.3389/fnut.2019.00036.
- González-Becerra K, Ramos-Lopez O, Barrón-Cabrera E, Riezu-Boj JI, Milagro FI, Martínez-López E, Martínez JA. Fatty acids, epigenetic mechanisms and chronic diseases: a systematic review. Lipids Health Dis. 2019;18(1):1–18. doi:10.1186/S12944-019-1120-6/FIGURES/2.
- Chen X, Alonzo F. Bacterial lipolysis of immune-activating ligands promotes evasion of innate defenses. Proc Natl Acad Sci U S A. 2019;116(9):3764–3773. doi:10.1073/pnas.1817248116.
- Gras S, van Rhijn I, Shahine A, le Nours J. Molecular recognition of microbial lipid-based antigens by T cells. Cell Mol Life Sci. 2018;75(9):1623–1639. doi:10.1007/S00018-018-2749-4.
- Heink S, Yogev N, Garbers C, Herwerth M, Aly L, Gasperi C, Husterer V, Croxford AL, Möller-Hackbarth K, Bartsch HS, et al. Trans-presentation of IL-6 by dendritic cells is required for the priming of pathogenic TH17 cells. Nat Immunol. 2016;18(1):74–85. doi:10.1038/ni.3632.
- Agalioti T, Villablanca EJ, Huber S, Gagliani N. TH17 cell plasticity: The role of dendritic cells and molecular mechanisms. J Autoimmun. 2018;87:50–60. doi:10.1016/J.JAUT.2017.12.003.
- Wanke F, Tang Y, Gronke K, Klebow S, Moos S, Hauptmann J, Shanmugavadivu A, Regen T, Mufazalov IA, Gabriel LA, et al. Expression of IL-17F is associated with non-pathogenic Th17 cells. J Mol Med (Berl). 2018;96(8):819–829. doi:10.1007/S00109-018-1662-5.
- Saraiva M, Vieira P, O’Garra A. Biology and therapeutic potential of interleukin-10. J Exp Med. 2020;217(1):e20190418. doi:10.1084/jem.20190418.
- Couper KN, Blount DG, Riley EM. IL-10: The master regulator of immunity to infection. J Immunol. 2008;180(9):5771–5777. doi:10.4049/JIMMUNOL.180.9.5771.
- Engelhardt KR, Grimbacher B. IL-10 in humans: Lessons from the gut, IL-10/IL-10 receptor deficiencies, and IL-10 polymorphisms. Curr Top Microbiol Immunol. 2014;380:1–18. doi:10.1007/978-3-662-43492-5_1/TABLES/1.
- Shouval DS, Ouahed J, Biswas A, Goettel JA, Horwitz BH, Klein C, Muise AM, Snapper SB. Interleukin 10 receptor signaling: Master regulator of intestinal mucosal homeostasis in mice and humans. Adv Immunol. 2014;122:177–210. doi:10.1016/B978-0-12-800267-4.00005-5.
- Chen K, Bao Z, Tang P, Gong W, Yoshimura T, Wang JM. Chemokines in homeostasis and diseases. Cell Mol Immunol. 2018;15(4):324–334. doi:10.1038/cmi.2017.134.
- Kim TG, Jee H, Fuentes-Duculan J, Wu WH, Byamba D, Kim D-S, Kim D-Y, Lew D-H, Yang W-I, Krueger JG, et al. Dermal clusters of mature dendritic cells and T cells are associated with the CCL20/CCR6 chemokine system in chronic psoriasis. J Invest Dermatol. 2014;134(5):1462–1465. doi:10.1038/JID.2013.534.
- Annunziato F, Cosmi L, Santarlasci V, Maggi L, Liotta F, Mazzinghi B, Parente E, Filì L, Ferri S, Frosali F, et al. Phenotypic and functional features of human Th17 cells. J Exp Med. 2007;204(8):1849–1861. doi:10.1084/JEM.20070663.
- Kondo T, Takata H, Takiguchi M. Functional expression of chemokine receptor CCR6 on human effector memory CD8+ T cells. Eur J Immunol. 2007;37(1):54–65. doi:10.1002/EJI.200636251.
- Lee AYS, Körner H. The CCR6-CCL20 axis in humoral immunity and T-B cell immunobiology. Immunobiology. 2019;224(3):449–454. doi:10.1016/J.IMBIO.2019.01.005.
- Zohar Y, Wildbaum G, Novak R, Salzman AL, Thelen M, Alon R, Barsheshet Y, Karp CL, Karin N. CXCL11-dependent induction of FOXP3-negative regulatory T cells suppresses autoimmune encephalomyelitis. J Clin Invest. 2014;124(5):2009–2022. doi:10.1172/JCI71951.
- Karin N, Wildbaum G, Thelen M. Biased signaling pathways via CXCR3 control the development and function of CD4+ T cell subsets. J Leukoc Biol. 2016;99(6):857–862. doi:10.1189/JLB.2MR0915-441R.
- Conforti-Andreoni C, Beretta O, Licandro G, Qian HL, Urbano M, Vitulli F, Ricciardi-Castagnoli P, Mortellaro A. Synergism of NOD2 and NLRP3 activators promotes a unique transcriptional profile in murine dendritic cells. J Leukoc Biol. 2010;88(6):1207–1216. doi:10.1189/jlb.1009652.
- Klinger A, Gebert A, Bieber K, Kalies K, Ager A, Bell EB, Westermann J. Cyclical expression of L-selectin (CD62L) by recirculating T cells. Int Immunol. 2009;21(4):443–455. doi:10.1093/INTIMM/DXP012.
- Schwartz RH. T cell anergy. Annu Rev Immunol. 2003;21(1):305–334. doi:10.1146/annurev.immunol.21.120601.141110.
- Pancewicz J, Niklinska W, Eljaszewicz A. Anti-Jagged-1 immunotherapy in cancer. Adv Med Sci. 2022;67(2):196–202. doi:10.1016/J.ADVMS.2022.04.001.
- Cahill EF, Tobin LM, Carty F, Mahon BP, English K. Jagged-1 is required for the expansion of CD4+ CD25+ FoxP3+ regulatory T cells and tolerogenic dendritic cells by murine mesenchymal stromal cells. Stem Cell Res Ther. 2015;6(1):1–13. doi:10.1186/s13287-015-0021-5.
- Lin CL, Huang HM, Hsieh CL, Fan CK, Lee YL. Jagged1-expressing adenovirus-infected dendritic cells induce expansion of Foxp3+ regulatory T cells and alleviate T helper type 2-mediated allergic asthma in mice. Immunology. 2019;156(2):199–212. doi:10.1111/IMM.13021.
- Mitchell S, Vargas J, Hoffmann A. Signaling via the NFκB system. Wiley Interdiscip Rev Syst Biol Med. 2016;8(3):227–241. doi:10.1002/wsbm.1331.
- Mitchell JP, Carmody RJ. NF-κB and the transcriptional control of inflammation. Int Rev Cell Mol Biol. 2018;335:41–84. doi:10.1016/bs.ircmb.2017.07.007.
- Liu T, Zhang L, Joo D, Sun SC. NF-κB signaling in inflammation. Sig Transduct Target Ther. 2017;2(1):1–9. doi:10.1038/sigtrans.2017.23.
- Zhang Q, Lenardo MJ, Baltimore D. 30 years of NF-κB: a blossoming of relevance to human pathobiology. Cell. 2017;168(1–2):37–57. doi:10.1016/J.CELL.2016.12.012.
- Sen S, Cheng Z, Sheu KM, Chen YH, Hoffmann A. Gene regulatory strategies that decode the duration of NFκB dynamics contribute to LPS- versus TNF-Specific gene expression. Cell Syst. 2020;10(2):169–182.e5. doi:10.1016/J.CELS.2019.12.004.
- Martin EW, Pacholewska A, Patel H, Dashora H, Sung MH. Integrative analysis suggests cell type–specific decoding of NF-κB dynamics. Sci Signal. 2020;13(620). doi:10.1126/SCISIGNAL.AAX7195.
- Prescott JA, Mitchell JP, Cook SJ. Inhibitory feedback control of NF-κB signalling in health and disease. Biochem J. 2021;478(13):2619–2664. doi:10.1042/BCJ20210139.
- Shih VFS, Davis-Turak J, MacAl M, Huang JQ, Ponomarenko J, Kearns JD, Yu T, Fagerlund R, Asagiri M, Zuniga EI, et al. Control of RelB during dendritic cell activation integrates canonical and noncanonical NF-κB pathways. Nat Immunol. 2012;13(12):1162–1170. doi:10.1038/ni.2446.
- Baratin M, Foray C, Dalod M, Correspondence TL. Homeostatic NF-κB signaling in steady-state migratory dendritic cells regulates immune homeostasis and tolerance. Immunity. 2015;42(4):627–639. doi:10.1016/j.immuni.2015.03.003.
- Kandasamy P, Zarini S, Chan ED, Leslie CC, Murphy RC, Voelker DR. Pulmonary surfactant phosphatidylglycerol inhibits Mycoplasma pneumoniae-stimulated eicosanoid production from human and mouse macrophages. J Biol Chem. 2011;286(10):7841–7853. doi:10.1074/jbc.M110.170241.
- Choudhary V, Uaratanawong R, Patel RR, Patel H, Bao W, Hartney B, Cohen E, Chen X, Zhong Q, Isales CM, et al. Phosphatidylglycerol Inhibits Toll-like receptor–mediated inflammation by danger-associated molecular patterns. J Invest Dermatol. 2019;139(4):868–877. doi:10.1016/J.JID.2018.10.021.
- Numata M, Kandasamy P, Nagashima Y, Posey J, Hartshorn K, Woodland D, Voelker DR. Phosphatidylglycerol suppresses influenza a virus infection. Am J Respir Cell Mol Biol. 2012;46(4):479–487. doi:10.1165/RCMB.2011-0194OC.
- Klein ME, Rieckmann M, Lucas H, Meister A, Loppnow H, Mäder K. Phosphatidylserine (PS) and phosphatidylglycerol (PG) enriched mixed micelles (MM): A new nano-drug delivery system with anti-inflammatory potential? Eur J Pharm Sci. 2020;152:105451. doi:10.1016/J.EJPS.2020.105451.
- Górska S, Jachymek W, Rybka J, Strus M, Heczko PB, Gamian A. Structural and immunochemical studies of neutral exopolysaccharide produced by Lactobacillus johnsonii 142. Carbohydr Res. 2010;345(1):108–114. doi:10.1016/j.carres.2009.09.015.
- Horn N, Wegmann U, Dertli E, Mulholland F, Collins SRA, Waldron KW, Bongaerts RJ, Mayer MJ, Narbad A. Spontaneous mutation reveals Influence of exopolysaccharide on Lactobacillus johnsonii surface characteristics. PLoS One. 2013;8(3):e59957. doi:10.1371/journal.pone.0059957.
- Lewis T, Nichols PD, McMeekin TA. Evaluation of extraction methods for recovery of fatty acids from lipid-producing microheterotrophs. J Microbiol Methods. 2000;43(2):107–116. doi:10.1016/S0167-7012(00)00217-7.
- Chen S, Zhou Y, Chen Y, Gu J. Fastp: an ultra-fast all-in-one FASTQ preprocessor. Bioinformatics. 2018;34(17):i884–i890. doi:10.1093/BIOINFORMATICS/BTY560.
- Kim D, Paggi JM, Park C, Bennett C, Salzberg SL. Graph-based genome alignment and genotyping with HISAT2 and HISAT-genotype. Nat Biotechnol. 2019;37(8):907–915. doi:10.1038/s41587-019-0201-4.
- Liao Y, Smyth GK, Shi W. featureCounts: an efficient general purpose program for assigning sequence reads to genomic features. Bioinformatics. 2014;30(7):923–930. doi:10.1093/BIOINFORMATICS/BTT656.
- Risso D, Schwartz K, Sherlock G, Dudoit S. GC-Content normalization for RNA-Seq data. BMC Bioinform. 2011;12(1):1–17. doi:10.1186/1471-2105-12-480.
- George NI, Bowyer JF, Crabtree NM, Chang CW, Antoniewski C. An iterative leave-one-out approach to outlier detection in RNA-Seq data. PLoS One. 2015;10(6):e0125224. doi:10.1371/JOURNAL.PONE.0125224.
- Tarazona S, García-Alcalde F, Dopazo J, Ferrer A, Conesa A. Differential expression in RNA-seq: a matter of depth. Genome Res. 2011;21(12):2213–2223. doi:10.1101/GR.124321.111.
- Tarazona S, Furió-Tarí P, Turrà D, Pietro AD, Nueda MJ, Ferrer A, Conesa A. Data quality aware analysis of differential expression in RNA-seq with NOISeq R/Bioc package. Nucleic Acids Res. 2015;43(21):e140–e140. doi:10.1093/NAR/GKV711.
- Gu Z. Complex heatmap visualization. iMeta. 2022;1(3):e43. doi:10.1002/IMT2.43.
- Gu Z, Eils R, Schlesner M. Complex heatmaps reveal patterns and correlations in multidimensional genomic data. Bioinformatics. 2016;32(18):2847–2849. doi:10.1093/BIOINFORMATICS/BTW313.
- Young MD, Wakefield MJ, Smyth GK, Oshlack A. Gene ontology analysis for RNA-seq: accounting for selection bias. Genome Biol. 2010;11(2):1–12. doi:10.1186/gb-2010-11-2-r14.