
ABSTRACT
Intestinal microbes impact the health of the intestine and organs distal to the gut. Limosilactobacillus reuteri is a human intestinal microbe that promotes normal gut transit, the anti-inflammatory immune system, wound healing, normal social behavior in mice, and prevents bone reabsorption. Oxytocin impacts these functions and oxytocin signaling is required for L. reuteri-mediated wound healing and social behavior; however, the events in the gut leading to oxytocin stimulation and beneficial effects are unknown. Here we report evolutionarily conserved oxytocin production in the intestinal epithelium through analysis of single-cell RNA-Seq datasets and imaging of human and mouse intestinal tissues. Moreover, human intestinal organoids produce oxytocin, demonstrating that the intestinal epithelium is sufficient to produce oxytocin. We find that L. reuteri facilitates oxytocin secretion from human intestinal tissue and human intestinal organoids. Finally, we demonstrate that stimulation of oxytocin secretion by L. reuteri is dependent on the gut hormone secretin, which is produced in enteroendocrine cells, while oxytocin itself is produced in enterocytes. Altogether, this work demonstrates that oxytocin is produced and secreted from enterocytes in the intestinal epithelium in response to secretin stimulated by L. reuteri. This work thereby identifies oxytocin as an intestinal hormone and provides mechanistic insight into avenues by which gut microbes promote host health.
Introduction
The microbiome era of biology has heralded a renewed and strengthened understanding that host-microbe interactions in the gut affect not just gut health but also total body health. This knowledge leaves us with the potential capacity to regulate the physiology of multiple organs through manipulation of gut microbial functions. However, achieving this goal is challenged by our limited mechanistic knowledge of how gut microbes interact with their host.
The human intestinal microbe Limosilactobacillus reuteri 6475 is one such microbe that can influence the function of multiple host organ systems. L. reuteri 6475 or a closely related strain reduces gut inflammation in adultsCitation1 and rodent models of chemically induced gut inflammation,Citation2–5 suppresses bone loss in six different murine models of osteoporosisCitation6–11 and in a clinical trial of post-menopausal women,Citation12 promotes skin wound healing in miceCitation13 and in humans,Citation14 and promotes social behavior in six mouse models of autism spectrum disorder.Citation15–17
L. reuteri’s ability to promote social behavior and wound healing has been demonstrated to require oxytocin signaling.Citation13,Citation16 Oxytocin is a 9 amino acid peptide hormone produced predominantly in the paraventricular and supraoptic nuclei of the hypothalamus,Citation18 a brain region involved in the regulation of feeding and social behavior, but also in other organs throughout the body including the enteric nervous system.Citation19 Oxytocin is a multi-functional hormone that affects not only social behavior,Citation20 bone,Citation21 and skin,Citation22 but also gut motility,Citation23 inflammation,Citation23,Citation24 and the intestinal epithelial barrierCitation23 (). Therefore, L. reuteri signaling through oxytocin could potentially explain many of the systemic effects of this microbe.
Table 1. Oxytocin as an effector molecule of L. reuteri’s known health benefits.
Nevertheless, a question remains of how L. reuteri impacts oxytocin signaling. L. reuteri is believed to predominantly inhabit the human small intestineCitation30 and appears to have co-evolved with its other hosts.Citation25,Citation31 Its signaling to hypothalamic oxytocinergic loci requires an intact vagal nerve, implying a signal is sent from the gut to the brain.Citation13,Citation16 The origins of this signal in the gut, however, remain unknown.
Here, we addressed this question by probing the secreted products of the intestinal epithelium. In doing so, we discovered oxytocin itself is present in the intestinal epithelium in enterocytes. Further, we observed L. reuteri can stimulate the secretion of oxytocin and does so through release of secretin, a small intestinal hormone. This work thus advances our understanding of the mechanism by which L. reuteri impacts physiology and identifies oxytocin as a previously unrecognized gut epithelial hormone.
Results
Oxytocin is produced in the intestinal epithelium
Given the links between L. reuteri and oxytocin signaling and the overlap between hormones produced in the gut and brain, we postulated that oxytocin might be present in the gut epithelium. We investigated this possibility by analyzing publicly available mammalian single-cell RNA-Seq (scRNA-Seq) datasets on the intestine. Consistent with our hypothesis, we found an evolutionarily conserved signature of OXT transcripts in epithelial cells of mice, macaques, and humansCitation32–37 (Supplemental Table S1). We subsequently performed a detailed analysis of the human datasets available in the Human Cell LandscapeCitation36 and Gut Cell Atlas,Citation32 which reported scRNA-Seq data from multiple regions of the adult intestinal tract. We observed the greatest number of OXT positive cells and the greatest expression of OXT in the jejunum of the human small intestine (, Supplemental Figure S1A). Additionally, we found OXT expressed in human and mouse organoids derived from the small intestine and colonCitation34,Citation35,Citation38–40 (Supplemental Table S1).
Figure 1. Oxytocin expression and production in the epithelium of the human and mouse gastrointestinal tract. a) log normalized counts of oxytocin expression in human intestinal epithelial cells reported by the scRNA-Seq data from the Gut Cell Atlas.Citation32 Significance values reflect the number of rarefactions (of 10,000) in which the comparison had a p value >0.05 by a Dunn test with a Benjamini-Hochberg correction. These p values were similar whether the number of cells expressing oxytocin or oxytocin expression counts were used. Only significance values < 0.05 are shown. Oxytocin visualized by immunofluorescence imaging in b) 6 μm or 35 μm sectioned human jejunum, antrum, or transverse colon (trans col) and d) mouse stomach, small intestine (SI), cecum, or proximal large intestine (prx LI). Percentage of cells with oxytocin staining throughout the c) human or e) mouse intestinal tract. At least 3,000 nuclei were counted per segment. For c, shape denotes individual patient. For e, shape represents sex, male (triangle) or female (circle). f) oxytocin visualized by immunofluorescence imaging in whole 3D J2-NGN3 (top) or J1006 (bottom) human intestinal organoids (HIO), differentiated but not induced for NGN3. In all images, DAPI stained nuclei are shown in white, oxytocin staining in red, and E-cadherin staining in cyan (b and d only). Apical (a) and/or basolateral (b) sides are labeled. a: all regions rarefied to 1,712 cells; duodenum: 2 patients, jejunum: 4 patients, ileum: 4 patients, cecum: 6 patients, appendix: 4 patients, ascending colon: 4 patients, transverse colon: 6 patients, descending colon 3 patients, sigmoid colon: 7 patients, rectum: 3 patients; c: fundus, body, upper ileum, descending colon, and sigmoid colon: n = 3 unique patients, antrum, duodenum, upper jejunum, mid jejunum, lower jejunum, mid ileum, lower ileum, ascending colon, and transverse colon: n = 4 unique patients; e: n = 6 mice per region.
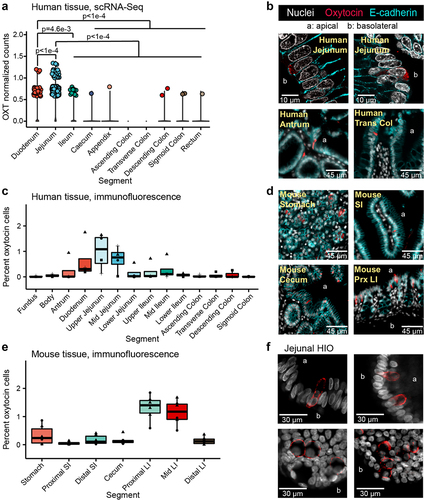
To substantiate these findings, we performed immunostaining and fluorescence imaging on human intestinal tissue and observed oxytocin staining within the epithelial layer of the stomach, small, and large intestine (), in both villi and crypts. In agreement with the human scRNA-Seq data, image analysis of at least 3,000 cells per intestinal segment indicated that the greatest number of oxytocin cells are present in the epithelium of the human upper small intestine (). Oxytocin staining could be grouped into two general patterns: a somewhat granular signal within the cytoplasm as expected of hormones stored in vesicles, and a more diffuse signal that seemed to be between cells rather than around the nucleus. The latter staining pattern was observed more often in villi regions with dense oxytocin staining and could be indicative of staining within infiltrating immune cells ( versus Supplemental Figure S1B). We also performed immunofluorescent staining on the mouse intestinal tract and observed oxytocin staining throughout the gut (). However, in mice, we observed more oxytocin signal in the proximal and mid colon than in other regions of the intestine ().
A few of the scRNA-Seq datasets we investigated were derived from intestinal organoids generated from adult gut epithelial stem cells. In the absence of other gut cell types, these stem cells differentiate to produce only the epithelial layer.Citation41 Therefore, if oxytocin is produced in these organoids, then the gut epithelium is sufficient to produce oxytocin independent of signals originating from the lamina propria, enteric neurons, or stromal layers. To test this hypothesis, we performed reverse transcription quantitative PCR (rt-qPCR) on human duodenal- and jejunal-derived organoids. In doing so, we observed OXT transcripts in differentiated (mature) organoids at higher levels than in undifferentiated (immature, mostly stem cells) organoid controls (Supplemental Figure S1C). Similarly, upon imaging oxytocin in jejunal-derived organoids, we were able to readily observe staining in differentiated adult and infant organoids but not undifferentiated organoids (, Supplemental Figure S1D, Supplemental Movie). These data indicate that the intestinal epithelial layer is sufficient to produce oxytocin and could be directly or indirectly stimulated by L. reuteri.
L. reuteri promotes secretion of oxytocin from the intestinal epithelium.
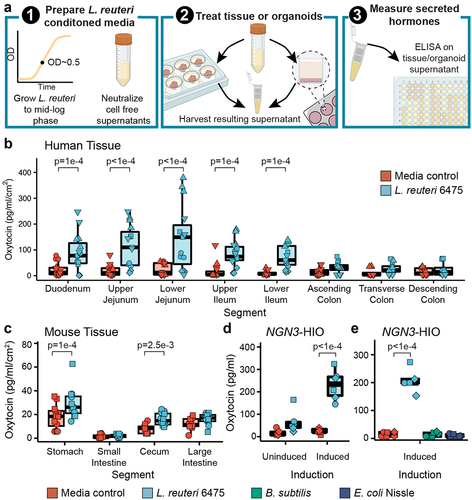
We next evaluated whether L. reuteri could stimulate secretion of oxytocin from the gut epithelium as L. reuteri is able to stimulate oxytocin in the hypothalamus.Citation16 To test this hypothesis, we applied L. reuteri cell-free conditioned medium, thereby comprising a mix of proteins, metabolites, nucleic acids and other molecules released by L. reuteri to mouse, pig, piglet, or human intestinal segments (). In doing so, we observed significant secretion of oxytocin over medium alone controls throughout the human, pig, and piglet small intestine (, Supplemental Figure S2A, B) and in the mouse stomach and cecum (, Supplemental Figure S2C, D). Oxytocin secretion was observed in tissue isolated from both sexes in humans, mice, and piglets, with no differences detected between sexes. For adult pigs, only females were tested. As these tissue pieces contain immune cells, lymph, enteric neurons, and muscle layers, oxytocin could have been secreted from an epithelial cell or from another cell type. To address this limitation, we next attempted to induce secretion of oxytocin using L. reuteri-conditioned medium from organoids, which are only comprised of epithelial cells (). Given that oxytocin is a hormone, we performed this assay using an engineered jejunal human intestinal organoid line (J2-NGN3 HIO) that can be induced to produce up to 40% enteroendocrine cells.Citation42 Indeed, we only observed a significant increase in oxytocin secretion driven by L. reuteri-conditioned medium versus control medium when using induced J2-NGN3 HIOs (). HIO cell viability was not lost by the application of bacterial conditioned medium to HIOs (Supplemental Figure S2E). Notably, the ability of L. reuteri to stimulate oxytocin release was not shared by all bacteria, as Bacillus subtilis and Escherichia coli Nissle were unable to stimulate oxytocin release (), though they grew similarly in LDM4 (Supplemental Figure S2F).
Figure 2. L. reuteri-conditioned medium promotes release of oxytocin from the gut epithelium. a) workflow of secretion assays. L. reuteri-conditioned medium is prepared by growing L. reuteri to mid-log phase, spinning down the bacterial cultures, and harvesting the supernatant. The supernatant is then neutralized to ~pH 7 and filter sterilized to remove cells while maintaining released products. For ex vivo tissue assays, L. reuteri-conditioned medium is placed onto intestinal tissue segments that have been washed free of luminal contents/fecal material. The tissue is then incubated with the L. reuteri-conditioned medium or L. reuteri growth medium control for 3 hours at 37°C with 5% CO2. Afterwards, the resulting tissue supernatant is harvested, spun free of cells, and used in an ELISA or Luminex assay. For organoid assays, organoids are prepared in a monolayer format and treated with L. reuteri-conditioned medium or growth medium control as for the ex vivo tissue. Figure made with BioRender. Oxytocin measured by ELISA and normalized by tissue surface area secreted from ex vivo b) human and c) mouse intestinal tissue. d) oxytocin measured by Luminex secreted from uninduced and induced J2-NGN3 HIOs. e) oxytocin measured by ELISA secreted from induced J2-NGN3 HIOs. Point shape reflects unique patients (shown in triplicate) for human (b) or organoid batch (in triplicate) (d, e). For mouse (c), points represent unique mice and shape denotes sex (females as circles and males as squares). Significance values were determined from the least squares means derived from linear or linear mixed models with pairwise comparisons corrected using a Benjamini-Hochberg multiple testing correction (see Supplemental Tables S2 and S3). b: n = 5 patients for the duodenum through lower ileum and n = 4 patients for the colon regions with three replicate tissues each (12 or 15 datapoints total); c: n = 12 animals per region and condition; d: n = 3 HIO batches with two replicate monolayers per condition (6 datapoints total); e: n = 3 HIO batches with two replicate monolayers per condition (6 datapoints total).
Oxytocin is produced by enterocytes in the intestinal epithelium
The necessity of increased levels of enteroendocrine cells (EECs) for L. reuteri-mediated oxytocin release suggested that oxytocin is made in an EEC, like other gut hormones.Citation43 However, we observed no increase in OXT transcripts, as measured by rt-qPCR, in induced J2-NGN3 HIOs (). In contrast, we observed a marked increase in CHGA transcripts encoding the neuroendocrine protein chromogranin A, which is known to be produced in EECs, in the induced J2-NGN3 HIOs (). Similarly, oxytocin positive cells were not increased by NGN3 overexpression, as measured by flow cytometry, while chromogranin A positive cells were increased (). Together, these results suggest that oxytocin is not produced by an EEC.
Figure 3. Oxytocin is an enterocytic hormone. a) copy number (CN) of CHGA and OXT transcripts by qPCR and b) percent chromogranin A and oxytocin positive cells measured by flow cytometry in uninduced and induced J2-NGN3 HIOs. For a, points represent averaged triplicate qPCR data each from a separate pooled batch of three 3D organoid wells, and where product could not be amplified, a GAPDH CN normalized value of 1e-5 was used. Only p values < 0.05 are shown, which were determined from the least squares means derived from a linear model with pairwise comparisons corrected using a Benjamini-Hochberg multiple testing correction (see Supplemental Tables S2 and S3). UMAP of Gut Cell Atlas adult jejunal epithelium scRNA-Seq dataCitation32 labeled with c) oxytocin counts or d) identified cell clusters (see Supplemental Figure S3J and Supplemental Table S6). e) oxytocin (red) co-stained with enterocyte markers OAT, MTTP, SI, ALDOB, or APOA (green) in 6 μm sectioned human small intestinal tissue. Nuclei stained with DAPI are shown in white. a, b: n = 3 HIO batches with three or more replicate wells combined; c, d: n = 2,791 cells from 4 different patients.
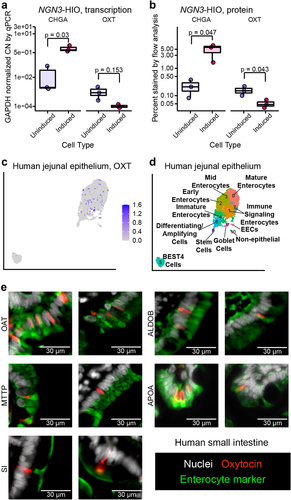
To determine which intestinal cell type produces oxytocin, we first turned to the EEC-enriched organoid scRNA-Seq dataset of Beumer and colleagues.Citation38 Surprisingly, OXT expression did not cluster with any of the major EEC subtypes (Supplemental Figure S3A, B, Supplemental Table S4). Rather, OXT grouped alone in a cluster predominantly comprised of duodenal and ileal cells (Supplemental Figure S3C) enriched in genes characteristic of enterocytes (FABP2, FABP6, OAT, MTTP, RBP2, SI, APOA1, APOB) (Supplemental Figure S3D, Supplemental Table S4). Enterocytes have been observed to decrease in abundance as EECs increase in abundance when NGN3 is induced in HIOs.Citation42 Therefore, if oxytocin is produced in an enterocyte, it would be expected to be produced less when HIOs are induced as we observed (). In human small intestinal tissue, we confirmed that oxytocin does not co-localize with two markers of EECs: chromogranin A or neurotensin (Supplemental Figure S3E, F). These results provide further evidence that oxytocin is not produced by an EEC but perhaps by an enterocyte.
To further test this hypothesis, we returned to the human tissue scRNA-Seq datasets of the Human Cell LandscapeCitation36 and Gut Cell Atlas.Citation32 In both datasets, we observed OXT expression predominantly within enterocyte clusters (, Supplemental Figure S3G-J, Supplemental Tables S5, S6). Furthermore, on co-staining human small intestinal tissue with oxytocin and enterocyte markers that span the entire villus, we observed co-localization of oxytocin and enterocyte-specific markers (). Overall, these data suggest oxytocin is produced by a cell that functions as an enterocyte and we can classify this oxytocin as enterocytic.
To determine if other genes are uniquely expressed in oxytocin-producing cells, we compared the transcriptional profiles of oxytocin positive versus negative cells within the jejunum of the Gut Cell AtlasCitation32 dataset. We observed that only OXT was significantly overexpressed (Wilcoxon rank sum test, log2 fold change >1.1, padj < 1e-295), while REG1A and OLFM4 (two stem cell markers) were significantly underexpressed (Wilcoxon rank sum test, log2 fold change < −1.1, padj <0.05) in the oxytocin producing cells (Supplemental Table S7). Therefore, OXT expression alone appears to characterize cells that produce oxytocin.
Secretin receptor signaling is necessary for oxytocin release by L. reuteri 6475
Having determined that oxytocin is not produced by an EEC, but that its secretion by L. reuteri from organoids requires increased EECs, we next asked if there is an EEC-derived product that mediates L. reuteri-driven release of oxytocin. In the brain, hypothalamic oxytocin can be released by the peptide hormone secretin,Citation44 and both secretin and the secretin receptor are necessary for normal social behavior.Citation44,Citation45 In the gut, secretin is produced in EECs by ‘S cells’Citation46 and secretin is upregulated in our induced J2-NGN3 organoids.Citation42 Therefore, we hypothesized that gut produced secretin may promote oxytocin release. We explored this hypothesis by first testing if the addition of secretin would stimulate the release of oxytocin from intestinal organoids. Indeed, secretin applied to induced J2-NGN3 organoids resulted in release of oxytocin at levels comparable to that of L. reuteri-conditioned medium (). If secretin is sufficient to promote oxytocin release, we reasoned that we should be able to cause release of oxytocin from organoids not enriched in EECs by supplying exogenous secretin. We tested this hypothesis by applying secretin to non-engineered organoid lines derived from the human duodenum, jejunum, ileum, and ascending colon, derived each from a different individual. We observed secretion of oxytocin in each tested HIO line (). Finally, we tested if application of secretin to whole intestinal tissue promotes oxytocin release, recognizing that oxytocin could be secreted from cells other than epithelial cells in this model. Consistent with organoid experiments, we observed release of oxytocin like that caused by L. reuteri ().
Figure 4. L. reuteri induces oxytocin secretion through release of secretin. Oxytocin measured by an ELISA released from a) induced J2-NGN3 HIOs or b) non-engineered HIOs derived from different patients for different regions of the intestine treated with bacterial medium control (LDM4), L. reuteri-conditioned medium, or 1.2 ng/ml (120 pg total) of secretin. c) oxytocin measured by an ELISA released from human mid-jejunal intestinal tissue treated with Krebs, L. reuteri-conditioned medium, or 2.5 ng/ml (12.5 ng total) of secretin. Oxytocin measured by an ELISA released from d and e) induced J2-NGN3 HIOs or f) human mid-jejunal intestinal tissue treated with Krebs, 1.0 ng/ml (100 pg total for HIO; 5 ng total for tissue) secretin 5–27, 2.5 ng/ml (250 pg total for HIO; 12.5 ng total for tissue) of secretin, and/or L. reuteri-conditioned medium. g) oxytocin or h) secretin measured by ELISA from the same induced J2-NGN3 HIOs treated with bacterial medium control (LDM4) or L. reuteri-conditioned medium. i) secretin measured by ELISA from human mid-jejunal intestinal tissue treated with bacterial medium control (LDM4) or L. reuteri-conditioned medium. Differential point shapes reflect multiple organoid batches (d, e, g, h) or unique patients (c, f, i). Significance values were determined from the least squares means derived from a linear or linear mixed model with pairwise comparisons corrected using a Benjamini-Hochberg multiple testing correction (see Supplemental Tables S2 and S3). a: n = 3 replicate monolayers per condition; b: n = 4 HIO lines with three replicate monolayers per condition; c and i: n = 3 patients with three replicate tissues per condition (9 datapoints total); d: n = 4 HIO batches with three replicate monolayers per condition (12 total datapoints); e: n = 3 HIO batches with three replicate monolayers per condition (9 total datapoints); f: n = 3 replicate tissues from one patient per condition; g and h: n = 2 HIO batches with duplicate replicate monolayers per condition, shared between the two figures.
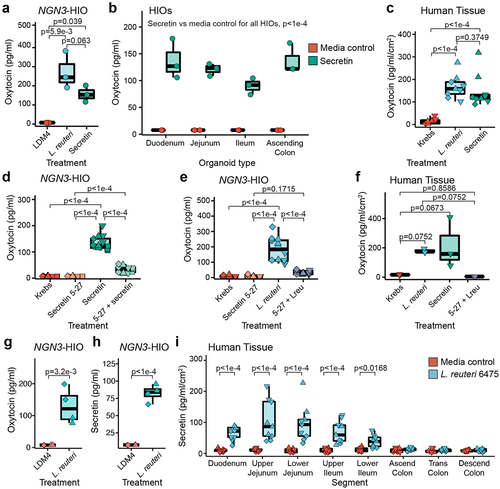
To further verify that enterocytic oxytocin secretion is mediated through secretin, we blocked signaling through the secretin receptor in two ways. First, we blocked the secretin receptor on induced J2-NGN3 organoids by pre-treatment with a blocking antibody prior to treatment with L. reuteri-conditioned medium. Inhibition of secretin receptor signaling significantly attenuated oxytocin release (Supplemental Figure S4). Next, we tested whether a competitive inhibitor of the secretin receptor (secretin 5–27) would also block oxytocin release in induced J2-NGN3 organoids. When secretin and secretin 5–27 were applied together, oxytocin release was abrogated (). Similarly, when L. reuteri-conditioned medium was mixed with secretin 5–27, oxytocin was not secreted from induced J2-NGN3 organoids (). Finally, we treated human intestinal tissue with L. reuteri-conditioned medium supplemented with secretin 5–27 and observed loss of oxytocin secretion (). Together, these findings demonstrate that signaling through the secretin receptor causes release of oxytocin from intestinal epithelial cells and suggests that L. reuteri 6475 induces oxytocin release via secretin.
L. reuteri 6475-conditioned medium induces secretion of oxytocin and secretin
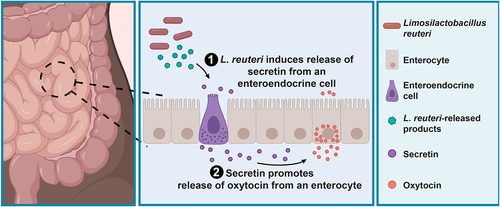
If L. reuteri 6475 is causing secretion of oxytocin via secretin, then L. reuteri 6475-conditioned medium should stimulate secretin release. To determine whether this was occurring, we measured both hormones from the same induced J2-NGN3 HIO sample. In doing so, we observed co-release of secretin and oxytocin in response to L. reuteri-conditioned medium (). We were also able to measure release of secretin from whole human tissue by L. reuteri () in the same intestinal regions in which we measured oxytocin (). Collectively, these data show that L. reuteri-conditioned medium induces secretion of secretin (which is produced in EECs), and this secretin is necessary for L. reuteri-mediated release of oxytocin in the gut ().
Figure 5. L. reuteri promotes the secretion of oxytocin from enterocytes through stimulation of secretin. Working model for L. reuteri mediated secretion of oxytocin. Oxytocin exists in enterocytes in the human small intestine. Its secretion is promoted by L. reuteri via secretin, which is produced in enteroendocrine cells. Figure made in BioRender.
Discussion
The intestinal epithelium has evolved to rapidly sense and respond to beneficial and pathogenic microbes in the gut. How gut-resident microbes impact the function of other organs in the body and the specific role of the intestinal epithelium in these effects is an open area of research. The actions of the intestinal microbe L. reuteri, for example, result in beneficial effects on gut,Citation25,Citation29 bone,Citation6–12,Citation27 skin,Citation13,Citation14,Citation28 and brain physiology.Citation15–17 Signaling through the vagal nerve to the hypothalamus to release oxytocin in the brain is critical for the roles of L. reuteri in the brainCitation16 and skin,Citation13 and oxytocin has similar effects as L. reuteri on bone,Citation21 brain,Citation17,Citation47 and the gut.Citation23,Citation24 These observations suggest that oxytocin plays a critical role in many of L. reuteri’s systemic beneficial effects. Here, we report that oxytocin exists in the intestinal epithelium and its release is stimulated by L. reuteri via signaling by the hormone secretin.
Secretion of gut epithelial oxytocin can be stimulated by at least two factors in common with secretion of hypothalamic oxytocin: by L. reuteri Citation16 and by secretin.Citation44 The mechanism by which secretin stimulates oxytocin in the gut may be a one or multi step process. Secretin is produced throughout the small intestine in humans and is known to be released into circulation.Citation46 Therefore, secretin has the potential to act in a paracrine mechanism on a nearby cell with a secretin receptor or via an endocrine mechanism on a more distal cell. Secretin receptors are abundant in the intestineCitation48,Citation49 and may be present on an oxytocin producing cell or on a second cell type that coordinates oxytocin release. Interestingly, the link between oxytocin and secretin has been highlighted in several studies for the treatment of colitisCitation50 and autism.Citation51 In mice, oxytocin was significantly secreted by L. reuteri in the stomach and cecum and variably in the large intestine. Secretin is predominantly produced in the proximal small intestine,Citation52 so oxytocin secretion in the mouse gut may be regulated by something other than secretin.
Oxytocin is recognized as an extraordinary hormone with a wide variety of beneficial effects.Citation21,Citation23,Citation24,Citation53–56 Heretofore, these actions have been attributed almost exclusively to the release of oxytocin from the hypothalamus into the blood stream via the posterior pituitary gland or through activation of other regions in the brain.Citation18 However, oxytocin is also observed in a variety of other tissues including the thymus,Citation57 heart,Citation58 uterus,Citation59 placenta,Citation59 testes,Citation60 and intestinal neurons.Citation19 The roles of these locally produced oxytocin are not well understood. In our investigation of human and mouse intestinal tissue, we discovered that oxytocin is also produced within the intestinal epithelium in both villi and crypts.
Surprisingly, oxytocin was not produced in an enteroendocrine cell but rather in a subset of enterocytes. Oxytocin is not the only hormone known to be produced from an enterocyte: FGF19 (mouse Fgf15) is also secreted from an enterocyte cell type.Citation61,Citation62 Oxytocin was the only gene distinguishing the population of oxytocin-producing cells from other enterocytes. Interestingly, in the hypothalamus, oxytocin is also the only gene enriched in oxytocin producing neurons.Citation63 The presence of oxytocin in enterocytes suggests a potential function relating to food sensing or metabolism. Indeed, some of the functions attributed to oxytocin are in glucose and lipid metabolism.Citation64
Our work reveals that the distribution of oxytocin in the gut differs between humans and mice: humans had more in the upper small intestine, whereas mice had more in the upper large intestine. Disparities in hormone density along the gastrointestinal tract between mice and humans has been noted for other gut hormones including PYY and GLP-2.Citation65 What causes these specificities remains to be understood. In humans the enrichment of oxytocin in the upper small intestine suggests it could be regulated by diet, bile, small intestinal hormones like secretin,Citation66 and small intestinal microbes including L. reuteri .Citation30
L. reuteri-mediated release of oxytocin, we demonstrate, is facilitated by secretin signaling. The mechanism through which L. reuteri induces release of secretin is currently unknown. L. reuteri is known to cause secretion of histamine,Citation3 which can stimulate oxytocin secretionCitation67,Citation68 in the hypothalamus. Previously, it was reported that L. reuteri promotes synthesis of tetrahydrobiopterin,Citation17 which promotes social behavior with dependency on the oxytocin receptorCitation17 and mediates oxytocin release in the brain.Citation69,Citation70 Whether there is a relationship between intestinal epithelial oxytocin and tetrahydrobiopterin remains to be determined.
Our findings raise major outstanding questions regarding enterocytic oxytocin. First, is there a relationship between enterocytic oxytocin and hypothalamic oxytocin secretion? Does release of oxytocin from the intestinal epithelium enhance secretion of oxytocin from the hypothalamus? Alternatively, does L. reuteri-mediated release of secretin directly or indirectly promote oxytocin release in the brain, similar to how circulating cholecystokinin can activate brain oxytocinCitation71–74? Second, what is/are the functions of enterocytic oxytocin? One possibility is that enterocytic oxytocin acts locally in the gut. Whole body oxytocin receptor knockout mice have increased gut motility, increased intestinal inflammation, less proliferative epithelial stem cells, and increased epithelial permeability.Citation23 Another possible function of enterocytic oxytocin is that it has a function related to food metabolism. Whether any of the other roles of total body oxytocin are driven by enterocytic oxytocin remains unknown.
Altogether, this work demonstrates that oxytocin is produced and secreted from enterocytes in the intestinal epithelium. This discovery identifies a new mechanism by which gut microbes can regulate host physiology within the gut. Further work is needed to define this host-microbe interaction on the molecular level and consequences of this interaction.
Methods
scRNA-Seq analysis
Unless noted otherwise, we determined the number of oxytocin cells present in published scRNA-Seq datasets by enumerating the number of cells reported as expressing oxytocin without filtering the data.
For more detailed analyses, data from Beumer et al.Citation38 were loaded into the Seurat package in R (v 3.2.1).Citation75 Cells were filtered so to only include those with greater than 1,100 unique transcripts and less than 9,000 unique transcripts, similar to methods used to process the data presented in the original publication.Citation38 Data were log normalized using the NormalizeData function, variable features found using 2,000 features and the “vst” method, and data were scaled using default settings for the ScaleData function. Using the ElbowPlot function, we selected 17 dimensions to reduce and cluster the data using the FindNeighbors function. Clusters were found using the FindClusters function with resolution = 0.9 and data were plotted using a UMAP reduction. Informative plots were made using the FeaturePlot and VlnPlot functions. Marker genes for each cluster were found using the FindAllMarkers function with min.pct = 0.25, logfc.threshold = 0.25, only.pos = TRUE, and only genes with an adjusted p-value (from a Bonferroni correction) of <0.05 and a log fold change greater 1 or less than −1 were further considered.
For the scRNA-Seq data of the Human Cell Landscape,Citation36 we used background gene expression corrected data as provided. Data were similarly processed as for the Beumer et al. 2020 data, such that we filtered these data to only include cells with greater than 50 transcripts, greater than 70 but less than 1,800 unique transcripts, and less than 45% mitochondrial transcripts. We used 5,000 features and varied the number of dimensions according to the output from the ElbowPlot function in Seurat and the resolution so to maximize the number of clusters while keeping the maximum modularity greater than 0.75. From this analysis, we identified cells belonging to the epithelial layer by first identifying markers for each cluster using the FindAllMarkers in Seurat and cross-checking these markers against the annotations presented in the Human Cell Landscape online tool (https://db.cngb.org/HCL/). The epithelial cells were then processed using the same pipeline to produce a UMAP, adjusting the number of dimensions and resolution as necessary. To compare oxytocin expression among intestinal segments, data were SCTransformed with the options method = “glmGamPoi”, vars.to.regress = percent mitochondrial reads, return.only.var.genes = FALSE, and min_cells = 1.
For the adult epithelial scRNA-Seq data from the Gut Cell Atlas,Citation32 we filtered the data to exclude batches containing less than 50 cells. The data were split into batches and then transformed with SCTransform as for the Human Cell Landscape data. This SCTransform data were carried through the remainder of the pipeline to produce a UMAP.
To compare the expression of oxytocin across intestinal sites, we rarefied the SCTransformed data for oxytocin in the Human Cell Landscape dataset to 1,281 cells, thereby excluding the ascending colon and epityphlon, and the Gut Cell Atlas data to 1,712 cells. For each dataset, we performed the rarefaction 10,000 times. Each iteration, expression difference significances among intestinal regions were determined by a Kruskal–Wallis test and a Dunn test was used for pairwise comparisons with a Benjamini-Hochberg multiple testing correction. Reported p values are the fraction of iterations in which the given comparison had a p >0.05 from the Dunn test.
To find other genes that may be enriched in oxytocin positive cells, we used the FindMarkers function in Seurat using a Wilcoxon rank sum test on oxytocin positive and negative cells in the Gut Cell Atlas jejunum dataset after batch normalization and integration. Genes with log2 fold change ≥1 or ≤-1 and with an adjusted p <0 .05 were considered as significant.
Ex vivo tissue
Human: Intestines were acquired through the organ donation group LifeGift (Houston, TX, USA). Whole intestines were delivered on ice within 1 hour of removal. Intestinal regions were washed in cold PBS and used for secretion assays or imaging (see below).
Pig: Intestines from pregnant sows and piglets were a gift of Douglas Burrin and Barbara Stoll, which were collected in accordance with IACUC policies. Collected intestines were treated as were for human tissue. Piglets used were one male and one female of ages 3 and 4 weeks, respectively. Sows were within a few days from natural delivery.
Mouse: Mouse tissue was acquired from conventional mice both housed in a specific pathogen free facility on standard chow diet under Baylor College of Medicine protocol AN:8471. Male and female adult (age matched, 9 to 12 weeks old) mice were euthanized by CO2 affixation followed by cervical dislocation. Whole stomach, small intestine, cecum, and large intestine were removed and washed with PBS.
Tissue immunofluorescence
Tissue regions after excision and washing were placed in TRU-FLOW tissue cassettes (Fisherbrand, Sugar Land, TX, USA) in 4% paraformaldehyde in PBS, with a volume at least 50× that of the tissue, at 4°C. After 18–24 hours, cassettes were rinsed twice in PBS and transferred to 70% ethanol. Tissue was embedded in paraffin and sectioned to 6 μm or 35 μm sections by the Digestive Diseases Center Cellular and Molecular Core at Texas Children’s Hospital. Sections were deparaffinized in three changes of xylene for 10, 10, and 15 mins and hydrated through two 10 min changes in each of 100%, 95%, 70%, and 50% ethanol followed by two 10 min washes in diH2O. Antigen retrieval was performed using a 0.01 M sodium citrate buffer, pH 6.0 in the Retriever 2100 (Electron Microscopy Sciences, Hatfield, PA, USA) with resting in the buffer overnight to cool to room temperature. Slides were rinsed three times in diH2O, with the last rinse lasting 15 mins. Pap pen (Sigma-Aldrich, St. Louis, MO, USA) isolated areas on the slides were then placed in PBS for 3 minutes before permeabilizing with 0.5% Triton-X 100 (Sigma-Aldrich, St. Louis, MO, USA) for 20 mins. Slide regions were washed in PBS for 5 mins and then blocked with 10% normal goat (Jackson ImmunoResearch, West Grove, PA, USA) or donkey serum (Sigma-Aldrich, St. Louis, MO, USA) in PBS-0.05% Tween 20 (PBS-T, Genesee Scientific, El Cajon, CA, USA) for 1 to 2 hours. Next primary antibodies made in 1% normal goat or donkey serum in PBS-T were added to the slide regions, and the slides were incubated at 4°C in a humid slide staining tray (Newcomer Supply, Middleton, WI, USA) overnight. Primary antibodies were washed three times for 10 mins each in PBS-T. Secondary antibodies with NucBlue Fixed Cell ReadyProbes (Invitrogen/Life Technologies, Carlsbad, CA, USA) and Alexa-647 conjugated E-cadherin (BD Biosciences, Franklin Lakes, NJ, USA) were applied diluted in 1% normal goat or donkey serum in PBS-T for 1 hour at room temperature and slides were kept dark within the humid slide staining tray. If a mouse raised primary antibody was used, then secondary antibodies were applied alone. In this case, secondary antibodies were washed three times for 10 mins each in PBS-T and then the slide regions were blocked in 5% normal mouse serum (Jackson ImmunoResearch, West Grove, PA, USA) in PBS-T for 1 hour after which NucBlue Fixed Cell ReadyProbes and Alexa 647 conjugated E-cadherin were applied diluted in PBS-T for 1 hour at room temperature with slides kept dark within the humid slide staining tray. After the last antibody/probe incubation, slides were washed three times for 10 mins each in PBS. Slides with 6 μm sections were mounted in ProLong Glass Antifade Mountant (Thermo Fisher Scientific, Sugar Land, TX, USA) and those with 35 μm sections in SlowFade Glass Soft-set Antifade Mountant (Thermo Fisher Scientific, Sugar Land, TX, USA). Primary and secondary antibodies and their dilutions are listed in Supplemental Table S8. Slides were imaged on either a Revolve (Echo, San Diego, CA, USA) fluorescence microscope, Axio Observer (Zeiss, Pleasanton, CA, USA) fluorescence microscope, or LSM 880 with Airyscan (Zeiss, Pleasanton, CA, USA). Image processing was accomplished in Zen Blue (Zeiss, Pleasanton, CA, USA) and/or FijiCitation76.
Image quantification of oxytocin staining
For quantification, at least 40 fields of view with 20% overlap were imaged on a Zeiss Axio Observer at 20× magnification. The images were stitched using the Zen Blue software, allowing for 5% to 20% overlap of the fields of view. Oxytocin staining in the stitched images were manually counted. Nuclei were counted with a custom script in MatLab. Briefly, first, E-cadherin staining (far red channel) was used to create a mask of the epithelial layer. Then, a mask of the nuclei was created from the DAPI staining (blue channel). Then the E-cadherin mask and nuclei masks were overlapped to identify nuclei within the epithelial layer. Finally, the number of nuclei was estimated by dividing a pre-estimated average nuclei area by the total nuclei area in the epithelium. Finally, percent oxytocin cells were calculated as the percent of oxytocin positive cells of the total epithelial nuclei.
Organoid culture and maintenance
Non-transformed organoids (duodenal D103, jejunal J11 and J1006, ileal IL104, and ascending colon ASC209) were derived from distinct patients and acquired from the Digestive Diseases Center Organoid Core at Baylor College of Medicine. Organoids enriched in enteroendocrine cells (J2-NGN3) were previously generated and characterizedCitation42, and are routinely passaged in our laboratory. For maintenance and expansion, organoids were embedded in 15 µl Matrigel (Corning, NY, USA) domes in a 24 well plate (Nucleon Delta, Thermo Scientific, USA). Two domes were plated in each well and cultured in complete medium with growth factors (CMGF+) supplemented with 50% (v/v) Wnt3a conditioned medium (hW-CMGF+ medium)Citation42. Medium was supplemented with 10 µmol Y-27632 Rock inhibitor to prevent apoptosis and 100 µg/ml normocin (InvivoGen, San Diego, USA) to prevent mycoplasma infection. Organoid cultures were maintained in a humidified 5% CO2 incubator at 37°C. J2-NGN3 organoids were also supplemented with 200 µg/ml GeneticinCitation42 (Gibco, Grand Island, NY). Organoids were passaged every ~ 6 to 10 days as described previouslyCitation77,Citation78. All organoid cultures were passaged less than 60 times prior to downstream experimental manipulations.
3D imaging of organoids
Organoids were seeded in 3D in Matrigel (Corning, NY, USA) plugs as for passaging organoids. Following seeding, organoids were given hW-CMGF+ mediumCitation42 supplemented with 10 µmol Y-27632 Rock inhibitor, and for J2-NGN3 organoids, 200 µg/ml Geneticin for 2 days. After two days, media were changed according to organoid treatment group: undifferentiated: hW-CMGF+ medium, 10 µmol Y-27632 Rock inhibitor, and for J2-NGN3 organoids 200 µg/ml Geneticin; differentiated and uninduced: differentiation mediumCitation42 with 10 µmol Y-27632 Rock inhibitor; differentiated and induced (J2-NGN3 organoids only): differentiation medium, 10 µmol Y-27632 Rock inhibitor, and 1.0 µg/ml doxycycline (as doxycycline monohydrate, Sigma-Aldrich, St. Louis, MO, USA, dissolved in DMSO). These media conditions (at 500 µl) were continued for 4 days with daily media changes. After 4 days, 3D organoids were prepared for imaging using established methods.Citation79 Epithelial cell boundaries were imaged by staining with Alexa 647 conjugated E-cadherin, and nuclei were stained with 0.07× NucBlue Fixed Cell Stain ReadyProbes (Invitrogen, USA) with secondary antibody application. Primary and secondary antibodies and their dilutions are listed in Supplemental Table S8.
Bacterial culture and preparation of conditioned medium
Limosilactobacillus reuteri 6475 (ATCC PTA 6475) was cultured from a small amount of frozen glycerol stock diluted in deMan, Rogosa, Sharpe broth (MRS; BD Difco, Franklin Lakes, NY, USA) overnight (~16 hours) at 37°C. Escherichia coli Nissle and Bacillus subtilis were cultured from a small amount of frozen glycerol stock in Luria-Bertani broth (BD Difco, Franklin Lakes, NY, USA) overnight at 37°C. To prepare conditioned media, strains were subcultured in LDM4, a fully defined mediumCitation80 with a starting optical density of 0.1 and cultured at 37°C until an optical density of 0.5. Cells were collected by centrifugation and the supernatant was neutralized with 10 M sodium hydroxide to pH ~7.0 and filtered through a 0.22 µM PVDF filter (MilliporeSigma, Burlington, MA, USA). Bacterial conditioned medium was frozen at −20°C until use.
rt-qPCR of organoids
Organoids were plated in 3D in Matrigel and cultured for one day in hW-CMGF+ medium supplemented with 10 µmol Y-27632 Rock inhibitor, 100 µg/ml normocin, and for J2-NGN3 organoids, 200 µg/ml Geneticin. Following, organoids were either maintained in hW-CMGF+ medium supplemented with 200 µg/ml Geneticin for J2-NGN3 HIOs, switched to differentiation mediumCitation42 supplemented with 200 µg/ml Geneticin for J2-NGN3 HIOs, or switched to differentiation mediumCitation42 supplemented with 1 µg/ml doxycycline for NGN3 induction. Per biological replicate, three replicate wells per medium type were used. Media were changed daily for two additional days. To harvest cells for RNA extraction, replicate organoid wells were combined in ice cold dPBS and spun at 200 x g for 5 mins at 4°C. Following removal of the supernatant containing dPBS and Matrigel, 1 ml TRIzol (Invitrogen, Carlsbad, CA, USA) was added and cells were vortexed for 30 secs at max speed and incubated at room temperature for 5 mins. Extraction continued with the addition of 200 µl chloroform, vortexing for 20 secs at max speed and with incubation at room temperature for 3 mins. To separate the phases, cells were spun at 14,000 x g for 15 mins at 4°C. The aqueous (upper) phase was moved to a fresh tube and mixed with an equal volume of 70% ethanol. Samples were transferred to spin columns from the RNeasy Isolation Kit (Qiagen, Hilden, Germany), and RNA was purified using the manufacturer’s instructions with elution in 30 µl RNase free water. RNA was quantified and purity was determined using a DeNovix DS-11 Spectrophotometer (DeNovix, Wilmington, DE, USA). DNA was removed by treating 200 ng of RNA with TURBO DNase (Invitrogen, Carlsbad, CA, USA) according to the manufacturer’s instructions. cDNA was made from 20 ng of the resulting RNA using SuperScript III (Invitrogen, Carlsbad, CA, USA) per the manufacturer’s instructions with 50 ng random hexamers. Reactions were done in triplicate and combined prior to qPCR. Controls lacking reverse-transcriptase were prepared as well.
Quantitative PCR reactions were performed in triplicate and consisted of 1 µl cDNA from above, 0.25 µl 20 mmol/L forward and reverse primers, 10 µl PowerUp SYBR Green Master Mix (Applied Biosystems, Foster City, CA, USA), and 8.5 µl nuclease free water. Reactions were performed on a QuantStudio 3 real-time thermocycler (Applied Biosciences, Foster City, CA, USA), and conditions consisted of 50°C for 2 mins, 95°C for 10 mins, 40 cycles of 95°C for 15 secs and 60°C for 1 min, after which fluorescence was measured. Melt curve analysis was performed by heating between 95°C and 60°C. Controls lacking cDNA and reverse transcriptase were included. Cycle threshold values were determined using the QuantStudio software. Data analyses were performed in R version 3.5.2.Citation81 Briefly, cycle threshold values from triplicate qPCRs were averaged for a biological replicate. Undetermined cycle threshold values (target undetected within 40 cycles) were removed, and only averages resulting from replication of two or greater reactions were carried further. Cycle threshold values were normalized against that for GAPDH and converted to copy number: 2^(Ct.GAPDH-Ct.Target). Plotted data are replicate biological experiments (n ≥ 2). Significance values per organoid line or treatment group were computed using linear models with a Benjamini-Hochberg multiple comparison adjustment using the lm function in R.Citation81 Least-squares means estimates were computed with the emmeans function in the emmeans packageCitation82 using a Benjamini-Hochberg multiple testing correction (see Supplemental Tables S2 and S3). Primer sequences are provided in Supplemental Table S9.
Hormone secretion assays
For human or pig tissue, tissue was washed in cold PBS, cut into rectangles (sizes between 1.4 and 8 cm2 for human, ~7.07 cm2 for pigs, and 2.5 to 6 cm2 for piglets) and placed into 5 ml of treatment in a 6 well plate. For mouse secretion assays, the entire stomach, small intestine, cecum, and large intestine were removed, flushed/washed free of contents with PBS using a blunt 18-gauge needle (small and large intestine) or by filleting the tissue (stomach and cecum). The small and large intestine were then filleted. Each intestinal segment was then placed into 1 ml of treatment in a 12 well plate, with one intestinal region (stomach, cecum, small or large intestine) per well. All plates (with human, mouse, pig, or piglet tissue) were incubated at 3 hours at 37°C in a humidified 5% CO2 cell culture incubator. Supernatants were collected, spun down at 1,000 × g, and frozen at −20°C or used directly in an ELISA.
For secretion assays using organoids, monolayers were produced by coating 96 well plates in 25 µl/ml Matrigel diluted in dPBS. Organoids were seeded at approximately one to two 3D wells of J2-NGN3 organoids per one 96 well. Briefly,Citation42 3D organoids of size between 40 and 90 µm in diameter were washed and separated from Matrigel with cold 0.5 mM EDTA in dPBS, then trypsinized with 0.5% trypsin, 0.5 mM EDTA for 4 minutes at 37°C. After 4 minutes, CMGF- (no growth factors)Citation42 with 10% fetal bovine serum was added to inactivate the trypsin. The resulting cell solution was manually pipetted for 50 to 100 times and then filtered through a 40 µm nylon cell strainer (Corning, USA) to generate a solution of single cells. Cells were recovered by centrifugation and resuspended in CMGF+ and 10 µM Rock inhibitor. PBS was removed from the 96 well monolayer plate and replaced with the HIO cells. After two days recovery in CMGF+, monolayers were differentiated using differentiation mediumCitation42 supplemented with 10 µM Rock inhibitor and 1 µg/ml doxycycline. After 5 days differentiation, media were removed and replaced with treatment. Monolayers were incubated in a humidified 5% CO2 incubator at 37°C for 3 hours. Following, supernatants were removed and frozen at −20°C. HIO viability was confirmed by visualizing the monolayers to ensure they were still intact and by performing a PrestoBlue assay (ThermoFisher Scientific, USA).
Tissue and organoids described above were treated with LDM4, Krebs buffer (MilliporeSigma, Burlington, MA, USA), bacterial conditioned media (undiluted) that was previously frozen and warmed to 37°C before use, secretin (MilliporeSigma, Burlington, MA, USA) prepared in Krebs to a concentration of 1.2 to 2.5 ng/ml for HIOs and 2.5 ng/ml for human tissue, a secretin receptor antibody (Santa Cruz, USA) diluted 1:100 in LDM4 or L. reuteri conditioned medium, and/or 1 ng/ml pig secretin 5–27 (Bachem ordered through VWR, USA). See Supplemental Figure S5A for a titration of secretin on induced J2-NGN3 HIOs for oxytocin release.
Quantification of secreted hormones
Oxytocin in the tissue or organoid supernatants was measured using an ELISA (Enzo Life Sciences, USA, ADI-900-153A-0001) or Luminex panel (Millipore Sigma, USA, HNPMAG-35K). Secretin was similarly measured using an ELISA (Biomatik, USA, EKU07226). For pig tissue, supernatants were concentrated 5× for the ELISA by lyophilizing. Extrapolated values from the assays less than the limit of detection were given the value of half the lowest standard in the standard curve for the ELISA. Data were analyzed using either a linear or a linear mixed model. Linear mixed models were used for data derived from human or pig intestinal tissue with the patient or pig variable added as a random effect, for the piglet data, sex was added as a random effect as there was only a single male and a single female piglet, and for organoids when multiple organoid batches or lines were used and these were included as a random effect. The random effect terms allowed for inclusion of replicate data at the patient/pig/organoid level without inflating the power of the model. For mouse data, linear models were used as there were no replicates per mouse and tissue segment. The specific models used are provided in Supplemental Table S2. Linear mixed models were run using the lmer function in lme4 packageCitation83 with REML = FALSE and the control optimizer = “bobyqa” and linear models with the lm function in R.Citation81 Least-squares means estimates were computed with the emmeans function in the emmeans packageCitation82 using a Benjamini-Hochberg multiple testing correction (see Supplemental Table S3).
Quantification of cells producing hormones or EEC markers by flow cytometry
Organoids in 3D Matrigel plugs were washed once with cold dPBS, then incubated in Cell Recovery Solution (Corning, Corning, NY, USA) at 4°C on a horizontal shaking platform for 30 to 60 minutes after mechanical disruption of the Matrigel plugs. Following, the organoids were collected into a centrifuge tube and spun down at 200 × g at 4°C for 5 minutes. Organoids were resuspended in 0.05% trypsin (diluted in dPBS from 0.25% trypsin-EDTA, phenol red, Gibco, USA), using 1 ml for 9 to 12 wells from the original 24 well plate housing the 3D Matrigel plugs, and incubated at 37°C for 10 mins. Trypsin was inactivated by adding 2× volume of cold CMGF– with 10% FBS. Organoids were fully dissociated by pipetting 100 times with a 1 ml pipette tip. Following, the organoid solution was filtered through a 40 µm strainer and centrifuged at 400 × g for 5 minutes. Cells were resuspended in 2 ml CMGF- and spun again at 400 × g for 5 minutes. Cells were resuspended in 0.25 ml of 4% paraformaldehyde per staining condition, transferred to a 5 ml round bottom polypropylene tube, and incubated at 4°C for 45 mins to fix the cells. Cells were then permeabilized by directly adding 16× volume (4 ml) of 0.1% Tween 20 in dPBS and incubating at 4°C for 10 mins. Cells were spun as before, resuspended in 1 ml 0.1% Tween 20 in dPBS and stored at 4°C for 1 to 2 days or the protocol was immediately continued.
To block cells prior to staining, cells were spun at 400 × g for 5 minutes and resuspended in 1 ml per staining condition of 0.1% Triton-X 100, 5% donkey serum, 1% BSA in dPBS and incubated at 4°C for 20 minutes. For primary antibody staining, cells were spun as before, resuspended in 0.25 ml primary antibodies diluted in 0.1% Triton-X 100, 1% BSA in dPBS, and incubated at 4°C overnight. Following the cells were washed by directly adding 3 ml of 0.1% Triton-X 100, 1% BSA in dPBS incubating at 4°C for 3 minutes, and spinning down the cells as before. Cells were washed an additional 3 times in a similar manner, waiting 10 to 30 minutes between washes. For secondary antibody and DAPI staining, cells were spun as before, resuspended in 0.25 ml secondary antibodies and DAPI diluted in 0.1% Triton-X 100, 1% BSA in dPBS, and incubated at 4°C overnight in the dark. Cells were washed as before and resuspended in 400 µl 2% BSA, 2 mM EDTA, 2 mM sodium azide in dPBS and stored at 4°C in the dark until flow cytometry analysis.
Flow analysis was completed on an Attune NxT (Invitrogen, USA). Data were analyzed using FlowJO (v10, BD Biosciences, USA). Single cells were identified using 1) forward scatter area VS side scatter area, 2) forward scatter area VS forward scatter height, 3) side scatter area VS side scatter height, 4) forward scatter area VS violet channel area (for DAPI). Cells representing those in G1 were selected and carried forward. 100,000 to 500,000 DAPI+ single G1 cells were analyzed per sample and at least 60,000 per staining control. OXT+ and CHGA+ cells were identified by gating on the blue channel (for OXT) or yellow channel (for CHGA) such that the percent of cells in samples lacking the primary antibody for OXT and CHGA was less than 0.05%. See Supplemental Figure S5B, C for an example of the gating strategy.
Statistics
All data analyses were conducted in R (v 4.1.2).Citation81 All boxplots show the median and the lower and upper quartiles. All data points are shown. All tailed tests are two-tailed. See specific method sections and Supplemental Tables S2 and S3 for details. Significance values of linear mixed models were derived by performing an ANOVA of the model and a null model lacking all fixed effects. Exact n values are provided in the figure legends.
Rigor and reproducibility
All organoid secretion data are represented by both multiple technical replicates (same organoid batch) and at least two biological replicates (different organoid batch or organoid line), except for Supplemental Figure 4: blocking the secretin receptor with an antibody was performed as an alternative to blocking the receptor with secretin 5–27. These organoid biological replicates are in some cases distributed across figures to aid in the data presentation. Such cases are listed here. L. reuteri-induced release of oxytocin is shown in (3 biological replicates), (3 biological replicates), and in (1 biological replicate). Secretin-induced release of oxytocin from NGN3-HIOs is shown in (1 biological replicate) and (4 biological replicates). For tissue secretion experiments, only utilizes a single organ donor. Where noted in the figure legends, HIO and tissue secretion data are displayed as individual monolayer wells or tissue pieces (technical replicates) as tissue pieces from the same segment and individual were distributed longitudinally across the tissue region shown (i.e. not side by side tissue pieces) and each individual monolayer well differentiates independently. Statistical analyses were performed using linear mixed models to account for technical replication.
Author contributions
HAD, RAB, SCD conceptualized, designed the experiments, and interpreted the data. HAD, JL, AT, SCD performed the experiments and analyzed the data. SCD prepared the original draft. All authors reviewed the draft. HAD, JL, RAB, SCD revised the draft. HAD, RAB, and SCD acquired funding and materials for the project.
Supplemental Material
Download MS Excel (77.3 KB)Supplemental Material
Download MS Word (2.3 MB)Acknowledgments
We acknowledge Javier Nieto, Mary Estes, Sarah Blutt, Sashi Ramani, Shelly Buffington, Carolyn Bomidi, Victoria Poplaski, Colleen Brand, Erika Nachman, Micah Forshee, Madeline Bresson, Joseph Hyser, Douglas Burrin, Barbara Stoll, Caitlin Vonderohe, Pamela Parsons, Susan Venerable, Xi-Lei Zeng, Xiaomin Yu, Brian McDaniel, Nick Adair, and Mike Dehart for assistance and intellectual support. This project was supported in part by NIH grant DK056338 (Cellular and Molecular Core, Functional Genomics and Microbiome Core, and Gastrointestinal Experimental Model Systems Core), which supports the Texas Medical Center Digestive Diseases Center. This project was supported in part by the Cytometry and Cell Sorting Core at Baylor College of Medicine with funding from the CPRIT Core Facility Support Award (CPRIT-RP180672) and the NIH (P30 CA125123 and S10 RR024574). This project was supported in part by the Optical Imaging and Vital Microscopy Core at Baylor College of Medicine.
Disclosure statement
Funding was provided, in part, by BioGaia (RAB), with whom we have a provisional patent (HAD, RAB, SCD).
Data availability statement
Data and R and MatLab scripts used to generate the figures are available at https://github.com/sdirienzi/Lreuteri_OXT.
Supplementary material
Supplemental data for this article can be accessed online at https://doi.org/10.1080/19490976.2023.2256043
Additional information
Funding
References
- Ojetti V, Saviano A, Brigida M, Petruzziello C, Caronna M, Gayani G, Franceschi F. Randomized control trial on the efficacy of Limosilactobacillus reuteri ATCC PTA 4659 in reducing inflammatory markers in acute uncomplicated diverticulitis. Eur J Gastroenterol Hepatol. 2022;34(5):496–21. doi:10.1097/MEG.0000000000002342.
- Thomas CM, Saulnier DMA, Spinler JK, Hemarajata P, Gao C, Jones SE, Grimm A, Balderas MA, Burstein MD, Morra C, et al. FolC2-mediated folate metabolism contributes to suppression of inflammation by probiotic Lactobacillus reuteri. MicrobiologyOpen. 2016;5(5):802–818. doi:10.1002/mbo3.371.
- Thomas CM, Hong T, van Pijkeren JP, Hemarajata P, Trinh DV, Hu W, Britton RA, Kalkum M, Versalovic J. Histamine derived from probiotic Lactobacillus reuteri suppresses TNF via modulation of PKA and ERK signaling. PloS One. 2012;7(2):e31951. doi:10.1371/journal.pone.0031951.
- Gao C, Major A, Rendon D, Lugo M, Jackson V, Shi Z, Mori-Akiyama Y, Versalovic J. Histamine H2 receptor-mediated suppression of intestinal inflammation by probiotic Lactobacillus reuteri. mBio. 2015;6(6):e01358–15. doi:10.1128/mBio.01358-15.
- Hemarajata P, Gao C, Pflughoeft KJ, Thomas CM, Saulnier DM, Spinler JK, Versalovic J. Lactobacillus reuteri-specific immunoregulatory gene rsiR modulates histamine production and immunomodulation by Lactobacillus reuteri. J Bacteriol. 2013;195(24):5567–5576. doi:10.1128/JB.00261-13.
- McCabe LR, Irwin R, Schaefer L, Britton RA. Probiotic use decreases intestinal inflammation and increases bone density in healthy male but not female mice. J Cell Physiol. 2013;228(8):1793–1798. doi:10.1002/jcp.24340.
- Britton RA, Irwin R, Quach D, Schaefer L, Zhang J, Lee T, Parameswaran N, McCabe LR. Probiotic L. reuteri treatment prevents bone loss in a menopausal ovariectomized mouse model. J Cell Physiol. 2014;229(11):1822–1830. doi:10.1002/jcp.24636.
- Zhang J, Motyl KJ, Irwin R, MacDougald OA, Britton RA, McCabe LR. Loss of bone and Wnt10b expression in male type 1 diabetic mice is blocked by the probiotic Lactobacillus reuteri. Endocrinology. 2015;156(9):3169–3182. doi:10.1210/EN.2015-1308.
- Schepper JD, Collins FL, Rios-Arce ND, Raehtz S, Schaefer L, Gardinier JD, Britton RA, Parameswaran N, McCabe LR. Probiotic Lactobacillus reuteri prevents postantibiotic bone loss by reducing intestinal dysbiosis and preventing barrier disruption. J Bone Miner Res. 2019;34(4):681–698. doi:10.1002/jbmr.3635.
- Schepper JD, Collins F, Rios-Arce ND, Kang HJ, Schaefer L, Gardinier JD, Raghuvanshi R, Quinn RA, Britton R, Parameswaran N, et al. Involvement of the gut microbiota and barrier function in glucocorticoid-induced osteoporosis. J Bone Miner Res. 2020;35(4):801–820. doi:10.1002/jbmr.3947.
- Rios-Arce ND, Schepper JD, Dagenais A, Schaefer L, Daly-Seiler CS, Gardinier JD, Britton RA, McCabe LR, Parameswaran N. Post-antibiotic gut dysbiosis-induced trabecular bone loss is dependent on lymphocytes. Bone. 2020;134:115269. doi:10.1016/j.bone.2020.115269.
- Nilsson AG, Sundh D, Bäckhed F, Lorentzon M. Lactobacillus reuteri reduces bone loss in older women with low bone mineral density: a randomized, placebo-controlled, double-blind, clinical trial. J Intern Med. 2018;284(3):307–317. doi:10.1111/joim.12805.
- Poutahidis T, Kearney SM, Levkovich T, Qi P, Varian BJ, Lakritz JR, Ibrahim YM, Chatzigiagkos A, Alm EJ, Erdman SE. Microbial symbionts accelerate wound healing via the neuropeptide hormone oxytocin. PloS One. 2013;8(10):e78898. doi:10.1371/journal.pone.0078898.
- Varian BJ, Poutahidis T, DiBenedictis BT, Levkovich T, Ibrahim Y, Didyk E, Shikhman L, Cheung HK, Hardas A, Ricciardi CE, et al. Microbial lysate upregulates host oxytocin. Brain Behav Immun. 2017;61:36–49. doi:10.1016/j.bbi.2016.11.002.
- Buffington SA, Di Prisco GV, Auchtung TA, Ajami NJ, Petrosino JF, Costa-Mattioli M. Microbial reconstitution reverses maternal diet-induced social and synaptic deficits in offspring. Cell. 2016;165(7):1762–1775. doi:10.1016/j.cell.2016.06.001.
- Sgritta M, Dooling SW, Buffington SA, Momin EN, Francis MB, Britton RA, Costa-Mattioli M. Mechanisms underlying microbial-mediated changes in social behavior in mouse models of autism spectrum disorder. Neuron. 2019;101(2):246–259.e6. doi:10.1016/j.neuron.2018.11.018.
- Buffington SA, Dooling SW, Sgritta M, Noecker C, Murillo OD, Felice DF, Turnbaugh PJ, Costa-Mattioli M. Dissecting the contribution of host genetics and the microbiome in complex behaviors. Cell. 2021;184(7):1740–1756.e16. doi:10.1016/j.cell.2021.02.009.
- Stoop R. Neuromodulation by oxytocin and vasopressin. Neuron. 2012;76(1):142–159. doi:10.1016/j.neuron.2012.09.025.
- Welch MG, Tamir H, Gross KJ, Chen J, Anwar M, Gershon MD. Expression and developmental regulation of oxytocin (OT) and oxytocin receptors (OTR) in the enteric nervous system (ENS) and intestinal epithelium. J Comp Neurol. 2009;512(2):256–270. doi:10.1002/cne.21872.
- Walum H, Young LJ. The neural mechanisms and circuitry of the pair bond. Nat Rev Neurosci. 2018;19(11):643–654. doi:10.1038/s41583-018-0072-6.
- Tamma R, Colaianni G, Zhu L, DiBenedetto A, Greco G, Montemurro G, Patano N, Strippoli M, Vergari R, Mancini L, et al. Oxytocin is an anabolic bone hormone. Proc Natl Acad Sci USA. 2009;106(17):7149–7154. doi:10.1073/pnas.0901890106.
- Detillion CE, Craft TKS, Glasper ER, Prendergast BJ, DeVries AC. Social facilitation of wound healing. Psychoneuroendocrinology. 2004;29(8):1004–1011. doi:10.1016/j.psyneuen.2003.10.003.
- Welch MG, Margolis KG, Li Z, Gershon MD. Oxytocin regulates gastrointestinal motility, inflammation, macromolecular permeability, and mucosal maintenance in mice. Am J Physiol Gastrointest Liver Physiol. 2014;307(8):G848–62. doi:10.1152/ajpgi.00176.2014.
- İ̇şeri SÖ, Gedik İE, Erzik C, Uslu B, Arbak S, Gedik N, Yeğen BÇ. Oxytocin ameliorates skin damage and oxidant gastric injury in rats with thermal trauma. Burns. 2008;34(3):361–369. doi:10.1016/j.burns.2007.03.022.
- Walter J, Britton RA, Roos S. Host-microbial symbiosis in the vertebrate gastrointestinal tract and the Lactobacillus reuteri paradigm. Proc Natl Acad Sci U S A. 2011;108(Suppl 1):4645–4652. doi:10.1073/pnas.1000099107.
- Lin YP, Thibodeaux CH, Peña JA, Ferry GD, Versalovic J. Probiotic Lactobacillus reuteri suppress proinflammatory cytokines via c-jun. Inflamm Bowel Dis. 2008;14(8):1068–1083. doi:10.1002/ibd.20448.
- Quach D, Parameswaran N, McCabe L, Britton RA. Characterizing how probiotic Lactobacillus reuteri 6475 and lactobacillic acid mediate suppression of osteoclast differentiation. Bone Reports. 2019;11:100227. doi:10.1016/j.bonr.2019.100227.
- Erdman S, Poutahidis T. Probiotic ‘glow of health’: it’s more than skin deep. Benef Microbes. 2014;5(2):109–119. doi:10.3920/BM2013.0042.
- Karimi S, Jonsson H, Lundh T, Roos S. Lactobacillus reuteri strains protect epithelial barrier integrity of IPEC-J2 monolayers from the detrimental effect of enterotoxigenic Escherichia coli. Physiol Rep. 2018;6(2):e13514. doi:10.14814/phy2.13514.
- Reuter G. The Lactobacillus and Bifidobacterium microflora of the human intestine: composition and succession. Curr Issues Intest Microbiol. 2001;2:43–53.
- Li F, Li X, Cheng CC, Bujdoš D, Tollenaar S, Simpson DJ, Tasseva G, Perez-Muñoz ME, Frese S, Gänzle MG, et al. A phylogenomic analysis of Limosilactobacillus reuteri reveals ancient and stable evolutionary relationships with rodents and birds and zoonotic transmission to humans. BMC Biol. 2023;21(1):53. doi:10.1186/s12915-023-01541-1.
- Elmentaite R, Kumasaka N, Roberts K, Fleming A, Dann E, King HW, Kleshchevnikov V, Dabrowska M, Pritchard S, Bolt L, et al. Cells of the human intestinal tract mapped across space and time. Nature. 2021;597(7875):250–255. doi:10.1038/s41586-021-03852-1.
- Fawkner-Corbett D, Antanaviciute A, Parikh K, Jagielowicz M, Gerós AS, Gupta T, Ashley N, Khamis D, Fowler D, Morrissey E, et al. Spatiotemporal analysis of human intestinal development at single-cell resolution. Cell. 2021;184(3):810–826.e23. doi:10.1016/j.cell.2020.12.016.
- Fujii M, Matano M, Toshimitsu K, Takano A, Mikami Y, Nishikori S, Sugimoto S, Sato T. Human intestinal organoids maintain self-renewal capacity and cellular diversity in niche-inspired culture condition. Cell Stem Cell. 2018;23(6):787–793.e6. doi:10.1016/j.stem.2018.11.016.
- Haber AL, Biton M, Rogel N, Herbst RH, Shekhar K, Smillie C, Burgin G, Delorey TM, Howitt MR, Katz Y, et al. A single-cell survey of the small intestinal epithelium. Nature. 2017;551(7680):333–339. doi:10.1038/nature24489.
- Han X, Zhou Z, Fei L, Sun H, Wang R, Chen Y, Chen H, Wang J, Tang H, Ge W, et al. Construction of a human cell landscape at single-cell level. Nature. 2020;581(7808):303–309. doi:10.1038/s41586-020-2157-4.
- Li H, Wang X, Wang Y, Zhang M, Hong F, Wang H, Cui A, Zhao J, Ji W, Chen Y-G. Cross-species single-cell transcriptomic analysis reveals divergence of cell composition and functions in mammalian ileum epithelium. Cell Regeneration. 2022;11(1):19. doi:10.1186/s13619-022-00118-7.
- Beumer J, Puschhof J, Bauzá-Martinez J, Martínez-Silgado A, Elmentaite R, James KR, Ross A, Hendriks D, Artegiani B, Busslinger GA, et al. High-resolution mRNA and secretome atlas of human enteroendocrine cells. Cell. 2020;181(6):1291–1306.e19. doi:10.1016/j.cell.2020.04.036.
- Beumer J, Artegiani B, Post Y, Reimann F, Gribble F, Nguyen TN, Zeng H, Van den Born M, Van Es JH, Clevers H. Enteroendocrine cells switch hormone expression along the crypt-to-villus BMP signaling gradient. Nat Cell Biol. 2018;20(8):909–916. doi:10.1038/s41556-018-0143-y.
- Grün D, Lyubimova A, Kester L, Wiebrands K, Basak O, Sasaki N, Clevers H, van Oudenaarden A. Single-cell messenger RNA sequencing reveals rare intestinal cell types. Nature. 2015;525(7568):251–255. doi:10.1038/nature14966.
- Sato T, Vries RG, Snippert HJ, van de Wetering M, Barker N, Stange DE, van Es JH, Abo A, Kujala P, Peters PJ, et al. Single Lgr5 stem cells build crypt-villus structures in vitro without a mesenchymal niche. Nature. 2009;459(7244):262–265. doi:10.1038/nature07935.
- Chang-Graham AL, Danhof HA, Engevik MA, Tomaro-Duchesneau C, Karandikar UC, Estes MK, Versalovic J, Britton RA, Hyser JM. Human intestinal enteroids with inducible neurogenin-3 expression as a novel model of gut hormone secretion. Cell Mol Gastroenterol Hepatol. 2019;8(2):209–229. doi:10.1016/j.jcmgh.2019.04.010.
- Gribble FM, Reimann F. Enteroendocrine cells: chemosensors in the intestinal epithelium. Annu Rev Physiol. 2016;78(1):277–299. doi:10.1146/annurev-physiol-021115-105439.
- Takayanagi Y, Yoshida M, Takashima A, Takanami K, Yoshida S, Nishimori K, Nishijima I, Sakamoto H, Yamagata T, Onaka T. Activation of supraoptic oxytocin neurons by secretin facilitates social recognition. Biol Psychiatry. 2017;81(3):243–251. doi:10.1016/j.biopsych.2015.11.021.
- Nishijima I, Yamagata T, Spencer CM, Weeber EJ, Alekseyenko O, Sweatt JD, Momoi MY, Ito M, Armstrong DL, Nelson DL, et al. Secretin receptor-deficient mice exhibit impaired synaptic plasticity and social behavior. Hum Mol Genet. 2006;15(21):3241–3250. doi:10.1093/hmg/ddl402.
- Afroze S, Meng F, Jensen K, McDaniel K, Rahal K, Onori P, Gaudio E, Alpini G, Glaser SS. The physiological roles of secretin and its receptor. Ann Transl Med. 2013;1(3):29. doi:10.3978/j.issn.2305-5839.2012.12.01.
- Peñagarikano O, Lázaro MT, Lu X-H, Gordon A, Dong H, Lam HA, Peles E, Maidment NT, Murphy NP, Yang XW, et al. Exogenous and evoked oxytocin restores social behavior in the Cntnap2 mouse model of autism. Sci Transl Med. 2015;7(271):271ra8. doi:10.1126/scitranslmed.3010257.
- Human Protein Atlas Group. Human Protein Atlas [Internet]. 2022; http://www.proteinatlas.org
- Uhlén M, Fagerberg L, Hallström BM, Lindskog C, Oksvold P, Mardinoglu A, Sivertsson Å, Kampf C, Sjöstedt E, Asplund A, et al. Tissue-based map of the human proteome. Sci. 2015;347(6220):1260419. doi:10.1126/science.1260419.
- Welch MG, Anwar M, Chang CY, Gross KJ, Ruggiero DA, Tamir H, Gershon MD. Combined administration of secretin and oxytocin inhibits chronic colitis and associated activation of forebrain neurons. Neurogastroent Motil. 2010;22(6):654–e202. doi:10.1111/j.1365-2982.2010.01477.x.
- Krishnaswami S, McPheeters ML, Veenstra-VanderWeele J. A systematic review of secretin for children with autism spectrum disorders. Pediatrics. 2011;127(5):e1322–5. doi:10.1542/peds.2011-0428.
- Roth KA, Gordon JI. Spatial differentiation of the intestinal epithelium: analysis of enteroendocrine cells containing immunoreactive serotonin, secretin, and substance P in normal and transgenic mice. Proc Natl Acad Sci USA. 1990;87(16):6408–6412. doi:10.1073/pnas.87.16.6408.
- Jurek B, Neumann ID. The oxytocin receptor: from intracellular signaling to behavior. Physiol Rev. 2018;98(3):1805–1908. doi:10.1152/physrev.00031.2017.
- Kerem L, Lawson EA. The effects of oxytocin on appetite regulation, food intake and metabolism in humans. IJMS. 2021;22(14):7737. doi:10.3390/ijms22147737.
- Clodi M, Vila G, Geyeregger R, Riedl M, Stulnig TM, Struck J, Luger TA, Luger A. Oxytocin alleviates the neuroendocrine and cytokine response to bacterial endotoxin in healthy men. Am J Physiol-Endoc M. 2008;295(3):E686–91. doi:10.1152/ajpendo.90263.2008.
- Kingsbury MA, Bilbo SD. The inflammatory event of birth: how oxytocin signaling may guide the development of the brain and gastrointestinal system. Front Neuroendocrinol. 2019;55:100794. doi:10.1016/j.yfrne.2019.100794.
- Geenen V, Legros J-J, Franchimont P, Baudrihaye M, Defresne M-P, Boniver J. The neuroendocrine thymus: coexistence of oxytocin and neurophysin in the human thymus. Sci. 1986;232(4749):508–511. doi:10.1126/science.3961493.
- Jankowski M, Wang D, Hajjar F, Mukaddam-Daher S, McCann SM, Gutkowska J. Oxytocin and its receptors are synthesized in the rat vasculature. Proc Natl Acad Sci USA. 2000;97(11):6207–6211. doi:10.1073/pnas.110137497.
- Chibbar R, Miller FD, Mitchell BF. Synthesis of oxytocin in amnion, chorion, and decidua may influence the timing of human parturition. J Clin Invest. 1993;91(1):185–192. doi:10.1172/JCI116169.
- Thackare H, Nicholson HD, Whittington K. Oxytocin—its role in male reproduction and new potential therapeutic uses. Hum Reprod Update. 2006;12(4):437–448. doi:10.1093/humupd/dmk002.
- Inagaki T, Choi M, Moschetta A, Peng L, Cummins CL, McDonald JG, Luo G, Jones SA, Goodwin B, Richardson JA, et al. Fibroblast growth factor 15 functions as an enterohepatic signal to regulate bile acid homeostasis. Cell Metab. 2005;2(4):217–225. doi:10.1016/j.cmet.2005.09.001.
- Jones S. Mini-review: endocrine actions of fibroblast growth factor 19. Mol Pharmaceutics. 2008;5(1):42–48. doi:10.1021/mp700105z.
- Romanov RA, Zeisel A, Bakker J, Girach F, Hellysaz A, Tomer R, Alpár A, Mulder J, Clotman F, Keimpema E, et al. Molecular interrogation of hypothalamic organization reveals distinct dopamine neuronal subtypes. Nat Neurosci. 2017;20(2):176–188. doi:10.1038/nn.4462.
- Ding C, Leow MK‐S, Magkos F. Oxytocin in metabolic homeostasis: implications for obesity and diabetes management. Obes Rev. 2019;20(1):22–40. doi:10.1111/obr.12757.
- Wewer Albrechtsen NJ, Kuhre RE, Toräng S, Holst JJ. The intestinal distribution pattern of appetite- and glucose regulatory peptides in mice, rats and pigs. BMC Res Notes. 2016;9(1):60. doi:10.1186/s13104-016-1872-2.
- Polak JM, Coulling I, Bloom S, Pearse AGE. Immunofluorescent localization of secretin and enteroglucagon in human intestinal mucosa. Scand J Gastroenterol. 1971;6(8):739–744. doi:10.3109/00365527109179946.
- Bealer SL, Crowley WR. Stimulation of central and systemic oxytocin release by histamine in the paraventricular hypothalamic nucleus: evidence for an interaction with norepinephrine. Endocrinology. 1999;140(3):1158–1164. doi:10.1210/endo.140.3.6601.
- Kjaer A, Knigge U, Warberg J. Involvement of oxytocin in histamine- and stress-induced ACTH and prolactin secretion. Neuroendocrinology. 1995;61(6):704–713. doi:10.1159/000126898.
- Ciosek J, Guzek JW. Neurohypophysial function and pteridines: effect of (6R)-5,6,7, 8-tetrahydro-alpha-biopterin on bioassayed hypothalamo-neurohypophysial vasopressin and oxytocin in the rat. Folia Med Cracov. 1992;33:25–35.
- Ciosek J, Guzek JW, Orłowska-Majdak M. Neurohypophysial vasopressin and oxytocin as influenced by (6 R)-5,6,7,8-tetrahydro- α -biopterin in euhydrated and dehydrated rats. Biol Chem Hoppe Seyler. 1992;373(2):1079–1084. doi:10.1515/bchm3.1992.373.2.1079.
- Verbalis JG, McCann MJ, McHale CM, Stricker EM. Oxytocin secretion in response to cholecystokinin and food: differentiation of nausea from satiety. Sci. 1986;232(4756):1417–1419. doi:10.1126/science.3715453.
- Ueta Y, Kannan H, Higuchi T, Negoro H, Yamaguchi K, Yamashita H. Activation of gastric afferents increases noradrenaline release in the paraventricular nucleus and plasma oxytocin level. J Auton Nerv Syst. 2000;78(2–3):69–76. doi:10.1016/S0165-1838(99)00049-1.
- Bondy CA, Jensen RT, Brady LS, Gainer H. Cholecystokinin evokes secretion of oxytocin and vasopressin from rat neural lobe independent of external calcium. 1989;86(13):5198–5201. doi:10.1073/pnas.86.13.5198.
- Hashimoto H, Onaka T, Kawasaki M, Chen L, Mera T, Soya A, Saito T, Fujihara H, Sei H, Morita Y, et al. Effects of cholecystokinin (CCK)-8 on hypothalamic oxytocin-secreting neurons in rats lacking CCK-A receptor. Auton Neurosci. 2005;121(1–2):16–25. doi:10.1016/j.autneu.2005.05.002.
- Stuart T, Butler A, Hoffman P, Hafemeister C, Papalexi E, Mauck WM, Hao Y, Stoeckius M, Smibert P, Satija R. Comprehensive integration of single-cell data. Cell. 2019;177(7):1888–1902.e21. doi:10.1016/j.cell.2019.05.031.
- Schindelin J, Arganda-Carreras I, Frise E, Kaynig V, Longair M, Pietzsch T, Preibisch S, Rueden C, Saalfeld S, Schmid B, et al. Fiji: an open-source platform for biological-image analysis. Nat Methods. 2012;9(7):676–682. doi:10.1038/nmeth.2019.
- Saxena K, Blutt SE, Ettayebi K, Zeng X-L, Broughman JR, Crawford SE, Karandikar UC, Sastri NP, Conner ME, Opekun AR, et al. Human intestinal enteroids: a new model to study human rotavirus infection, host restriction, and pathophysiology. J Virol. 2015;90(1):43–56. doi:10.1128/JVI.01930-15.
- Sato T, Stange DE, Ferrante M, Vries RGJ, van Es JH, van den Brink S, van Houdt WJ, Pronk A, van Gorp J, Siersema PD, et al. Long-term expansion of epithelial organoids from human colon, adenoma, adenocarcinoma, and Barrett’s epithelium. Gastroenterology. 2011;141(5):1762–1772. doi:10.1053/j.gastro.2011.07.050.
- Dekkers JF, Alieva M, Wellens LM, Ariese HCR, Jamieson PR, Vonk AM, Amatngalim GD, Hu H, Oost KC, Snippert HJG, et al. High-resolution 3D imaging of fixed and cleared organoids. Nat Protoc. 2019;14(6):1756–1771. doi:10.1038/s41596-019-0160-8.
- Engevik MA, Morra CN, Röth D, Engevik K, Spinler JK, Devaraj S, Crawford SE, Estes MK, Kalkum M, Versalovic J. Microbial metabolic capacity for intestinal folate production and modulation of host folate receptors. Front Microbiol. 2019;10:2305. doi:10.3389/fmicb.2019.02305.
- R Core Team. R: a language and environment for Statistical computing [internet]. Vienna, Austria: R Foundation for Statistical Computing; 2021. https://www.R-project.org/
- Lenth RV. Emmeans: estimated marginal means, aka least-squares means. R package version 180 2022; https://CRAN.R-project.org/package=emmeans.
- Bates D, Mächler M, Bolker B, Walker S. Fitting linear mixed-effects models using lme4. J Stat Softw. 2015;67(1):1–48. doi:10.18637/jss.v067.i01.