
ABSTRACT
Fabry disease (FD) is an X-linked metabolic disease caused by a deficiency in α-galactosidase A (α-Gal A) activity. This causes accumulation of glycosphingolipids, especially globotriaosylceramide (Gb3), in different cells and organs. Neuropathic pain and gastrointestinal (GI) symptoms, such as abdominal pain, nausea, diarrhea, constipation, and early satiety, are the most frequent symptoms reported by FD patients and severely affect their quality of life. It is generally accepted that Gb3 and lyso-Gb3 are involved in the symptoms; nevertheless, the origin of these symptoms is complex and multifactorial, and the exact mechanisms of pathogenesis are still poorly understood. Here, we used a murine model of FD, the male α-Gal A (-/0) mouse, to characterize functionality, behavior, and microbiota in an attempt to elucidate the microbiota-gut-brain axis at three different ages. We provided evidence of a diarrhea-like phenotype and visceral hypersensitivity in our FD model together with reduced locomotor activity and anxiety-like behavior. We also showed for the first time that symptomology was associated with early compositional and functional dysbiosis of the gut microbiota, paralleled by alterations in fecal short-chain fatty acid levels, which partly persisted with advancing age. Interestingly, most of the dysbiotic features suggested a disruption of gut homeostasis, possibly contributing to accelerated intestinal transit, visceral hypersensitivity, and impaired communication along the gut-brain axis.
Introduction
Fabry disease (FD) is a rare and highly debilitating lysosomal storage disorder that results from the reduced or absent functionality of the α-Galactosidase A enzyme (α-Gal A) due to mutations in the GLA gene located on the X chromosome.Citation1 FD is reported to be pan-ethnic, but owing to its rarity and the variety of clinical manifestations, as discussed below, an accurate determination of the prevalence remains a challenge and its incidence is most likely still underestimated. Recent data report a frequency of 1:40,000 to 1:117,000 in male patients, although targeted newborn screening programs have revealed a higher frequency.Citation2α-Gal A deficiency causes accumulation of globotriaosylceramide (GL-3; also abbreviated as Gb3) within lysosomes of multiple cell types throughout the body.Citation3 Several cell types, including vascular, cardiac, renal, nerve, and skin cells, are affected by the accumulation of Gb3 and trigger a wide range of systemic alterations, including peripheral nerve fiber damage, which increases the possibility of ischemic stroke, small-fiber peripheral neuropathy, cardiac dysfunction, and chronic kidney disease, with the risk of fatal complications.Citation4 In the classic phenotype of FD, the earliest presenting symptoms in childhood are typically neuropathic pain, mainly burning paroxysmal hand and foot pain (acroparesthesia) and gastrointestinal (GI) problems.Citation5,Citation6 GI impairments are frequent in FD patients who experience nonspecific symptoms such as abdominal pain, diarrhea, constipation, bloating, nausea, and vomiting,Citation7,Citation8 similar to those observed in common GI disorders such as irritable bowel syndrome (IBS) and inflammatory bowel disease (IBD).Citation9 These symptoms may be severe and often lead to significantly reduced quality of life. Because FD is rare and the clinical phenotype is heterogeneous, affected patients are often misdiagnosed; therefore, diagnosis is delayed.Citation10 In patients with milder- or late-onset phenotypes, nonspecific GI symptoms may appear later in life (compared to classic phenotypes), leading to a diagnostic challenge, especially in those without a family history of FD.Citation2,Citation11 It is crucial to promote knowledge about the GI manifestations of FD not only to ensure timely diagnosis, but also to improve quality of life. Although enzymatic replacement therapy (ERT) may improve GI symptoms,Citation5,Citation12,Citation13 there is a pressing need to better understand the underlying pathogenetic mechanisms of these symptoms to identify novel or adjunct management and therapeutic strategies, including targeting the gut microbiome. We have previously demonstrated that α‐Gal A (-/0) hemizygous male mice, a murine model of FD,Citation14 share many symptoms with FD patients and exhibit structural and molecular alterations in peripheral neuronal terminations as well as in dorsal root ganglion (DRG) neurons. In particular, this murine model of FD has been shown to exhibit decreased intraepidermal nerve fiber density and altered molecular and functional expression of pain-related ion channels associated with somatic sensitivity derangements.Citation15–18 Likewise, when analyzing the α-Gal A (-/0) mouse colon, we observed significant changes in the myenteric plexus ganglia area, neuronal density, Gb3 deposits in the GI wall and mucosa, and density of the fibers innervating the mucosa.Citation19 Regarding the cause of the GI symptoms manifested by FD patients, two major hypotheses have been proposed: the first involves an alteration in the function of autonomic neurons responsible for controlling intestinal motility, and the second concerns lesions of intestinal smooth muscle or endothelial cells leading to vascular dysfunction and/or ischemia.Citation20 The latter hypothesis would lead to a rapid intestinal transit time, altered peristalsis, gastroparesis, and intestinal stasis, with consequent bacterial growth and nutrient malabsorption. For many years, dysbiosis (i.e., alteration of the microbial community inhabiting the GI tract) has been thought to be a secondary process to motility disorders; however, it appears that imbalances in the microbiota could actively contribute to the GI symptoms associated with FD.Citation3,Citation20 Several studies have shown that dysbiotic microbiota can produce fewer protective molecules involved in inflammatory and immune responses, including short-chain fatty acids (SCFAs).Citation21 This also contributes to the release of uremic toxins and their precursors, thus accelerating the progression of renal and cardiac dysfunction, which are key clinical signs of FDCitation22–24. Moreover, gut dysbiosis is a common trait in patients with impaired intestinal motility and persistent abdominal painCitation25 and in the pathophysiology of visceral pain in different animal models of chronic GI diseases.Citation26,Citation27 It should be mentioned that, recently, Philstrom et al. (2021) showed the importance of psychological distress in FD patients.Citation28 Notably, it is known that the gut microbiota communicates with the brain along the gut-brain axis,Citation29 whose alterations have been documented in various psychiatric disorders such as anxiety and depression, often accompanied by GI diseases such as IBS and IBD.Citation30,Citation31 However, to date, there are no studies that have characterized the gut microbiota of either FD patients or animal models. An in vitro study has, however, demonstrated that lyso-Gb3, an FD biomarker, increased the capacity for growth and biofilm formation of some members of the gut microbiota, such as Bacteroides fragilis. Moreover, the effects of lyso-Gb3 included reduced production of SCFAs, especially butyrate.Citation12,Citation28 Here, we present the first characterization of microbiota-gut-brain axis dysfunction in the α-Gal A (-/0) mouse model of FD by studying visceral sensitivity, gut motility, fecal microbiota, and SCFAs, along with anxiety-like behavior and locomotor activity. In addition to providing the first evidence of gut microbiota involvement, our study aimed to evaluate the overall adherence of the mouse model of FD to the clinical manifestations of the disease, thus confirming its validity for future studies.
Materials and methods
Animal model
Heterozygous female α-Gal A (±) and wild-type (WT) α-Gal A (+/0) male mice (JAX strain B6; 129Gla-tm1Kul/J) were purchased from Charles River Laboratories Italia s.r.l. (Jackson Laboratory, Bar Harbor, ME, USA) and crossed to generate the F1 generation.Citation14,Citation15 These mice were used from the F1 to the F4 generation as heterozygous females (±, B6; 129-Glatm1Kul/J) crossed with WT males (+/0, B6; 129-Glatm1Kul/J) of the same genetic background (B6; 129-Glatm1Kul/J). From the F4 generation, we obtained α-Gal A (-/-) homozygous females and α-Gal A (-/0) hemizygous males, which were compared to α-Gal A (+/+) and (+/0) as controls. The two homozygous/hemizygous knockout α-Gal A (-/0) and α-Gal A (+/0) groups were separated after at least four generations, which is known to be sufficient to stabilize the background, and all the experiments were performed after more than 10 generations.Citation32 Therefore, well-established KO male mice (hemizygous α-Gal A -/0) were compared to WT male controls (α-Gal A +/0). Because the X inactivation process might have impaired the reproducibility of our model, and because FD is more severe in male patients,Citation15,Citation33 we decided to use exclusively male α-Gal A (-/0) mice in our study.
Mice were housed in groups of six in individually ventilated cages (Tecniplast, Varese, Italy) with water and food ad libitum under controlled environmental conditions: lights on from 7.00 a.m. to 7.00 p.m., 22 ± 2°C temperature, and 65% humidity. Behavioral experiments were carried out at the Department of Medical and Surgical Sciences (DIMEC), University of Bologna (Bologna, Italy), in agreement with the National Animal Welfare Act. All efforts were made to minimize animal suffering, and the total number of animals used (n = 120) was kept to the minimum required by the experimental design. All procedures followed in this work complied with the European Community Council Directive of November 24, 1986 (86/609/EEC) and were approved by the Ethical Committee of the University of Bologna (Veterinary Service of the University of Bologna prot. N. 141/2019PR). All experiments were carried out on three different age groups: 8–10-week-old, 16–20-week-old, and 12-month-old.
Measurement of fecal output and fecal water content
Fecal excretion was assessed for three consecutive days, and stool samples were collected and weighed daily at 9:00 am. Ten mice of each genotype were used in each group. Each animal was individually housed in a clean, clear plastic cage and allowed to acclimatize to the previous day. According to previously published methods,Citation34 mice were monitored constantly for 1 h and fecal pellets were collected immediately after expulsion and placed in sealed (to avoid evaporation) 1.5-ml tubes. The fecal pellets were weighed (wet weight, in mg), dried (60°C, overnight), and weighed again (dry weight, in mg). The fecal water content was calculated according to the following equation: water content (%) = 100 (wet weight – dry weight)/wet weight. Similarly, frequency and total fecal output were assessed every 24 h at the same hour (number of pellets and total weight). Fecal samples were then collected and frozen at −80°C for microbiota and SCFA analysis.
Assessment of intestinal transit time
To study intestinal transit, a carmine red dye assay was used as described by Koester et al.Citation35 Briefly, 250 µL of a sterilized 6% (w/v) solution of carmine red (Sigma-Aldrich, Milan, Italy) in 0.5% methylcellulose (Sigma-Aldrich) was delivered per mouse via oral gavage. Fecal output was monitored every 30 min or more frequently if stool passed spontaneously. The time from gavage to the appearance of bright red dye was recorded as whole intestinal transit time.
Assessment of visceral sensitivity by visceromotor response
Visceromotor response (VMR) to colorectal distension was used as an objective measure of visceral sensitivity. According to a previously described method,Citation36 two electromyographic (EMG) electrodes were sutured into the external oblique abdominal muscle under deep anesthesia and exteriorized dorsally. VMR assessments were performed under light anesthesia (2% isoflurane). To perform colorectal distension, a lubricated latex balloon was used, assembled into an embolectomy catheter, and connected to a syringe filled with various volumes of water (50, 100, 150/200, and 300 µl). The electrodes were relayed to a data acquisition system, and the corresponding EMG signals were recorded, amplified, filtered (Animal Bio Amp, ADInstruments, Colorado Springs, CO, USA), digitized (PowerLab 4/35, ADInstruments), analyzed, and quantified using LabChart 8 (ADInstruments). To quantify the magnitude of VMR at each distension volume, the area under the curve (AUC) immediately before distension (30 s) was subtracted from the AUC during balloon distension (30 s), and the responses were expressed as a percentage increase from the baseline. The time elapsed between two consecutive distensions was 5 min.
Assessment of visceral sensitivity by abdominal withdrawal reflex
Behavioral responses to Colon-Rectal Distension (CRD) were assessed via Abdominal Withdrawal Reflex (AWR) measurement using a semiquantitative score in conscious animals.Citation36 Briefly, mice were anesthetized with isoflurane, and a lubricated latex balloon, attached to polyethylene tubing, assembled into an embolectomy catheter and connected to a syringe filled with water, was inserted through the anus into the rectum and descending colon. The tubing was taped to the tail in order to hold the balloon in place. The mice were then allowed to recover from anesthesia for 30 min. AWR measurement consisted of visual observation of animal responses to graded CRD (50, 100, 150/200, 300 µl) by blinded observers who assigned an AWR score: no behavioral response to CRD (0); immobility during CRD and occasional head clinching at stimulus onset (1) mild contraction of the abdominal muscles but no abdominal lifting from the platform; (2) strong contraction of the abdominal muscles and lifting of the abdomen off the platform (3); arching of the body and lifting of the pelvic structures and scrotum (4).
Anxiety-like behavior and locomotor activity assessment – open field (OF) procedure
Animals were allowed to habituate to the testing room for 1 h prior to starting the behavioral test. The open field test (OF) was performed to investigate anxiety-like behavior. The OF apparatus consisted of a square arena measuring 50 cm × 50 cm, divided into two areas: the center zone and the surrounding area. Animals were introduced into the center of the arena one at a time and were allowed to explore for 10 min. The animals were then removed and immediately placed in their home cages. The arena was cleaned before placing the next animal. The test was run out between 09:00 and 15:00 and the behavior was videotaped and scored by EthoVision XT 15© (Noldus Information Technology B.V., Wageningen, The Netherlands). Data are expressed as frequency and cumulative duration (s) in the center, periphery, and total distance traveled (cm).
Anxiety-like behavior and locomotor activity assessment – elevated plus maze (EPM) procedure
Mice were placed in the experimental room 1 h before the test. The apparatus consisted of two open arms, two enclosed arms of the same size (30 × 8 cm), and a central area (8 × 8 cm); placement was 50 cm above the floor. At the beginning of the session, mice were placed in the central part of the maze facing one of the open arms. The number of entries and the time spent in the open and closed arms were recorded for 5 min. An entry was defined as the mice entering into an arm with all four paws. The test was run out between 9:00 and 15:00 and the behavior was videotaped and scored by EthoVision XT 15© (Noldus Information Technology B.V.).
Microbial DNA extraction and 16S rRNA amplicon sequencing
Microbial DNA was extracted from fecal samples using the QIAamp DNA Stool Mini Kit (QIAGEN, Hilden, Germany), according to the protocol described by Eeckhout and Wullaert (2018), with a few modifications as described below.Citation37 Briefly, 200–300 mg of feces was weighed for each sample, and 0.5 g of zirconia beads (0.1-mm diameter), 4 glass beads (3-mm diameter) and 1.4 ml of ALS lysis buffer (QIAGEN) were added. Chemical lysis was supported by mechanical lysis performed with a FastPrep Instrument (MP Biomedicals, Irvine, CA, USA) through three homogenization steps of 1 min at five movements/s, interspersed with 5 min of incubation on ice. Then, samples were incubated at 95°C for 5 min to complete cell membrane lysis by heat shock, and centrifuged at 13,000 rpm for 1 min at 4°C. The supernatants were incubated with half InhibitEX Tablet (QIAGEN) to remove the inhibitory substances. After further centrifugation at 13,000 rpm for 3 min at room temperature, the supernatants were incubated with 15 µl of Proteinase K and 200 µl of AL buffer (QIAGEN) at 70°C for 10 min to remove any residual protein. The DNA was then purified using QIAGEN spin columns according to the manufacturer’s instructions. Extracted DNA was quantified using a NanoDrop ND 100 spectrophotometer (NanoDrop Technologies, Wilmington, DE, USA).
The V3-V4 hypervariable regions of the 16S rRNA gene were amplified using primers 341F and 785 R, including overhang adapter sequences for Illumina sequencing, according to the “16S Metagenomic Sequencing Library Preparation” protocol (Illumina, San Diego, CA, USA). Amplicons were purified using a magnetic bead-based system (Agencourt AMPure XP, Beckman Coulter, Brea, CA, USA) and indexed using NextEra technology by limited-cycle PCR. After further purification, final libraries were prepared by pooling the samples at 4 nM, denaturing the pool with 0.2 NaOH and diluting it to 5 pM. Sequencing was performed on an Illumina MiSeq platform using a 2 × 300 bp paired-end protocol according to the manufacturer’s instructions. Raw sequencing reads were deposited in the European Nucleotide Archive (ENA) under accession number PRJEB61216.
Gas chromatography-mass spectrometry determination of short-chain fatty acids (SCFAs) in fecal samples
Quantification of SCFAs was performed using a headspace solid-phase microextraction gas chromatography-mass spectrometry (HS-SPME GC-MS) method previously validated by the same authors.Citation38 Briefly, 250-mg aliquots of fecal samples were homogenized in 10% perchloric acid solution and then centrifuged at 15,000 rpm for 5 min at 4°C. Fifty microliters of supernatant were added to an internal standard (IS, D8-butyric acid) and diluted 1:10 in water. Calibration was performed by analyzing spiked sample solutions and water standard solutions at scalar SCFA concentrations (external standardization). The obtained solutions were subjected to HS-SPME and GC-MS analysis. HS-SPME operated under the following conditions: temperature of 70°C, 10 min equilibration and 30 min extraction, 75 µm CarboxenTM/polydimethylsiloxane fiber (Supelco, Sigma-Aldrich). Analytes were desorbed using a GC injector at 250°C for 10 min. GC-MS analysis was performed using a TRACE GC Gas Chromatograph (Thermo Fisher Scientific, Waltham, MA, USA), interfaced with a GCQ Plus mass detector (Thermo Fisher Scientific) with an ionic trap analyzer operating with an electron impact (EI) ion ionization source (70 eV). The capillary column used for GC was a Phenomenex ZB-WAX (30 m × 0.25 mm ID, 0.15 µm). Helium (SIAD S.p.a.) was used as the carrier gas at 1 ml/min. The thermal program was 40°C for 5 min, increased by 10°C/min until 220°C was reached, and held for 5 min. The temperature of the EI source was maintained at 200°C, while the transfer line was maintained at 250°C. Injector base was at 250°C in splitless mode. Mass spectra were analyzed in full-scan (34–200 m/z) and extract ion mode (EIM) on the EI-generated ions: 45 and 60 m/z for acetic acid, 55 and 73 m/z for propionic acid and isobutyric acid, 60 and 73 m/z for butyric and valeric acid, 60 and 87 m/z for isovaleric acid, and 63 and 77 m/z for the internal standard (D8-butyric acid). The concentration of SCFAs was expressed in µmol/g stool. The range for the detection limit was 4–68 nmol/g.
Bioinformatics and statistical analysis
Microbiota sequencing data were processed using PANDASeqCitation39 and QIIME 2.Citation40 Reads were filtered for length and quality and binned into amplicon sequence variants (ASVs) using DADA2.Citation41 The SILVA SSURef database v138 was used for taxonomic assignment. PICRUSt2 was used on the raw DADA2 output for functional inference in the form of KEGG orthologs.Citation42 Gut-Brain Modules (GBMs) and Gut-Metabolic Modules (GMMs) were calculated using R version of the Gomixer tool.Citation43 The iNEXT library was used to compute the alpha diversity for the first three hill numbers (Chao1, Shannon entropy and Simpson Index).Citation44 The changes in alpha diversity were assessed using linear models.Citation45 Beta diversity was computed as Aitchison distance (Euclidean distance of centered log-ratio (clr)-transformed counts), and data separation was tested by the PERMANOVA implementation from the vegan library with 1,000 permutations.Citation46 The differential abundance of taxa and functional modules was assessed by fitting base R linear models to clr-transformed count tables. To correct for multiple testing, the Benjamini–Hochberg procedure was used with a false discovery rate (FDR) q-value of 0.1.Citation47 Plotting was performed using ggplot2. All R scripts are available online at https://github.com/thomazbastiaanssen/Tjazi. Further data handling was performed in R (version 4.1.2) using RStudio GUI (version 1.4.1717). Two-way ANOVA was used to assess differences in visceral sensitivity, gut motility, anxiety-like behavior, locomotor activity, and fecal SCFA levels. Where relevant, post hoc analysis was conducted using Bonferroni’s or Tukey’s post hoc tests. Statistical significance was set at p < .05. Data are expressed as mean ± SEM or mean ± SD, as reported below.
Results
α-Gal A (-/0) mice exhibit a diarrheal-like phenotype
Since diarrhea is one of the main GI symptoms complained by FD patients, we investigated whether our animal model reproduced this phenotype. First, we found that α-Gal A (-/0) mice had a significantly higher fecal output at 24 h with regard to both the number of pellets () and the total weight () in 8–10-week-old, 16–20-week-old, and 12-month-old mice (ANOVA, p < 0.005). Interestingly, although the number of pellets progressively decreased significantly in both genotypes at the three ages studied (Supplementary Table S1), fecal pellet weight increased significantly over time only in α-Gal A (-/0) and remained constant in controls. Secondly, we assessed fecal water content (%) and found that pellets collected from α-Gal A (-/0) contained significantly more water than controls (p < .001) (). Thirdly, we administered the non-absorbable non-nutrient solution containing carmine red to investigate intestinal motility. As shown in , the time for the first red pellet to occur was significantly shorter in α-Gal A (-/0) mice compared to controls across all ages. Together, these findings are consistent with altered motility (and absorption) within the gastrointestinal tract leading to a diarrheal-like phenotype in FD mice.
Figure 1. Diarrhea-like phenotype in α-Gal A (-/0) mice. stool analysis was carried out on α-Gal A (-/0) mice (gray bars) and α-Gal A (+/0) controls (white bars) at the age of 8–10-week-old (T1), 16–20-week-old (T2), and 12-month-old (T3). The fecal output was measured as number of pellets (a) and mg produced in 24 h (b). The water content (c) was calculated after one hour according to the equation: water content (%) = 100 (wet weight – dry weight)/wet weight. Data are expressed as mean ± SEM of 10 animals per group (n = 10). Two-way ANOVA test with Bonferroni post-correction, *p < 0.05, **p < .01 and ***p < .001 VS α-Gal A (+/0) mice. (d) whole gut transit time was measured by the carmine red method in control and FD mice. Data are presented as mean ± SEM and the number of animals per group is 3. Data were compared using two-way ANOVA followed by Tukey’s post hoc test. Differences were considered significant at the p < .05 level.
α-Gal A (-/0) mice display a visceral hypersensitivity phenotype in response to colorectal distension
To evaluate whether there were differences in visceral sensitivity between α-Gal A (+/0) and α-Gal A (-/0) mice, we measured the VMR and AWR to CRD. α-Gal A (-/0) mice displayed higher abdominal responses to colorectal stimuli than controls at each age (). In particular, the VMR of α-Gal A (-/0) mice significantly increased in response to balloon inflation with volumes ≥100 µl at all three studied ages ( and Supplementary Table S1). When scoring the behavioral nocifensive response to CRD through the AWR test, we found that α-Gal A (-/0) mice showed both a significantly greater sensitivity than controls, being responsive even at the lowest distension volume (50 µl), and a significantly higher score for all stimuli applied ( and Supplementary Table S1).
Figure 2. Visceral hypersensitivity in α-Gal A (-/0) mice. visceral sensitivity was assessed in 8–10-week-old (T1), 16–20-week-old (T2), and 12-month-old (T3) α-Gal A (-/0) mice (gray) and α-Gal A (+/0) controls (white), by measuring the electromyography (EMG) amplitude of abdominal contraction (VMR, visceral-motor response) under light anesthesia (left panel, A-B-C) and scoring behavioral responses (AWR, abdominal withdrawal reflex) in awake animals (right panel, D-E-F) to colorectal distension with increasing volumes (50–300 µl balloon inflation). Each value represents the mean ± SEM of 10 animals per group (n = 10). *p < .05, **p < .001 and ***p < .001VS α-Gal A (+/0) animals.
α-Gal A (-/0) mice are characterized by decreased locomotor activity and anxiety-like behavior
In the OF test, α-Gal A (-/0) mice showed a significant decrease in the frequency of visits to the periphery, but not in the center, of the arena at all three studied ages ( and Supplementary Table S1). However, the time spent in the periphery was significantly increased compared to control mice ( and Supplementary Table S1). At the same time, we observed a statistically significant decrease in time spent in the center starting from 16 to 20 weeks of age ( and Supplementary Table S1). Furthermore, we observed that α-Gal A (-/0) mice exhibited decreased spontaneous activity throughout the time spent in the OF compared to control littermates at 1 y of age. This difference was not observed at 8–10 and 16–20 weeks of age. Post hoc analysis revealed that the reduction in locomotor activity observed in α-Gal A (-/0) mice was directly related to age ( and Supplementary Table S1). In the EPM, at all the studied ages, no significant differences were found between α-Gal A (-/0) and α-Gal A (+/0) mice either in % frequency, % time in closed arms or total entries (Supplementary Figure S1).
Figure 3. Anxiety-like behavior and locomotor activity in α-Gal A (-/0) mice. experiments were carried out on 8–10-week-old (T1), 16–20-week-old (T2), and 12-month-old (T3) α-Gal A (-/0) mice (gray) and α-Gal A (+/0) controls (white). Data are representative of at least three independent experiments performed on 8–11 animals (n = 8–11) per group per genotype. Anxiety-like behavior was measured as (a) frequency in the periphery (%); (b) time in periphery and (c) total distance moved (cm). Values represent means ± SEM. Two-way ANOVA followed by Tukey’s post hoc test was applied. *p < .05; **p < .01; ***p < .001 VS α-Gal A +/0; ##p < .01; ###p < .001 VS same genotype.
α-Gal A (-/0) mice show compositional and functional dysbiosis of the gut microbiota
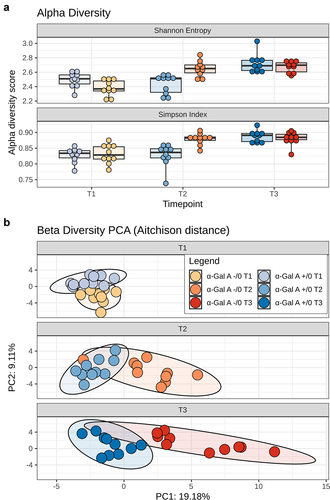
16S rRNA amplicon sequencing yielded a total of 570,308 reads (mean ± SD, 9,505 ± 1,624), binned into 3,630 ASVs. Alpha diversity increased with age in both α-Gal A (−/0) and α-Gal A (+/0) mice (pTukey ≤ 0.001). However, at 16–20 weeks, it was significantly higher in α-Gal A (−/0) mice than in α-Gal A (+/0) mice (pTukey < 0.001) (). PERMANOVA analysis of beta diversity, including all six groups, revealed that both age and genotype had significant effects in both α-Gal A (-/0) and α-Gal A (+/0) mice, as well as between the two groups of mice at all ages (p ≤.005) ().
Figure 4. Alpha and beta diversity of the gut microbiota in α-Gal A (-/0) mice. a, Boxplots showing the distribution of alpha diversity, according to Shannon entropy and Simpson index, in the gut microbiota of α-Gal A (-/0) mice (orange hues) and α-Gal A (+/0) controls (blue hues) at 8–10-week-old (T1), 16–20-week-old (T2), and 12-month-old (T3) (n = 10 each group). Tukey test, ***p < .001. b, Principal component analysis (PCA) of beta diversity, based on Aitchison distance, of all fecal samples. A significant separation was found between groups of mice at each age and within each mouse group over time (PERMANOVA, p ≤ .005).
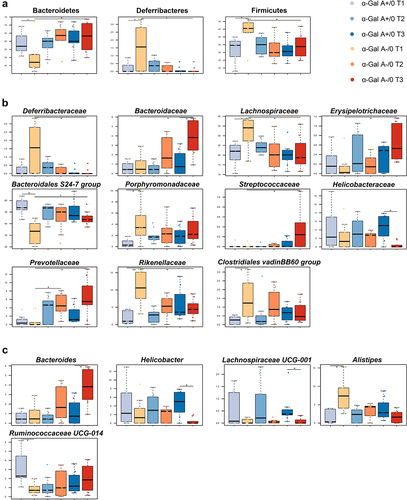
In terms of taxonomic differences, at 8–10 weeks of age, α-Gal A (-/0) mice showed increased proportions of Deferribacteres (Wilcoxon test, p = .05) and Firmicutes (p = .02) and a reduction in Bacteroidetes (p = .02) compared to α-Gal A (+/0) mice (). These differences were no longer apparent at 1 y of age, as the proportions of Deferribacteres and Firmicutes decreased, while those of Bacteroidetes increased in α-Gal A (-/0) mice compared to their younger counterparts (p = .02). The main families involved were those belonging to the phylum Bacteroidetes, characterized by an enrichment of Porphyromonadaceae and Rikenellaceae and a depletion of Bacteroidales S24–7 group at 8–10 weeks of age in α-Gal A (-/0) mice compared to α-Gal A (+/0) mice (p ≤ 0.016) (). At 8–10 weeks, α-Gal A (-/0) mice also showed increased proportions of Lachnospiraceae and Clostridiales vadinBB60 group compared to α-Gal A (+/0) mice (p = 0.02). At 12 months of age, α-Gal A (-/0) mice showed increased levels of Prevotellaceae, Bacteroidaceae, Bacteroidales S24–7 group, Erysipelotrichaceae, and Streptococcaceae and decreased levels of Lachnospiraceae, Deferribacteraceae, and Rikenellaceae compared to 8–10-week-old α-Gal A (-/0) mice (p ≤ 0.03). The temporal increase in Prevotellaceae abundance was also significant at 16–20 weeks (p = .02). Finally, at 12 months of age, the Helicobacteraceae family was underrepresented in α-Gal A (-/0) mice compared to α-Gal A (+/0) mice (p = .03). The major discriminating genera were Alistipes, Bacteroides, Ruminococcaceae UCG-014, Helicobacter, and Lachnospiraceae UCG-001. Alistipes and Bacteroides were overrepresented in α-Gal A (-/0) mice compared with α-Gal A (+/0) mice at 8–10 weeks and 1 y, respectively (p ≤ 0.03). In contrast, Ruminococcaceae UCG-014 was underrepresented in α-Gal A (-/0) mice at 8 weeks of age, similar to Helicobacter and Lachnospiraceae UCG-001 at 1 y of age (p ≤.03) ().
Figure 5. Potential compositional signatures of gut microbiota dysbiosis in α-Gal A (-/0) mice. boxplots showing the relative abundance distribution of differentially represented phyla (a), families (b) and genera (c) between α-Gal A (-/0) mice (orange hues) and α-Gal A (+/0) controls (blue hues) at each age (8–10-week-old (T1), 16–20-week-old (T2), and 12-month-old (T3) (n = 10 each group)), and within each mouse group over time (Wilcoxon test, *p < .05, **, p < .01). Only taxa with relative abundance > 0.5% in at least 1 sample are shown.
To obtain functional insights into changes in the gut microbiome of α-Gal A (-/0) mice, 16S rRNA gene sequencing data were used to predict microbiota functionalities in the form of KEGG orthologs using PICRUSt2Citation42 (Supplementary Figure S2). In particular, compared to controls, α-Gal A (-/0) mice at 8–10 weeks of age showed an overrepresentation of predicted functions involved in the dissimilatory sulfate reduction process and degradation of urea and the amino acids aspartate, glutamine, histidine, lysine, proline, and tryptophan (p < .05). The tryptophan and lysine degradation pathways were also predicted to be overabundant at 16–20 weeks and 1 y of age, respectively (p < .05). On the other hand, compared to controls, α-Gal A (-/0) mice at 8–10 weeks were depleted in functions involved in the degradation of other amino acids (i.e., arginine, cysteine, threonine, and tyrosine), mucin, and sugars arabinose, fructose, maltose, sucrose, trehalose, and xylose. Similarly, the predicted metabolic functionalities related to energy production (e.g., those involved in glycolysis and the citrate cycle) were depleted in α-Gal A (-/0) mice (p < .05). At 16–20 weeks, no such changes were observed. However, at 1 y of age, α-Gal A (-/0) still differed for some of the aforementioned predicted functions but also for rhamnose and fucose degradation, which were enriched in α-Gal A (-/0) mice, and Bifidobacterium shunt, which was enriched in α-Gal A (+/0) mice (p ≤.03).
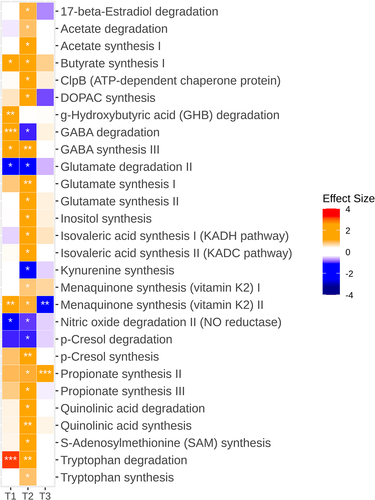
With respect to modules related to the gut-brain axis, it is worth noting that at 8–10 weeks, α-Gal A (-/0) mice were discriminated by an overrepresentation of functions involved in gamma-aminobutyric acid (GABA) degradation and synthesis, gamma-hydroxybutyric acid degradation, butyrate synthesis, and menaquinone synthesis, and by underrepresentation of nitric oxide degradation and glutamate degradation (p ≤.03) (). At 16–20 weeks, the predicted deficit in nitric oxide degradation persisted, as well as the overrepresentation of modules implicated in GABA, butyrate, and menaquinone synthesis (p < .05). An overabundance of predicted biosynthetic functions for p-cresol, propionate, acetate, iso-valeric acid, glutamate, 3,4-dihydroxyphenylacetic acid (DOPAC), S-adenosylmethionine, quinolinic acid, and inositol was also observed at this time point (p < .05). α-Gal A (-/0) mice also showed increased degradation of quinolinic acid and reduced degradation of p-cresol and kynurenine (p < .05). At 12 months, overrepresentation of the functions involved in propionate synthesis persisted (p < .001).
Figure 6. Alterations in predicted gut microbiota functions related to the gut-brain axis in α-Gal A (-/0) mice. Heatmap showing the differential abundance of significantly altered neuroactive gut-brain modules between α-Gal A (-/0) mice and α-Gal A (+/0) controls at each age (at 8–10-week-old (T1), 16–20-week-olg (T2), and 12-month-old (T3) (n = 10 each group)). Stars indicate Benjamini-Hochberg-adjusted p-values (*padj < 0.1, **padj < .01, ***padj < .001). Colors of the cells indicate the effect size (β); red hues indicate higher levels in α-Gal A (-/0) mice, whereas blue hues indicate higher levels in α-Gal A (+/0) controls.
α-Gal A (-/0) mice exhibit a selective increase of fecal propionic and butyric acid
The total amount of SCFAs (µmol/g) gradually increased over time in α-Gal A (-/0) mice compared to α-Gal A (+/0) mice, as they increased with age (). Although there were no significant differences at 8–10 and −16–20 weeks of age, total SCFAs significantly increased in older mice. The increase in the total amount of SCFAs at 1 y of age was also statistically significant when compared to the amount measured at 8–10 weeks for the same genotype. Thus, it can be said that the SCFA increase is both genotype- and time-related ( and Supplementary Table S1). Analysis of individual SCFAs revealed that the butyric acid significantly increased at 8–10 weeks only ( and Supplementary Table S1). Its isomer, isobutyric acid, exhibited a very similar trend, with overall higher values in α-Gal A -/0 mice than in α-Gal A +/0 mice, but significant only at 8–10 weeks ( and Supplementary Table S1). Regarding acetic acid, no differences were found between the two genotypes; however, α-Gal A (-/0) mice showed a significant age-dependent increase ( and Supplementary Table S1). The third most extensively produced SCFA is propionic acid, which exhibited an interesting trend. It was found to undergo both a genotype- and time-dependent effect ( and Supplementary Table S1). In particular, in α-Gal A (-/0) mice, the amount was progressively greater than that in the controls. This increase was markedly different within the same genotype at the different time points analyzed, in contrast to α-Gal A (+/0) mice, in which propionic acid levels remained constant over time. Finally, no difference was found in valeric and isovaleric acids between α-Gal A (-/0) and α-Gal A (+/0) mice. However, it should be noted that valeric acid decreased in α-Gal A (-/0) mice at 16–20 weeks compared to the same genotype at 8–10 weeks ( and Supplementary Table S1).
Figure 7. Alterations in fecal short-chain fatty acid levels in α-Gal A (-/0) mice. experiments were carried out on 8–10-week-old (T1), 16–20-week-old (T2), and 12-month-old (T3) α-Gal A (-/0) mice (gray) and α-Gal A (+/0) (white). Short-chain fatty acid (SCFA) levels were measured in µmol/g. (a) total SCFAs; (b) butyric acid; (c) acetic acid; (d) propionic acid; (e) iso-butyric acid; (f) valeric acid; (g) isovaleric acid. Data are shown as means ± SEM. Two-way ANOVA followed by Tukey’s post hoc test was applied (n = 10, each group). *p < .05; **p < .002; ***p < .001 VS α-Gal A +/0; #p < .05 ##p < .002; ###p < .001 VS the same genotype.
Discussion
GI symptoms, such as abdominal pain, diarrhea, bloating, nausea, and vomiting, are the most common symptoms and have debilitating effects on the life of patients with FD, leading to reduced quality of life, specifically during childhood. In addition, FD, like many other GI disorders, is associated with mood disorders such as anxiety and depression.Citation48,Citation49 In fact, patients with FD show social adaptive functioning deficits correlated with anxiety and depression.Citation50 The gut-brain axis includes endocrine, humoral, metabolic, and immune pathways, and it is now well accepted that the microbiota influences bidirectional communication between the gut and the brain.
Here, we used a murine model of FD (α-Gal A -/0 mouse) to characterize the functionality, behavior, and microbiome, to elucidate the microbiota-gut-brain axis in FD. Thus, we sought to investigate not only the strictly related GI manifestations (diarrhea and visceral pain) but also the affective behavior and microbiota. Although it is widely accepted that Gb3 and lyso-Gb3 are involved in these symptoms, the underlying pathophysiology is likely to be complex and multifactorial.Citation3,Citation20,Citation51
Our results show that the fecal output and fluid content in FD mice are consistent with the diarrheal phenotype. Diarrhea is a diagnostic and therapeutic challenge in FD because of its multiple origins. Indeed, secretory function and motility are two crucial aspects contributing to diarrhea.Citation52 Among the most common underlying causes of diarrhea are autonomic neuropathies, a trait present in FD that is associated with accelerated transit or an increased number of high-amplitude propagated contractions.Citation53,Citation54
Our results also demonstrated an increased visceral sensitivity in FD mice compared to controls at all ages analyzed. Visceral hypersensitivity (lowered threshold) and hyperalgesia (increased response) to CRD are common traits of both inflammation- and stress-induced GI diseases in animals and are directly related to the presence of abdominal pain.Citation36,Citation55
Considering that previous results have shown a reduction in the number of nerve fibers innervating the mucosa with scattered patterns, together with the presence of Gb3 deposits in FD,Citation19 it could be speculated that visceral hypersensitivity in FD might be a consequence of enteric neuroplastic phenomena, suggesting a neuropathic nature for this type of pain. Nevertheless, the multifactorial origin seems to be the most trustworthy hypothesis, given the alteration of a set of co-presenting factors, such as the described morpho-functional and/or microbiota variations.
Clinical evidence has reported that patients with chronic diarrhea, nausea, vomiting, IBS, or stomach pain often experience related psychological issues, including anxiety and depression.Citation56,Citation57 FD patients are also considered to be at a higher risk of developing neuropsychiatric symptoms, such as depression or neuropsychological deficits.Citation58,Citation59 These behavioral aspects may be initiated or exacerbated by pain or discomfort, and long-term stress could enhance pain perception and sensitize pain pathways, further affecting chronic visceral pain.Citation60 This theory is supported by the higher efficacy of antidepressant and antiepileptic drugs (via restoring neuronal activity) compared with anti-inflammatory treatments in patients.Citation61 The major limitation of these clinical studies linking pain and affective disorders in FD is that neuropsychological changes during treatment are mostly secondary endpoints that may be influenced by treatment-associated improvement in organ function.Citation62
We next focused on anxiety-like traits, which, according to the largest and most recent survey of 106 Italian FD patients, are reported by 66.7% of them, without distinction between different ages. To investigate a possible correlation between clinical and preclinical data, we performed anxiety-like behavior studies in our animal model using two different tests such as OF and EPM. Notably, several experimental evidences have demonstrated that the OF test is more effective to study the anxiety trait compared to EPM, a test that is more sensitive to study anxiety states.Citation63 Our data showed that when exposed to OF, α-Gal A (-/0) mice displayed anxiety-like trait behavior, as we found a significant increase in time spent in the periphery followed by a decrease in center time in α-Gal A (-/0) mice compared to controls in an age-dependent manner. Furthermore, we found a lower frequency that could be correlated with decreased mobility, which is in line with clinical evidence that 28.3% of FD patients report difficulties with locomotor activity, and approximately 1% are bedridden.Citation64–66 On the contrary, we did not find an anxiety-like behavior state, as our data showed no statistically significant differences between control and α-Gal A (-/0) mice exposed to EPM at the studied ages. Considering these results, we could conclude that our animal model exhibited an anxiety-like behavior trait in line with clinical evidence.
Finally, regarding the gut microbiota, our results showed a different composition between α-Gal A (-/0) and α-Gal A (+/0) mice at all ages. We revealed differences even at a high phylogenetic level (i.e., phylum), which were mainly accounted for by dominant taxa of the core mouse microbiota, suggesting a clearly distinct microbial assembly and trajectory between ages and experimental groups. In particular, young α-Gal A (-/0) mice were characterized by higher proportions of the families Rikenellaceae (particularly Alistipes) and Porphyromonadaceae and lower proportions of Bacteroidales S24–7 group (recently renamed Muribaculaceae). Interestingly, some species of Alistipes are known to trigger gut barrier dysfunction and inflammation and have been implicated in anxiety and depressive disorders, possibly through the degradation of tryptophan to indole, followed by a reduction in serotonin levels and increased production of GABA.Citation67,Citation68 The latter hypothesis is supported by inferred metagenomics suggesting increased tryptophan degradation and GABA synthesis up to 16–20 weeks of age, as discussed below. Other Bacteroidetes families, including Bacteroidaceae and Prevotellaceae, increased with age in α-Gal A (-/0) mice. These families include the major gut microbiota producers of propionate,Citation69 an SCFA whose fecal levels were consistently increased in α-Gal A (-/0) mice, especially with advancing age. Although generally considered a beneficial molecule, propionate at high concentrations may be associated with metabolic and neurodegenerative disorders, possibly through impairment of the urea cycle, citrate cycle, and related enzymes,Citation70 as well as with IBS (particularly the diarrhea-predominant subtype), through alteration of the gut serotonergic system, with increased motility and induction of visceral hypersensitivity.Citation71,Citation72 Young α-Gal A (-/0) mice also had higher proportions of Lachnospiraceae, a family known to include major butyrate producers, whose levels (and predicted biosynthetic pathways) were actually higher than those in α-Gal A (+/0) mice. Similar to propionate, butyrate has been found to be increased in IBS patients suffering from diarrheaCitation73 and has been shown to evoke prolonged propagated contractions, either directly or through increased serotonin production. α-Gal A (-/0) mice were also enriched in the potentially pro-inflammatory taxa Deferribacteraceae, Streptococcaceae and Erysipelotrichaceae while depleted in Helicobacter, another genus that is part of the healthy core gut microbiota of mice.Citation43 Interestingly, the compositional alterations found in the FD model reflected a sharply distinct metagenome, potentially indicative of a pro-inflammatory ecosystem, less able to support gut homeostasis and with impaired production of neuroactive metabolites. In particular, increased dissimilatory sulfate reduction, propionate and butyrate synthesis, and proteolytic capabilities (i.e., degradation of amino acids, especially tryptophan) were predicted. The dissimilatory sulfate reduction pathway leads to the production of hydrogen sulfide, a highly toxic compound that induces inflammatory responses and DNA damage, and has already been implicated in GI symptoms.Citation74 With regard to tryptophan, its increased degradation, combined with reduced kynurenine synthesis and increased synthesis/degradation of quinolinic acid, seems to suggest an increased disposal of this amino acid via the kynurenine pathway, and therefore its reduced availability for enteric serotonin production.Citation75 Gut serotonin not only plays an important role in gut physiology and visceral sensitivity, but has also been implicated in the pathogenesis of psychiatric disorders such as anxiety and depression.Citation76,Citation77 Finally, α-Gal A (-/0) mice also showed increased degradation of gamma-hydroxybutyric acid (a neurotransmitter that inhibits intestinal peristalsis)Citation78 and increased synthesis (and reduced degradation) of p-cresol, a microbial metabolite derived from tyrosine, which has been hypothesized to impair the central dopamine balance and social reward circuit, possibly inducing autistic-like behaviors in mice.Citation79 Although FD does not appear to result from inflammatory processes, as suggested by the lack of clear morphological evidence at the tissue level, we cannot exclude the possibility that similar mechanisms might link gut dysbiosis to the pain, motility, and anxiety-like behavior exhibited by α-Gal A (-/0) mice. From a medical point of view, enzyme replacement therapy with recombinant α-Gal A is available and has been shown to be effective in improving GI and other FD-related symptoms,Citation80 even though a proportion of patients still experience GI symptoms despite FD-specific therapy.Citation3 Similarly, repeated intravenous administration of human α-Gal A encoding mRNA in the FD mouse model showed a sustained pharmacodynamic response and efficacy against various manifestations of the disease, although GI effects were not evaluated.Citation81 A clinical study in seven patients with FD reported the efficacy of oral α-Gal A-based therapy, particularly on abdominal pain, which decreased significantly after 8 weeks of treatment, with a general amelioration of GI symptoms.Citation82 In this regard, it is interesting to note that non-FD patients with IBS symptoms due to galacto-oligosaccharide intolerance benefit from a low-FODMAP dietCitation83 or α-Gal A nutritional supplements.Citation84 Within the intestine, α-Gal A may break down complex galacto-oligosaccharides, probably reducing bowel symptoms by decreasing the colonic fermentation and altering the gut microbiota. The same scenario might arise in FD patients, as well as in the animal model of the disease. Indeed, a recent retrospective analysis revealed that a low-FODMAP diet can significantly improve GI manifestations, like indigestion, diarrhea, and constipation in FD patientsCitation85. FD-related symptoms might therefore benefit from either reduction of galacto-oligosaccharides or their proper digestion. Some major limitations of the study should be mentioned: i) the use of an animal model that should be validated in humans; ii) the lack of truly functional microbiota profiling, such as that achievable through shotgun metagenomics and metatranscriptomics; and iii) the use of a targeted metabolomics approach limited to SCFA measurement.
In summary, we provide evidence of a diarrhea-like phenotype and visceral hypersensitivity in our FD model, together with anxiety-like trait behavior and reduced locomotor activity. Additionally, early compositional and functional dysbiosis of the gut microbiota, paralleled by alterations in fecal SCFA levels, was observed, which partly persisted with advancing age. Interestingly, most of the dysbiotic features suggested a disruption of gut homeostasis, possibly contributing to accelerated intestinal transit, visceral hypersensitivity, pro-inflammatory processes, and impaired communication along the gut-brain axis. Once confirmed in large cohort studies, possibly using a multi-omics approach (including untargeted metabolomics in blood), this evidence might pave the way for the design of microbiota-tailored intervention strategies to reduce FD-related symptoms and improve patients’ overall quality of life.
Authors contribution
D.C., R.R., and F.F. managed the maintenance of the mouse colony, designed and performed all the molecular and behavioral experiments and their analyses, and critically revised the manuscript; D.C. and LE. performed the visceral sensitivity and gut motility experiments and critically revised the manuscript; D.C., S.D., I.N., and F.J performed the fecal microbiota and short-chain fatty acid experiments, analysis, and critically revised the manuscript; G.C., L.R., H.N.P, C.J.F., and C. M. critically revised the manuscript and contributed reagents; B.T.F.S. and U.F. performed the microbiota analysis and critically revised the manuscript; D.C.,T.S., D.C.M.L., and C.M. conceived, designed, and supervised the project and wrote the paper. All authors have read and approved the final manuscript.
Supplemental Material
Download Zip (2.7 MB)Acknowledgments
This work was supported by Fondazione Cassa di Risparmio in Bologna (2020.0404) to M.C. CD was supported by the University of Bologna as a PhD student in the Department of Pharmacy and Biotechnology. We are grateful to Dr Carmen Parisio (Dept. Neurofarba, University of Florence, Florence, Italy) for her practical support in visceral behavioral assessments. F.U. received funding from the European Union’s Horizon 2020 Research and Innovation Programme under Marie Skłodowska-Curie grant agreement No 754535. The research was conducted at the APC, financially supported by the Science Foundation Ireland (SFI) under Grant Number SFI/12/RC/2273-P2.
Disclosure statement
No potential conflict of interest was reported by the author(s).
Data availability statement
All sequencing data associated with this study have been uploaded to the European Nucleotide Archive (ENA) repository, Primary Accession: PRJEB61216 in https://www.ebi.ac.uk/. All R scripts are available online at https://github.com/thomazbastiaanssen/Tjazi.
Supplementary material
Supplemental data for this article can be accessed online at https://doi.org/10.1080/19490976.2023.2256045.
Additional information
Funding
References
- Germain DP. Fabry disease. Orphanet J Rare Dis. 2010;5(1):30. doi:10.1186/1750-1172-5-30.
- Lenders M, Brand E. Fabry disease: the Current treatment landscape. Drugs. 2021;81(6):635–22. doi:https://doi.org/10.1007/s40265-021-01486-1.
- Hilz MJ, Arbustini E, Dagna L, Gasbarrini A, Goizet C, Lacombe D, Liguori R, Manna R, Politei J, Spada M, et al. Non-specific gastrointestinal features: could it be Fabry disease? Dig Liver Dis. 2018 [[cited 2018 Aug 3]];50(5):429–437. W.B. Saunders. doi:10.1016/j.dld.2018.02.011.
- Toyooka K. Fabry disease. Curr Opin Neurol. 2011;24(5):463–468. doi:10.1097/WCO.0b013e32834a9433.
- Zar-Kessler C, Karaa A, Sims KB, Clarke V, Kuo B. Understanding the gastrointestinal manifestations of Fabry disease: promoting prompt diagnosis. Therap Adv Gastroenterol. 2016;9(4):626–634. doi:10.1177/1756283X16642936.
- Politei J, Durand C, Schenone AB, Torres A, Mukdsi J, Thurberg BL. Chronic intestinal pseudo-obstruction. Did you search for lysosomal storage diseases? Mol Genet Metab Reports. 2017;11:8–11. doi:10.1016/j.ymgmr.2017.03.004.
- Hoffmann B, Schwarz M, Mehta A, Keshav S. Gastrointestinal symptoms in 342 patients with Fabry disease: prevalence and response to enzyme replacement therapy. Clin Gastroenterol Hepatol. 2007;5(12):1447–1453. doi:10.1016/j.cgh.2007.08.012.
- Lenders M, Brand E. Fabry disease - a multisystemic disease with gastrointestinal manifestations. Gut Microbes. 2022;14(1): 2027852. doi:10.1080/19490976.2022.2027852.
- Spiller R, Major G. IBS and IBD — separate entities or on a spectrum? Nat Rev Gastroenterol Hepatol. 2016;13(10):613–621. Available from. doi:10.1038/nrgastro.2016.141.
- Caputo F, Lungaro L, Galdi A, Zoli E, Giancola F, Caio G, De Giorgio R, Zoli G. Gastrointestinal involvement in Anderson-Fabry disease: a narrative review. Int J Environ Res Public Health. 2021;18(6):3320. MDPI AG. doi:10.3390/ijerph18063320.
- Michaud M, Mauhin W, Belmatoug N, Garnotel R, Bedreddine N, Catros F, Ancellin S, Lidove O, Gaches F. When and how to diagnose Fabry disease in clinical pratice. Am J Med Sci. 2020;360(6):641–649. Available from. https://pubmed.ncbi.nlm.nih.gov/32723516/.
- Ortiz A, Germain DP, Desnick RJ, Politei J, Mauer M, Burlina A, Eng C, Hopkin RJ, Laney D, Linhart A, et al. Fabry disease revisited: management and treatment recommendations for adult patients. Mol Genet Metab. 2018;123(4):416–427. Academic Press Inc. doi:10.1016/j.ymgme.2018.02.014.
- Wilcox WR, Feldt-Rasmussen U, Martins AM, Ortiz A, Lemay RM, Jovanovic A, Germain DP, Varas C, Nicholls K, Weidemann F, et al. Improvement of Fabry disease-related gastrointestinal symptoms in a significant proportion of female patients treated with agalsidase beta: data from the Fabry registry. JIMD Rep. 2018;38:45–51. doi:10.1007/8904_2017_28.
- Ohshima T, Murray GJ, Swaim WD, Longenecker G, Quirk JM, Cardarelli CO, Sugimoto Y, Pastan I, Gottesman MM, Brady RO, et al. α-galactosidase a deficient mice: a model of Fabry disease. Proc Natl Acad Sci U S A. 1997;94(6):2540–2544. doi:10.1073/pnas.94.6.2540.
- Lakoma J, Rimondini R, Donadio V, Liguori R, Caprini M. Pain related channels are differentially expressed in neuronal and non-neuronal cells of glabrous skin of Fabry knockout male mice. PloS One. 2014;9(10):e108641. doi:10.1371/journal.pone.0108641.
- Lakomá J, Rimondini R, Montiel AF, Donadio V, Liguori R, Caprini M. Increased expression of trpv1 in peripheral terminals mediates thermal nociception in Fabry disease mouse model. Mol Pain. 2016;12:1–16. doi:10.1177/1744806916663729.
- Üçeyler N, Biko L, Hose D, Hofmann L, Sommer C. Comprehensive and differential long-term characterization of the alpha-galactosidase a deficient mouse model of Fabry disease focusing on the sensory system and pain development. Mol Pain. 2016;12:12. doi:10.1177/1744806916646379.
- Namer B, Ørstavik K, Schmidt R, Mair N, Kleggetveit IP, Zeidler M, Martha T, Jorum E, Schmelz M, Kalpachidou T, et al. Changes in ionic conductance signature of nociceptive neurons underlying Fabry disease phenotype. Front Neurol. 2017;8:335. http://fabry-database.org.
- Masotti M, Delprete C, Dothel G, Donadio V, Rimondini R, Politei JM, Liguori R, Caprini M. Altered globotriaosylceramide accumulation and mucosal neuronal fiber density in the colon of the Fabry disease mouse model. Neurogastroenterol Motil. 2019;31(3):31. doi:10.1111/nmo.13529.
- Aguilera-Correa JJ, Madrazo-Clemente P, Martínez-Cuesta MC, Peláez C, Ortiz A, Dolores Sánchez-Niño M, Esteban J, Requena T. Lyso-Gb3 modulates the gut microbiota and decreases butyrate production. Sci Rep. 2019;9(1). Nature Publishing Group. doi:10.1038/s41598-019-48426-4.
- Turroni S, Brigidi P, Cavalli A, Candela M. Microbiota–host transgenomic metabolism, bioactive molecules from the inside. J Med Chem. 2018;61(1):47–61. American Chemical Society. doi:10.1021/acs.jmedchem.7b00244.
- Fernandez-Prado R, Esteras R, Perez-Gomez MV, Gracia-Iguacel C, Gonzalez-Parra E, Sanz AB, Ortiz A, Sanchez-Niño M. Nutrients turned into toxins: microbiota modulation of nutrient properties in chronic kidney disease. Nutrients. 2017;9(5):489. MDPI AG. doi:10.3390/nu9050489.
- Foster JA. Modulating brain function with microbiota. Sci. 2022;376(6596):936–937. https://pubmed.ncbi.nlm.nih.gov/35617384/.
- Castillo-Rodriguez E, Fernandez-Prado R, Esteras R, Perez-Gomez MV, Gracia-Iguacel C, Fernandez-Fernandez B, Kanbay M, Tejedor A, Lazaro A, Ruiz-Ortega M, et al. Impact of altered intestinal microbiota on chronic kidney disease progression. Toxins (Basel). 2018;10(7):300. doi:10.3390/toxins10070300.
- Black CJ, Drossman DA, Talley NJ, Ruddy J, Ford AC. Functional gastrointestinal disorders: advances in understanding and management. Lancet. 2020;396(10263):1664–1674. Elsevier. doi:10.1016/S0140-6736(20)32115-2.
- Moloney RD, Johnson AC, O’Mahony SM, Dinan TG, Greenwood-Van Meerveld B, Cryan JF. Stress and the microbiota-gut-brain axis in visceral PaRelevance to irritable bowel syndrome. CNS Neurosci Ther. 2016;22(2):102–117. Blackwell Publishing Ltd. doi:10.1111/cns.12490.
- Lucarini E, Di Pilato V, Parisio C, Micheli L, Toti A, Pacini A, Bartolucci G, Baldi S, Niccolai E, Amedei A, et al. Visceral sensitivity modulation by faecal microbiota transplantation: the active role of gut bacteria in pain persistence. Pain. 2022;163(5):861–877. United States. doi:10.1097/j.pain.0000000000002438.
- Pihlstrøm HK, Weedon-Fekjær MS, Bjerkely BL, von der Lippe C, Ørstavik K, Mathisen P, Heimdal K, Jenssen TG, Dahle DO, Solberg OK, et al. Health‐related quality of life in Norwegian adults with Fabry disease: disease severity, pain, fatigue and psychological distress. JIMD Rep. 2021;62(1):56. Wiley-Blackwell. doi:10.1002/jmd2.12240.
- Collins SM, Surette M, Bercik P. The interplay between the intestinal microbiota and the brain. Nat Rev Microbiol. 2012;10(11):735–742. doi:10.1038/nrmicro2876.
- De Palma G, Collins SM, Bercik P, Verdu EF. The microbiota-gut-brain axis in gastrointestinal disorders: stressed bugs, stressed brain or both? J Physiol. 2014;592(14):2989–2997. Available from. https://pubmed.ncbi.nlm.nih.gov/24756641/.
- Cryan JF, O’Riordan KJ, Cowan CS, Sandhu KV, Bastiaanssen TF, Boehme M, Codagnone MG, Cussotto S, Fulling C, Golubeva AV, et al. The microbiota-gut-brain axis. Physiol Rev. 2019;99(4):1877–2013. doi:10.1152/physrev.00018.2018.
- Fontaine DA, Davis DB. Attention to background strain is essential for metabolic research: C57BL/6 and the international knockout mouse consortium. American Diabetes Association Inc. 2016;65(1):25–33. doi:10.2337/db15-0982.
- Biegstraaten M, Binder A, Maag R, Hollak CEM, Baron R, Van Schaik IN. The relation between small nerve fibre function, age, disease severity and pain in Fabry disease. Eur J Pain. 2011;15(8):822–829. doi:10.1016/j.ejpain.2011.01.014.
- Shan Li Z, Schmauss C, Cuenca A, Ratcliffe E, Gershon MD. Physiological modulation of intestinal motility by enteric dopaminergic neurons and the D 2 receptor: analysis of dopamine receptor expression, location, development, and function in wild-type and knock-out mice. J Neurosci. 2006;26(10): 2798–807. doi:10.1523/JNEUROSCI.4720-05.
- Koester ST, Li N, Lachance DM, Dey N. Marker-based assays for studying gut transit in gnotobiotic and conventional mouse models. STAR Protocols. 2021;2(4):100938. United States. doi:10.1016/j.xpro.2021.100938.
- Lucarini E, Parisio C, Branca JJV, Segnani C, Ippolito C, Pellegrini C, Antonioli L, Fornai M, Micheli L, Pacini A, et al. Deepening the mechanisms of visceral pain persistence: an evaluation of the gut-spinal cord relationship. Cells. 2020;9(8):1772. doi:10.3390/cells9081772.
- Eeckhout E, Wullaert A. Extraction of DNA from murine fecal pellets for downstream phylogenetic microbiota analysis by next-generation sequencing. Bio-protocol. 2018;8(3). doi:10.21769/BioProtoc.2707.
- Fiori J, Turroni S, Candela M, Brigidi P, Gotti R. Simultaneous HS-SPME GC-MS determination of short chain fatty acids, trimethylamine and trimethylamine N-oxide for gut microbiota metabolic profile. Talanta. 2018;189:573–578. https://www.sciencedirect.com/science/article/pii/S0039914018307586.
- Masella AP, Bartram AK, Truszkowski JM, Brown DG, Neufeld JD. Pandaseq: paired-end assembler for illumina sequences. BMC Bioinform. 2012;13(1):1–7. doi:10.1186/1471-2105-13-31.
- Bolyen E, Rideout JR, Dillon MR, Bokulich NA, Abnet CC, Al-Ghalith GA, Alexander H, Alm EJ, Arumugam M, Asnicar F, et al. Reproducible, interactive, scalable and extensible microbiome data science using QIIME 2. Nat Biotechnol. 2019;37(8):852–857. doi:10.1038/s41587-019-0209-9.
- Callahan BJ, McMurdie PJ, Rosen MJ, Han AW, Johnson AJA, Holmes SP. DADA2: high-resolution sample inference from Illumina amplicon data. Nat Methods. 2016;13:581–583. Nature Publishing Group. https://www.nature.com/articles/nmeth.3869.
- Douglas GM, Maffei VJ, Zaneveld JR, Yurgel SN, Brown JR, Taylor CM, Huttenhower C, Langille MGI. PICRUSt2 for prediction of metagenome functions. Nat Biotechnol. 2020;3838(6):685–688. Nature Publishing Group. https://www.nature.com/articles/s41587-020-0548-6.
- Valles-Colomer M, Falony G, Darzi Y, Tigchelaar EF, Wang J, Tito RY, Schiweck C, Kurilshikov A, Joossens M, Wijmenga C, et al. The neuroactive potential of the human gut microbiota in quality of life and depression. Nature Microbiology. 2019;4(4):623–632. Nature Publishing Group. doi:10.1038/s41564-018-0337-x.
- Lynch CMK, Cowan CSM, Bastiaanssen TFS, Moloney GM, Theune N, van de Wouw M, Florensa Zanuy E, Ventura-Silva AP, Codagnone MG, Villalobos-Manríquez F, et al. Critical windows of early-life microbiota disruption on behaviour, neuroimmune function, and neurodevelopment. Brain Behav Immun. 2023;108:309–327. Academic Press. doi:10.1016/j.bbi.2022.12.008.
- Lubbe S, Filzmoser P, Templ M. Comparison of zero replacement strategies for compositional data with large numbers of zeros. Chemom Intell Lab Syst. 2021;210:104248. Elsevier. doi:10.1016/j.chemolab.2021.104248.
- Aitchison J, Barceló-Vidal C, Martín-Fernández JA, Pawlowsky-Glahn V. Logratio analysis and compositional distance. Math Geol. 2000;32(3):271–275. Springer. doi:10.1023/A:1007529726302.
- Benjamini Y, Hochberg Y. Controlling the false discovery rate: a practical and powerful approach to multiple testing. J R Stat Soc Ser B. 1995;57(1):289–300. John Wiley & Sons, Ltd. https://onlinelibrary.wiley.com/doi/full/10.1111/j.2517-6161.1995.tb02031.x.
- Lin H, Guo Q, Wen Z, Tan S, Chen J, Lin L, Chen P, He J, Wen J, Chen Y, et al. The multiple effects of fecal microbiota transplantation on diarrhea-predominant irritable bowel syndrome (IBS-D) patients with anxiety and depression behaviors. Microb Cell Fact. 2021;20(1):233. England. doi:10.1186/s12934-021-01720-1.
- Marrie RA, Graff LA, Fisk JD, Patten SB, Bernstein CN. The relationship between symptoms of depression and anxiety and disease activity in IBD over time. Inflamm Bowel Dis. 2021;27(8):1285–1293. England. doi:10.1093/ibd/izaa349.
- Laney DA, Gruskin DJ, Fernhoff PM, Cubells JF, Ousley OY, Hipp H, Mehta AJ. Social-adaptive and psychological functioning of patients affected by Fabry disease. J Inherit Metab Dis. 2010;33(S3):S73–81. doi:10.1007/s10545-009-9025-6.
- Politei J, Thurberg BL, Wallace E, Warnock D, Serebrinsky G, Durand C, Schenone AB. Gastrointestinal involvement in Fabry disease: so important, yet often neglected. Clin Genet. 2016;89(1):5–9. doi:10.1111/cge.12673.
- Julio-Pieper M, Hyland NP, Bravo JA, Dinan TG, Cryan JF. A novel role for the metabotropic glutamate receptor-7: modulation of faecal water content and colonic electrolyte transport in the mouse. Br J Pharmacol. 2010;160(2):367–375. doi:10.1111/j.1476-5381.2010.00713.x.
- Camilleri M, Katzka DA. Irritable bowel syndrome: methods, mechanisms, and pathophysiology. Genetic epidemiology and pharmacogenetics in irritable bowel syndrome. Am J Physiol Gastrointest Liver Physiol. 2012;302(10):G1075–G1084. https://pubmed.ncbi.nlm.nih.gov/22403795/.
- Chey WY, Jin HO, Lee MH, Sun SW, Lee KY. Colonic motility abnormality in patients with irritable bowel syndrome exhibiting abdominal pain and diarrhea. Am J Gastroenterol. 2001;96(5):1499–1506. https://pubmed.ncbi.nlm.nih.gov/11374689/.
- O’Mahony SM, Marchesi JR, Scully P, Codling C, Ceolho AM, Quigley EMM, Cryan JF, Dinan TG. Early life stress alters behavior, immunity, and microbiota in rats: implications for irritable bowel syndrome and psychiatric illnesses. Biol Psychiatry. 2009;65(3):263–267. Elsevier. doi:10.1016/j.biopsych.2008.06.026.
- Cantarero-Prieto D, Moreno-Mencia P, Xu M. The effects of gastrointestinal disturbances on the onset of depression and anxiety. PloS One. 2022;17(1):17. doi:10.1371/journal.pone.0262712.
- Toussaint A, Hüsing P, Kohlmann S, Brähler E, Löwe B. Excessiveness in symptom-related thoughts, feelings, and behaviors: an investigation of somatic symptom disorders in the General population. Psychosom Med. 2021;83(2):164–170. NLM (Medline). doi:10.1097/PSY.0000000000000903.
- Ali N, Gillespie S, Laney D. Treatment of depression in adults with Fabry disease. JIMD Rep. 2018;38:13–21. https://pubmed.ncbi.nlm.nih.gov/28417336/.
- Körver S, Geurtsen GJ, Hollak CEM, Van Schaik IN, Longo MGF, Lima MR, Vedolin L, Dijkgraaf MGW, Langeveld M. Depressive symptoms in Fabry disease: the importance of coping, subjective health perception and pain. Orphanet J Rare Dis. 2020;15(1):1–9. BioMed Central Ltd. https://ojrd.biomedcentral.com/articles/10.1186/s13023-020-1307-y.
- Greenwood-Van Meerveld B, Johnson AC. Stress-induced chronic visceral pain of gastrointestinal origin. Front Syst Neurosci. 2017;11. doi:10.3389/fnsys.2017.00086.
- Camilleri M, Sellin JH, Barrett KE. Pathophysiology, evaluation, and management of chronic watery diarrhea. Gastroenterology. 2017;152(3):515–532.e2. W.B. Saunders. doi:10.1053/j.gastro.2016.10.014.
- Hofmann L, Karl F, Sommer C, Üçeyler N, Rubino T. Affective and cognitive behavior in the alpha-galactosidase a deficient mouse model of Fabry disease. PloS One. 2017;12(6):e0180601–. doi:10.1371/journal.pone.0180601.
- Figueiredo Cerqueira MM, Castro MML, Vieira AA, Kurosawa JAA, Amaral Junior FLD, Siqueira Mendes FCC, Sosthenes MCK. Comparative analysis between open field and elevated plus maze tests as a method for evaluating anxiety-like behavior in mice. Heliyon. 2023;9(4):e14522. doi:10.1016/j.heliyon.2023.e14522.
- Polistena B, Rigante D, Sicignano LL, Verrecchia E, Manna R, d’Angela D, Spandonaro F. Survey about the quality of life of Italian patients with Fabry disease. Diseases. 2021;9(4):72. MDPI AG. doi:10.3390/diseases9040072.
- Bisgaard TH, Allin KH, Elmahdi R, Jess T. The bidirectional risk of inflammatory bowel disease and anxiety or depression: a systematic review and meta-analysis. Gen Hosp Psychiatry. 2023;83:109–116. doi:10.1016/j.genhosppsych.2023.05.002.
- Masanetz RK, Winkler J, Winner B, Günther C, Süß P. The gut–immune–brain axis: an important route for neuropsychiatric morbidity in inflammatory bowel disease. Int J Mol Sci. 2022;23(19):11111. doi:10.3390/ijms231911111.
- Jiang H, Ling Z, Zhang Y, Mao H, Ma Z, Yin Y, Wang W, Tang W, Tan Z, Shi J, et al. Altered fecal microbiota composition in patients with major depressive disorder. Brain Behav Immun. 2015;48:186–194. Academic Press Inc. doi:10.1016/j.bbi.2015.03.016.
- Polansky O, Sekelova Z, Faldynova M, Sebkova A, Sisak F, Rychlik I, Dozois CM. Important metabolic pathways and biological processes expressed by chicken cecal microbiota. Appl Environ Microbiol. 2016;82(5):1569–1576. American Society for Microbiology. doi:10.1128/AEM.03473-15.
- Reichardt N, Duncan SH, Young P, Belenguer A, McWilliam Leitch C, Scott KP, Flint HJ, Louis P. Phylogenetic distribution of three pathways for propionate production within the human gut microbiota. ISME J. 2014;8(6):1323–1335. Nature Publishing Group. doi:10.1038/ismej.2014.14.
- Killingsworth J, Sawmiller D, Shytle RD. Propionate and Alzheimer’s disease. Front Aging Neurosci. 2021;12. Frontiers Media S.A. doi:10.3389/fnagi.2020.580001.
- Reigstad CS, Salmonson CE, Rainey JF, Szurszewski JH, Linden DR, Sonnenburg JL, Farrugia G, Kashyap PC. Gut microbes promote colonic serotonin production through an effect of short-chain fatty acids on enterochromaffin cells. FASEB J. 2015;29(4):1395–1403. doi:10.1096/fj.14-259598.
- Esquerre N, Basso L, Defaye M, Vicentini FA, Cluny N, Bihan D, Hirota SA, Schick A, Jijon HB, Lewis IA, et al. Colitis-induced microbial perturbation promotes postinflammatory visceral hypersensitivity. CMGH. 2020;10(2):225–244. Elsevier Inc. doi:10.1016/j.jcmgh.2020.04.003.
- Sun Q, Jia Q, Song L, Duan L. Alterations in fecal short-chain fatty acids in patients with irritable bowel syndrome: a systematic review and meta-analysis. Medicine (Baltimore). 2019;98(7):e14513. United States. doi:10.1097/MD.0000000000014513.
- Singh SB, Lin HC. Hydrogen sulfide in physiology and diseases of the digestive tract. Microorganisms. 2015;3(4):866–889. MDPI AG. doi:10.3390/microorganisms3040866.
- Bosi A, Banfi D, Bistoletti M, Giaroni C, Baj A. Tryptophan metabolites along the microbiota-gut-brain axis: an interkingdom communication System influencing the gut in Health and disease. Int J Tryptophan Res. 2020;13:117864692092898. SAGE Publications Ltd. doi:10.1177/1178646920928984.
- Yang X, Lou J, Shan W, Ding J, Jin Z, Hu Y, Du Q, Liao Q, Xie R, Xu J, et al. Pathophysiologic role of neurotransmitters in digestive diseases. Front Physiol. 2021;12:567650. doi:10.3389/fphys.2021.567650.
- Marazziti D. Understanding the role of serotonin in psychiatric diseases. F1000 Research. 2017;6:180. England. doi:10.12688/f1000research.10094.1.
- Tedeschi L, Carai MAM, Frison G, Favretto D, Colombo G, Ferrara SD, Gessa GL. Endogenous γ-hydroxybutyric acid is in the rat, mouse and human gastrointestinal tract. Life Sci. 2003;72(22):2481–2488. Elsevier Inc. doi:10.1016/S0024-3205(03)00143-7.
- Bermudez-Martin P, Becker JAJ, Caramello N, Fernandez SP, Costa-Campos R, Canaguier J, Barbosa S, Martinez-Gili L, Myridakis A, Dumas M-E, et al. The microbial metabolite p-cresol induces autistic-like behaviors in mice by remodeling the gut microbiota. Microbiome. 2021;9(1). BioMed Central Ltd. doi:10.1186/s40168-021-01103-z.
- Hoffmann B, Keshav S. Gastrointestinal symptoms in Fabry disease: everything is possible, including treatment. Acta Paediatr. 2007;96:84–86. doi:10.1111/j.1651-2227.2007.00216.x.
- Zhu X, Yin L, Theisen M, Zhuo J, Siddiqui S, Levy B, Presnyak V, Frassetto A, Milton J, Salerno T, et al. Systemic mRNA therapy for the treatment of Fabry disease: preclinical studies in wild-type mice, Fabry mouse model, and wild-type non-human primates. Am J Hum Genet. 2019;104(4):625–637. doi:10.1016/j.ajhg.2019.02.003.
- Lenders M, Boutin M, Auray-Blais C, Brand E. Effects of orally delivered alpha-galactosidase a on gastrointestinal symptoms in patients with Fabry disease. Gastroenterology. 2020;159(4):1602–1604. doi:10.1053/j.gastro.2020.06.007.
- Halmos EP, Power VA, Shepherd SJ, Gibson PR, Muir JG. A diet low in FODMAPs reduces symptoms of irritable bowel syndrome. Gastroenterology. 2014;146(1):67–75.e5. doi:10.1053/j.gastro.2013.09.046.
- Tuck CJ, Taylor KM, Gibson PR, Barrett JS, Muir JG. Increasing symptoms in irritable bowel symptoms with ingestion of galacto-oligosaccharides are mitigated by α-galactosidase treatment. Am J Gastroenterol. 2018;113(1):124–134. United States. doi:10.1038/ajg.2017.245.
- Gugelmo G, Vitturi N, Francini-Pesenti F, Fasan I, Lenzini L, Valentini R, Carraro G, Avogaro A, Spinella P. Gastrointestinal manifestations and low-FODMAP protocol in a cohort of Fabry disease adult patients. Nutrients. 2023;15(3):15. Switzerland. doi:10.3390/nu15030658.