
ABSTRACT
As with many diseases, tumor formation in colorectal cancer (CRC) is multifactorial and involves immune, environmental factors and various genetics that contribute to disease development. Accumulating evidence suggests that the gut microbiome is linked to the occurrence and development of CRC, and these microorganisms are important for immune maturation. However, a systematic perspective integrating microbial profiling, T cell receptor (TCR) and somatic mutations in humans with CRC is lacking. Here, we report distinct features of the expressed TCRβ repertoires in the peripheral blood of and CRC patients (n = 107) and healthy donors (n = 30). CRC patients have elevated numbers of large TCRβ clones and they have very low TCR diversity. The metagenomic sequencing data showed that the relative abundance of Fusobacterium nucleatum (F. nucleatum), Escherichia coli and Dasheen mosaic virus were elevated consistently in CRC patients (n = 97) compared to HC individuals (n = 30). The abundance of Faecalibacterium prausnitzii and Roseburia intestinalis was reduced in CRC (n = 97) compared to HC (n = 30). The correlation between somatic mutations of target genes (16 genes, n = 79) and TCR clonality and microbial biomarkers in CRC had been investigated. Importantly, we constructed a random forest classifier (contains 15 features) based on microbiome and TCR repertoires, which can be used as a clinical detection method to screen patients for CRC. We also analysis of F. nucleatum-specific TCR repertoire characteristics. Collectively, our large-cohort multi-omics data aimed to identify novel biomarkers to inform clinical decision-making in the detection and diagnosis of CRC, which is of possible etiological and diagnostic significance.
Introduction
CRC is among the top three most frequently diagnosed cancers worldwide and a leading cause of cancerCitation1–3 mortality.Citation4,Citation5 Unfortunately, the underlying mechanisms for the initiation and development of this global malignancy have not been yet fully elucidated. Considering almost 1.5 kg of microbiota inhabit the human gut, it is not surprising that certain viruses and/or bacteria might be related to human cancers.Citation6,Citation7 According to reports, the function of the microbial community is important in carcinogenesis, and a potential core set of microorganisms may be carcinogenic.Citation1 Recent studies suggest that microbiota contribute to both the pathogenesis and prognosis of CRCs.Citation8–13 A strategy capable of controllable leveraging of the gut microbiota in the treatment of CRC is therefore highly desirable.Citation8
The occurrence and development of CRC are directly correlated with an abnormal immunological microenvironment.Citation14 The T lymphocytes repertoire can be monitored using complementarity‐determining region 3 (CDR3) analyses, and previous studies have demonstrated T cell proliferation in the peripheral blood of patients with solid tumors.Citation15 CDR3 is a critical region of TCR on both chains, responsible for specifically recognizing and binding antigen peptides, and each T cell has its own unique CDR3 sequence.Citation14 The TCR repertoire in each individual is different, with different usages of TCR Vβ and Jβ genes. It has also been reported that the diversity indexes of TCR repertoire are correlated to the prognosis of certain diseases, including cancer and viral infection.Citation16,Citation17 Biased TCR repertoires were observed in the peripheral blood and in tumor-infiltrating lymphocytes of cancer patients.Citation18 Germ-free mice have many immune abnormalities, including an enlarged cecum, failure of secondary lymphoid development, impaired antibody response, decreased number of T and B cells, and defective cytokine production. Microorganisms in the gut can induce chemotactic factors (such as CXCL9 and CXCL10) to recruit T cells into the tumor.Citation1,Citation19 By contrast, short-chain fatty acids (SCFAs) produced by fermentative bacteria are known to suppress the growth of CRC and induce anticancer immune responses.Citation20,Citation21
In addition, genetic changes accumulate for many years during the development of CRC. Over the past decade, large‑scale sequencing studies have investigated the genetic basis of CRC. These studies uncovered key pathways involved in the pathogenesis of CRC, including RAS, WNT, TGF‑β, TP53, PI3K and DNA mismatch repair pathways.Citation22–25 Identification of somatic mutations is key to understanding the molecular mechanisms of CRC and the development of novel therapeutics.Citation26 However, only a small subset of patients has long-term benefit from these target therapies, which raises the question whether tumor immune microenvironment, such as tumor-infiltrating lymphocytes, and derived T cell receptor (TCR) repertoire are responsible for the differences.Citation27 Therefore, it is necessary to identify novel targets.
A growing body of evidence suggests a potential link between F. nucleatum and colorectal carcinogenesis. Fusobacterium is well known to drive the formation of a pro-tumoral microenvironment that is highly chemoresistant and immunosuppressive.Citation8,Citation28,Citation29 It was reported that F. nucleatum can activate the nuclear factor-κB pathway and drive myeloid cell infiltration in tumors, generating a pro-inflammatory environment conducive to colorectal neoplasia progression in ApcMin/+ mice (a common mouse model of CRC)Citation1,Citation30 And F. nucleatum has been shown to promote myeloid infiltration of intestinal tumors in ApcMin/t mice and is associated with increased expression of proinflammatory genes such as Scyb1 (IL8), COX-), Tnf (TNFa), IL6 and Mmp3 in mice and humans.Citation5,Citation31
However, a systematic perspective integrating TCR, microbial profiling and somatic mutations in humans with CRC is lacking. Here, we performed fecal metagenomics, high-throughput TCR sequencing, and target exome sequencing to assess microorganisms, TCR, and somatic mutations in samples from CRC patients and healthy controls (HCs). CRC patients and HC individuals had differential Vβ and Jβ gene usages of the CDR3 region, TCR diversities and HEC number. The gut microbiome in patients with CRC significantly differed from that in healthy individuals. We discovered the distinct features of the expressed TCRβ repertoires in the peripheral blood of F. nucleatum-positive and F. nucleatum-negative CRC patients. The correlation between somatic mutations of target genes and TCR clonality and microbial biomarkers in CRC was also investigated. Finally, we construct a microbiome and TCR-based random forest classifier to discriminate cases of CRC from HC. We discovered the distinct features of the expressed TCRβ repertoires in F. nucleatum (one of the 15 features of random forest classifier)-positive and F. nucleatum-negative CRC patients. This study aimed to identify novel biomarkers to inform clinical decision-making in the detection and diagnosis of CRC.
Results
CRC patients and HC individuals had differential Vβ and Jβ gene usages of the CDR3 region
We analyzed the expressed TCRβ repertoires in the peripheral blood samples of 30 healthy donors and 107 CRC patients through high‐throughput sequencing technology (). Each healthy donor or CRC patient had distinct features in the TCR diversity. Healthy donors had relatively high TCR diversities, as visualized by the evenly distributed TCR Vβ–Jβ gene usage combinations ( shows six representative repertoires); CRC patients had relatively low TCR diversities as visualized by the biased TCR Vβ–Jβ gene usage combinations ( shows six representative repertoires).
Figure 1. Vβ and Jβ gene usage, diversities of the expressed TCRβ repertoires in the peripheral blood of healthy donors and CRC patients. (a) V–J gene usage combinations for six representative repertoires of healthy donors. The x-axis and y-axis depict functional human TRBV and TRBJ alleles, respectively. The z‐axis is the count of TCRβ sequences with a given V–J combination (note the scale of z-axis varies according to changes in the maximum count). (b) V–J gene usage combinations for six representative repertoires of CRC patients. (c) Vβ gene usage comparison. The x-axis depicts all functional human TRBV alleles while the y‐axis is the percentage of TCRβ sequences in all repertoires of healthy donors or CRC patients using each TRBV allele. The asterisks indicate pP-values of the Mann–Whitney U test (*P < .05; **P < .01; ***P < .001). (d) Jβ gene usage comparison. The x-axis depicts functional human TRBJ alleles, *P< .05, **P < .01, ***P < .001, Mann–Whitney U test.
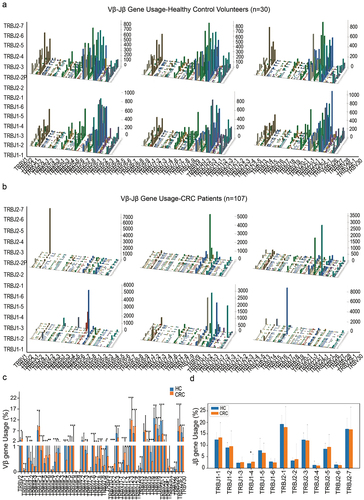
Table 1. 137 samples (TCR).
Among the 48 functional human Vβ genes, the usages of TRBV2, TRBV3–1, TRBV5–1, TRBV5–4, TRBV5–5, TRBV5–6, TRBV6–1, TRBV6–5, TRBV6–6, TRBV7–6, TRBV7–7, TRBV7–8, TRBV7–9, TRBV10–1, TRBV10–2, TRBV11–1, TRBV11–2, TRBV12–3, TRBV12–4, TRBV15 and TRBV29–1 in CRC patients were significantly higher than in healthy donors; The usages of TRBV4–1, TRBV4–2, TRBV6–4, TRBV7–3, TRBV9, TRBV10–3, TRBV11–3, TRBV13, TRBV16, TRBV18, TRBV19, TRBV20–1, TRBV24–1, TRBV28 and TRBV30 in healthy donors were significantly higher than in CRC patients (, P < .05, Mann–Whitney U test). For the functional Jβ genes, the usages of TRBJ1–4 in CRC patients was significantly higher than in healthy donors (, P < .05, Mann–Whitney U test).
Specific sequence characteristics of TCR repertoires in CRC patients and healthy donors
The expression level of each unique clone is another measurement of immune diversity. After aligning with the human genome reference, the expression level of each clone was calculated. In this study, TCR clones with a frequency above 0.5% of total reads in a sample were defined as high-expansion clone (HEC). The comparison of HEC number between the CRC and HC groups showed a significantly higher HEC ratio in the CRC group (). This indicates that the CDR3 sequence of CRC patients had significantly large clone fragments compared with HCs. The similarity of the two different samples was assessed using the TCR repertoire overlap, which was defined as the total number of sequencing reads from shared TCRβ sequences divided by the sum of sequencing reads, ranging from 0 to 1.Citation32,Citation33 The TCR repertoire overlaps in CRC were significantly higher than that in HC groups (), which indicates that CRC patients have relatively low TCR diversities compared with HCs. The length distributions of TCRβ CDR3 in healthy donors and CRC patients are similar, peaking at 12-amino acids (). But CDR3 aa lengths of 6, 18 and 22 were less in CRC patients than in the HC group.
Figure 2. Specific sequence characteristics of TCR repertoires in CRC patients and HC individuals. (a) Comparison of HEC number distribution between healthy controls and CRC patients, *P < .05, **P < .01, ***P < .001, Mann–Whitney U test. (b) The overlap of clonotypes within each group, CRC and HC, *P < .05, Mann–Whitney U test. (c) TCRβ CDR3 amino acid sequence length distribution comparison. The y‐axis is the percentage of TCRβ CDR3 clone types with the corresponding CDR3 length, *P < .05, **P < .01, ***P < .001, Mann–Whitney U test. (d) CRC-specific sequence diagram. The top 50 of CRC-specific CDR3 sequences were showed in the histogram, and in the table were the highest 10 CRC-specific CDR3 sequences. (e) Heat map of CDR3 sequences in all of the samples.
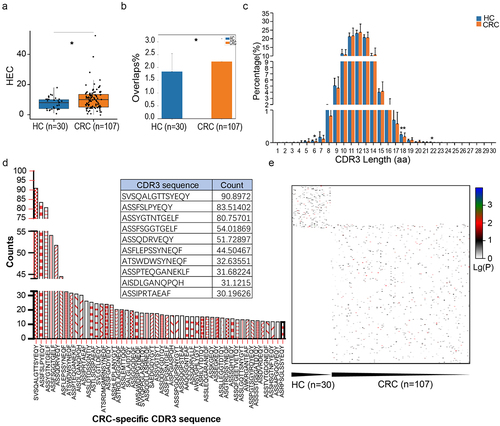
Subsequently, we eliminated the sequences that appeared in the HC group and ranked the remaining CRC-specific CDR3 sequences according to the frequency of occurrence (). The top 50 of CRC-specific CDR3 sequences are shown in the histogram, and in the table were the highest 10 CRC-specific CDR3 sequences. To further study the difference in CDR3 sequence in CRC and HCs, we took the lg value to create a total heat map. We found that most CRC and HC individuals had different CDR3 sequences, with only a few common sequences ().
The gut microbiome in patients with CRC significantly differed from that in HC individuals
Gut microbes can regulate key aspects of host immunity. Analysis of TCR sequencing may suggest prominent changes in the gut environment in CRC patients, we therefore examined their gut microbiome characteristics. We collected feces from 97 CRC patients and 30 HC individuals and detected the microorganisms through metagenomics technology ().
Table 2. One hundred and twenty-nine samples (metagenome).
The stackedbar showed the top ten relative abundance of species in CRC patients and HC individuals (). The Shannon diversity index of the CRC group was significantly higher than that of the control group (P = .005542, Wilcoxon rank-sum test, ). Nonmetric Multidimensional Scaling (nMDS) was used to compare beta distance between CRC patients and HCs. The results showed significant differences between the CRC and HC groups in both the nMDS1 dimension and the nMDS2 dimension (). High-dimensional comparison from LEfSe further indicated an overrepresentation of F. nucleatum, E. coli, Bacteroides thetaiotaomicron, Porphyromonas, Odoribacter splanchnicus, Prevotella, Vicia cryptic virus (VCV), and Dasheen mosaic virus (DsMV) in patients with CRC, while Lachnospiraceae, F. prausnitzii, and R. intestinalis were significantly more abundant in HC individuals ().
Figure 3. Profiles of the gut microbiota in HC individuals and CRC patients. (a) The top nine species with relative abundant expression in each sample. (b) The Shannon diversity index of the CRC group was significantly higher than that of the control group, P = .005542, Wilcoxon rank-sum test. (c) NMDS showed that the overall fecal microbiota composition was different between CRC patients and HC controls. (d) The species abundance analysis of the microbial community, classification evolution map shows the information of all of the branches in the syngenetic group (species abundance is greater than or equal to 0.5%). The size of the circle represents the proportion of species abundance, and the color is the relative enrichment of the most abundant taxa. (e) The lefse chart shows significantly different species with an LDA score greater than the pre-set value; the default score was 2.0. The length of the histogram represents the LDA score (the degree of influence of significantly different species between different groups). (f, g) The significantly differentially expressed genes between the CRC patients and healthy control subjects were annotated according to KEGG (f) and GO classifications (g). (h) The top 30 enriched GO terms were grouped by differentially expressed genes using pathway enrichment analysis with the GO database and functional groups, respectively. Low FDR-p values are shown in red, and high FDR-p values are shown in green; the size of the circle is proportional to the number of enriched genes. KEGG, Kyoto Encyclopedia of Genes and Genomes; GO, Gene Ontology.
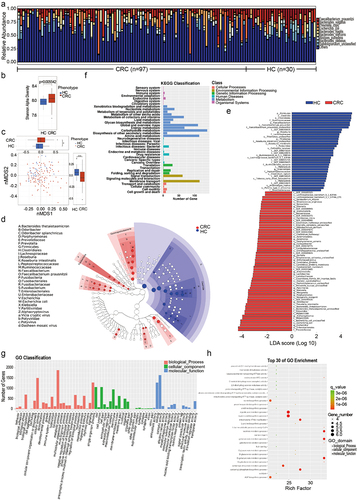
The EggNOG database (evolutionary genealogy of genes: Non-supervised Orthologous Groups http://eggnog.embl.de/)Citation34 is an internationally recognized professional annotated database of homologous clustering gene groups, including the original COG/KOG functional classification and the function annotation based on taxonomy. At present, the database (v4.5.1) contains 190,000 orthologous taxa covering 2,031 species. The most abundant KEGG orthologues were enrichment in the pathways including carbohydrate metabolism, amino acid metabolism, the global and overview maps, membrane transport and signal transduction (). According to eggNOG/COG [evolutionary genealogy of genes: non-supervised orthologous groups/cluster of orthologous groups (NOG/COG)] annotations, the most abundant NOG and enriched GO term was also a metabolic process. According to the GO annotations, the most abundant NOGs were metabolic process, cellular process, and single organism in the biological process category; cell, cell part, and membrane in the cellular component category; and catalytic activity and binding in the molecular function category (). Among the top 30 enriched GO terms, the main enriched GO terms were related to biological processes (e.g., isocitrate metabolic process, galacturonate metabolic process, d-galacturonate metabolic process and l-lysine catabolic process to acetyl-CoA) and molecular functions (e.g., excinuclease ABC activity, galacturonate catabolic process, and d-galacturonate catabolic process) ().
CRC-implicated somatic mutations are related to TCR and the gut microbiome
To explore whether genetic changes mediate the tremendous changes in microbes and immunity of CRC patients, and generate a coherent signal for colorectal carcinogenesis, we performed whole-exome sequencing of 16 genes in the cancer tissues and para-cancerous tissues of 79 CRC patients (). Mutation information of each gene in each sample is shown in a waterfall plot, where various colors with annotations at the bottom represent different mutation types (). In our cohort, the proportion of somatic mutations in the 16 target genes in descending order was APC, KRAS, PIK3CA, GPT2, MSH2, MLH1, TP53, CTNNB1, AKT1, MMP2, NRAS, CD274, STK11, CTLA4, PARK7, and SNCA. In summary, these mutations were further classified according to different categories, in which missense mutations account for the greatest fraction (), single nucleotide polymorphisms occurred more frequently than insertions or deletions (), and C > T was the most common single nucleotide variant (SNV) in CRC (). Further, we counted the number of altered bases in each sample and illustrated mutation types using different colors in a box plot (). The top ten mutated genes in CRC with ranked percentages included APC (52%), PIK3CA (28%), MLH1 (20%), CTNNB1 (18%), KRAS (32%), GPT2 (21%), AKT1 (14%), TP53 (20%), MMP2 (14%), and MSH2 (21%) ().
Figure 4. CRC-implicated somatic mutations are related to TCR and the gut microbiome. (a) Landscape of mutation profiles of CRC samples. Mutation information of each gene in each sample is shown in the waterfall plot, in which various colors with annotations at the bottom represent the different mutation types. The bar plot above the legend exhibits the mutation burden. (b) Summary of the mutation information with statistical calculations. Classification of mutation types according to different categories, in which missense mutation accounts for the most fraction, SNP showed more frequency than insertion or deletion, and C>T was the most common of SNV; tumor mutation burden in specific samples; the top ten mutated genes in CRC; the distribution ratio of SNV/InDel sites of different functional types; InDel insertion/deletion length distribution of all samples; the abscissa represents the length of inserted (>0) and deletion (<0) fragments, and the ordinate represents the corresponding InDel ratio. (c) The correlation between the 16 target genes and differential microorganisms. (d) The correlation between the 16 target genes and TCR CDR3 sequence.
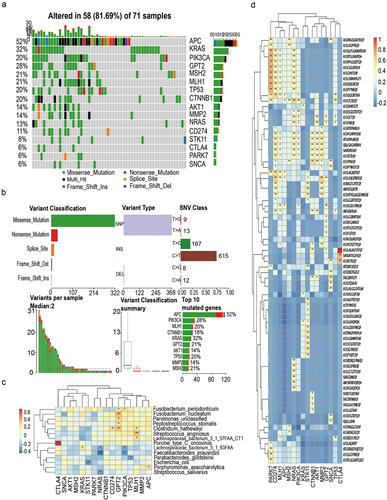
Table 3. Seventy-nine samples (somatic mutations of target genes).
To investigate whether and how the target genes integrate TCR and the microbiome, we first studied the KEGG pathway analysis of these 16 genes. KEGG pathway analysis of the 16 genes showed that AKT1, KRAS, NRAS, PIK3CA, and CTLA4 were enriched in the T cell receptor signaling pathway (Figure S1A). PPI diagram found that most of the proteins were closely related to each other, but GPT2 was only related to PIK3CA and PIK3CA was related to AKT1, KRAS, and STK11 (Figure S1B). In addition, we found that F. nucleatum had a significant positive correlation with GPT2 (P = 0.004), while F. prausntzii had a significant negative correlation with PIK3CA (P = .0119) (). GPT2 was significantly correlated with ASSIGGSSYNEQF (COR = .45, P = .0011), ASSGETQY (COR = .35, P = .014), and ASSFNEQF (COR = .35, P = .014). PIK3CA also had a significant correlation with ASSIGGSSYNEQF (COR = .45, P = .0011), ASSGETQY (COR = .35, P = .014), and ASSFNEQF (COR = .45, P = .0011) (). Finally, we revealed the structure of collagen GPT2, PIK3CA. The pointer in the structure diagram indicates the mutations (Figure S1C, S1D).
Establishment of a predictive classifier for discriminating cases of CRC patients from HC individuals based on gut microbiome profiles and TCR repertoires
As the most direct, rapid and effective diagnostic method, the screening and acquisition of biomarkers can play an important role in disease prevention, early diagnosis, individualized treatment and prognostic evaluation. By merging the microbiota and TCR information tables, a total of 103 samples (73 CRC patients and 30 health individuals) were found to contain both TCR data and microbial data. Then, we used the Wilcoxon rank-sum test to analyze the difference between TCR data and species data (species level), with a P < 0.05 as the threshold. We used algorithms to select appropriate markers from different species and TCR data for modeling. When doing feature selection, we sorted according to the importance of the features and finally selected the number of features with the highest model accuracy for the final modeling. We used the Random Forest (RF) algorithm to rank the importance of features. By modeling different numbers of features, we found that the model worked best when the following 15 features were selected: ‘ASSPSRQGTAEAF’, ‘ATSDLAGDTDTQY’, ‘F. prausnitzii’, ‘RPQGVPHSYNEQF’, ‘SAKRREWQGRRGYT’, ‘AWSPISGFENIQY’, ‘ASSQERLTGVSPLH’, ‘SVVVMLNYNEQF’, ‘R._intestinalis’, ‘ASSQESTGNQPQH’, ‘DsMV’, ‘ASSHPREREDNYEQF’, ‘ASSSGHYEQY’, ‘SARGLAGNEQF’, and ‘F. nucleatum’. The feature importance ranking coefficient values of the above 15 indicators are shown in .
Figure 5. A predictive classifier for discriminating cases of CRC patients from HC individuals. (a) 15 features of random forest classifier based on microbiome and TCR repertoires. The feature importance ranking coefficient values of the 15 indicators are shown in . (b-c) ROC curve constructed by the random forest algorithm. The effect of the final model can be evaluated based on the AUC. (d) The AUC of the trained random forest model on the verification cohort is 0.90. (e, f) The biomarkers were good at diagnosing early CRC from healthy individuals, and the training and testing AUC are 98.99% and 97.5%, respectively. (g, h) The biomarkers were also good at diagnosing late CRC from healthy individuals, and the training and testing AUC are 99.22% and 97.92%, respectively. (i, j) The biomarkers performed slightly poorly at distinguishing different stages of CRC, and the training and testing AUC are 87.5% and 83.33%, respectively.
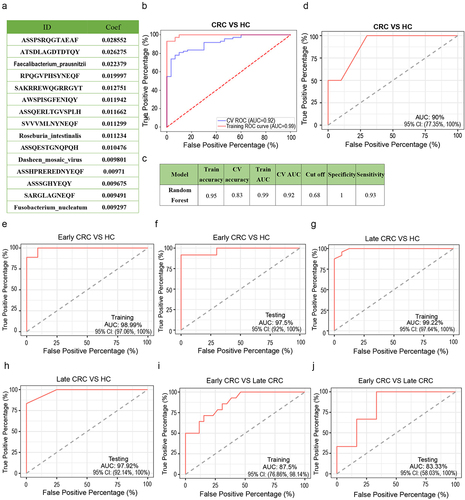
Because the number of samples was relatively small, we directly optimized the parameters of the training model and tested the effect of the model through tenfold cross-validation to improve the accuracy of the model. We chose the RF model receiver operating characteristic (ROC) curve constructed by the random forest algorithm as shown in . The effect of the final model can be evaluated based on the area under the curve (AUC). Our CV AUC was 0.92, train AUC was 0.99 and train accuracy was 0.95 (). The higher the accuracy or AUC, the better the effect. In order to perform external verification, we collected a new independent validation cohort with 46 samples, including 26 patients with CRC and 20 health controls (). The AUC of the trained random forest model on the verification cohort is 0.90 ().
Table 4. Forty-six samples (metagenome,TCR).
According to the TNM stage of CRC patients, Stage I and stage II are considered to be the early CRC, and stage III and stage IV are considered to be the late CRC.Citation35,Citation36 The biomarkers were good at diagnosing early CRC from healthy individuals. The training and testing AUC are 98.99% and 97.5%, respectively (). The biomarkers were also good at diagnosing late CRC from healthy individuals. The training and testing AUC are 99.22% and 97.92%, respectively (). But the biomarkers performed slightly poorly at distinguishing different stages of CRC. The training and testing AUC are 87.5% and 83.33%, respectively (). Then, we examine the effects of classifiers with fewer makers to verify the effects of current classifiers. When using RF model with ten markers (“ASSPSRQGTAEAF”, “ATSDLAGDTDTQY”, “F. prausnitzii”, “RPQGVPHSYNEQF, “SAKRREWQGRRGYT”, “AWSPISGFENIQY”, “ASSQERLTGVSPLH”, “SVVVMLNYNEQF”, “R. intestinalis”, “ASSQESTGNQPQH”), the training and testing AUC are 92.91% and 87.84%, respectively (Figure S2A, 2B). When using RF model with five markers (“ASSPSRQGTAEAF”, “ATSDLAGDTDTQY”, “F. prausnitzii”, “RPQGVPHSYNEQF, “SAKRREWQGRRGYT”), the training and testing AUC are 91.34% and 75.78%, respectively (Figure S2C, 2D). When using RF model with only 11 TCR markers (“ASSPSRQGTAEAF”, “ATSDLAGDTDTQY”, “RPQGVPHSYNEQF”, “SAKRREWQGRRGYT”, “AWSPISGFENIQY”, “ASSQERLTGVSPLH”, “SVVVMLNYNEQF”, “ASSQESTGNQPQH”, “ASSHPREREDNYEQF”, “ASSSGHYEQY”, “SARGLAGNEQF”), the training and testing AUC are 91.19% and 90.87%, respectively (Figure S2E, S2F). So, the effect may be slightly reduced when using fewer markers or only TCR markers.
Distinct features of the expressed TCRβ repertoires in the peripheral blood of F. nucleatum-positive and F. nucleatum-negative CRC patients
In our study, high-dimensional comparison from LEfSe indicated an overrepresentation of F. nucleatum in CRC patients (). We also found that F. nucleatum had a significant positive correlation with GPT2 (P = 0.004) (). In addition, F. nucleatum is 1 of the 15 features of random forest classifier based on microbiome and TCR repertoires (). We detected F. nucleatum expression in the intestinal tumor tissues of CRC patients who had undergone TCR sequencing via qPCR. To determine the F. nucleatum-specific TCR repertoire characteristics, we compared the expression levels of TRBV and TRBJ genes of F. nucleatum-positive CRC patients (n = 22) and F. nucleatum-negative CRC patients (n = 85). The usages of TRBV7–3 which higher in HC than in CRC groups was significantly higher in F. nucleatum-negative CRC patients than in F. nucleatum-positive CRC patients; The usages of TRBV14 in F. nucleatum-positive CRC patients was significantly higher than in F. nucleatum-negative CRC patients (, P < .05, Mann–Whitney U test). For the functional Jβ genes, the usages of TRBJ1–4 and TRBJ2–2 in F. nucleatum-positive CRC patients were significantly higher than in F. nucleatum-negative CRC patients (, P < .05, Mann–Whitney U test). TRBJ1–4 expression was consistently increased in both CRC patients and F. nucleatum-positive patients. The length distributions of TCRβ CDR3 in F. nucleatum-negative and F. nucleatum-positive CRC patients were similar, peaking at 12-amino acids (). However, lengths of 17-amino acids was increased and 18-amino acids was decreased in F. nucleatum-positive than in F. nucleatum-negative CRC patients. And 18-amino acids was decreased in F. nucleatum-positive CRC patients as well as CRC patients.
Figure 6. Distinct features of the expressed TCRβ repertoires in the peripheral blood of F. nucleatum-positive and F. nucleatum-negative CRC patients. (a) Vβ gene usage comparison. The x-axis depicts functional human TRBV alleles, *P < .05, **P < .01, ***P < .001, Mann–Whitney U test. (b) Jβ gene usage comparison. The x-axis depicts functional human TRBJ alleles, *P < .05, **P < .01, ***P < .001, Mann–Whitney U test. (c) TCRβ CDR3 amino acid sequence length distribution comparison. The y‐axis is the percentage of TCRβ CDR3 clone types with the corresponding CDR3 length, *P < .05, Mann–Whitney U test. (d) Comparison of maximum CDR3 clone ratio distribution between healthy controls, F. nucleatum-positive and F. nucleatum-negative CRC patients, *P < .05, nonparametric one-way ANOVA. (e) Comparison of HEC number distribution between healthy controls, F. nucleatum-positive and F. nucleatum-negative CRC patients, **P < .05, nonparametric one-way ANOVA. (f) Heat map of CDR3 sequences in all of the samples.
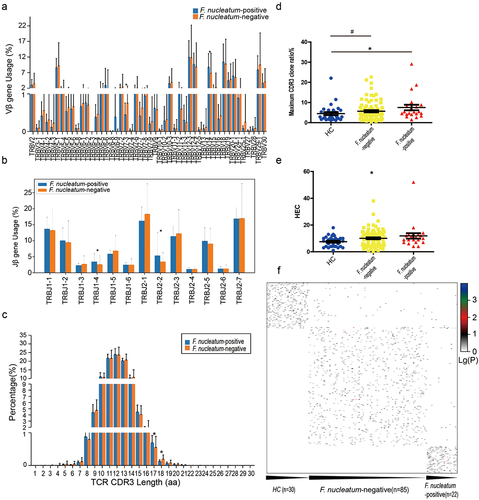
The comparison of the maximum CDR3 clone ratio between the F. nucleatum-positive CRC patients and HC individuals showed significant differences (, P = .0482, nonparametric one-way ANOVA). The comparison of HEC number among the F. nucleatum-positive CRC patients, F. nucleatum-negative CRC patients and HC individuals showed significant differences (, P = .0464, nonparametric one-way ANOVA). These indicate that the CDR3 sequence of F. nucleatum-positive CRC patients exhibited a significantly increase in large clone fragments compared with F. nucleatum-negative CRC patients. And this feature was consistent with the difference between CRC and HC. The heat map showed that most HC individuals, the F. nucleatum-positive CRC patients and F. nucleatum-negative CRC patients had different CDR3 sequences, with only a few common sequences ().
Discussion and conclusion
Our large-cohort multi-omics data indicate that shifts in TCR clonality, microbiome, and genetics occur during the development of colorectal cancer. We verified the correlation between the microbiome, TCR, and target genes, and successfully identified several microbial and TCR biomarkers of CRC patients and HC individuals. To the best of our knowledge, this is the first study to report a microbiome and TCR-based random forest classifier for discriminating cases of CRC patients from the HC individuals. Our research sheds light on the biomarkers of TCR, gut microbiome, and somatic mutations affect CRC, which could transform clinical practice.
There is increasing evidence that deep sequencing-based T cell repertoires can serve as a biomarker of immune response in cancer patients.Citation32 Novel techniques based on sequencing the TCR gene to assess lymphocytic infiltration provide clonality information in addition to abundance.Citation37 The comparison of HEC number between the CRC and HC groups showed a significantly higher HEC ratio in the CRC group. High clonality indicates that only a few abundant clones exist, whereas lower clonality indicates that multiple clones exist with similar abundance.Citation37 Our results indicate that the CDR3 sequence of CRC patients have high clonality and have poorer TCR diversity than HC individuals. Moreover, there were significant differences in the amino acid sequence, Vβ and Jβ genes, and CDR3 length between CRC patients and HC individuals. We identified metagenomic and TCR sequencing markers to discriminate cases of CRC patients from HC individuals. The TCR features we finally selected included ‘ASSPSRQGTAEAF,’ ‘ATSDLAGDTDTQY,’ ‘RPQGVPHSYNEQF,’ ‘SAKRREWQGRRGYT,’ ‘AWSPISGFENIQY,’ ‘ASSQERLTGVSPLH,’ ‘SVVVMLNYNEQF,’ ‘ASSQESTGNQPQH,’ ‘ASSHPREREDNYEQF,’ ‘ASSSGHYEQY,’ and ‘SARGLAGNEQF.’ In addition, several clonotypes were uniquely detected in CRC patients, and their CDR3 motifs differed from those observed in the HC individuals. These results reveal the alteration of the expressed TCRβ repertoire with CRC, and we hypothesize that the TCR diversity and clonality in the peripheral blood might be used to evaluate and compare the adaptive immunities among different individuals in clinical practice.
Our metagenomic sequencing data showed that F. nucleatum, E. coli, Prevotella and DsMV were elevated consistently in CRC patients compared to HC individuals, while the abundance of F. prausnitzii and R. intestinalis was reduced in CRC patients compared to HC individuals. Our findings are consistent with previous studies showing that the gut microbiota related to CRC had a higher species richness, lower abundance of potentially protective taxa (for example, Roseburia) and increased abundance of procarcinogenic taxa (such as Bacteroides, Escherichia, Fusobacterium, and Porphyromonas).Citation38 The major end products of glucose fermentation by F. prausnitzii strains include substantial quantities of butyrate.Citation39,Citation40 Interestingly, butyrate-producing bacteria were reported to be significantly enriched in responders to immunotherapy in melanoma patients.Citation10,Citation41,Citation42 Substantial consistency between the gut microbiome shifts and those reported previously suggests that the CRC patients recruited in our study are representative of the general CRC population.
Besides confirming known associations of F. nucleatum and Escherichia coli in CRC, we also found significant associations with several viruses. Our high-dimensional comparison from LEfSe further indicated an overrepresentation of VCV and DsMV in CRC patients. VCV belongs to the genus Amalgavirus, and it is reported that VCV infection is common in cowpea plants (First-vcv). DsMV is the most important viral pathogen of cultivated aroid plants worldwide. It is ubiquitous in commercial plantings of the tropical root crops, Colocasia and Xanthosoma spp. VCV belongs to the genus Amalgavirus, family Amalgaviridae.Citation43 Amalgaviruses are efficiently transmitted through seeds but not mechanically or by grafting.Citation44 WB results and RT-PCR results suggested that VCV-M infection is common in cowpea plants. DsMV is the most important viral pathogen in cultivated aroid plants worldwide.Citation45 Like other potyviruses, DsMV has flexuous, filamentous particles about 750 nm in length and contains a positive sense, single-stranded RNA of Mr 3.2–3.4_106.Citation45 Repeated use of virus-infected planting materials has increased the disease incidence in these edible aroids in recent years.Citation46 F. nucleatum, F. prausnitzii, R._intestinalis and DsMV are the four microorganisms features of random forest classifier based on microbiome and TCR repertoires.
Identification of somatic mutations is key to understanding the molecular mechanism of CRC and the development of novel therapeutics.Citation26 The Cancer Genome Atlas (TCGA) project studied more than 224 CRC cases and showed that 24 genes, including APC, TP53, SMAD4, PIK3CA, and KRAS, contained significant mutations.Citation27 In our cohort, we identified the top 10 mutated genes in CRC with ranked percentages, including APC (52%), PIK3CA (28%), MLH1 (20%), CTNNB1 (18%), KRAS (32%), GPT2 (21%), AKT1 (14%), TP53 (20%), MMP2 (14%), and MSH2 (21%). The PPI chart revealed that GPT2 and PIK3CA are related, and the literature shows that PIK3CA mutations and mitochondrial glutamic pyruvate transaminase (GPT2) can promote the occurrence and development of CRCCitation47. GPT2 had a significant positive correlation with F. nucleatum, and PIK3CA had a significant negative correlation with F. prausnitzii. PIK3CA participates in the TCR signaling pathway (). GPT2 catalyzes the reversible transamination between alanine and α-ketoglutarate (α-KG), also known as 2-oxoglutarate, to generate pyruvate and glutamate during cellular glutamine catabolism.Citation48 Proliferating tumor cells utilize glutamine’s carbon to maintain pools of TCA cycle intermediates.Citation49 Renal cell carcinomas are glutamine addicted.Citation50 The oncogenic function of PIK3CA mutations is dependent on glutamine metabolism in colorectal cancer cells.Citation47 Intracellular glutamate in cancer cells is primarily a product of glutamine metabolism, with a proportion of glutamate destined for secretion.Citation51,Citation52 We hypothesize that GPT2 and PIK3CA mutations may affect microbial and immune status in CRC.
Several studies have demonstrated that F. nucleatum is enriched in human CRC compared with adjacent normal tissue.Citation53,Citation54 Furthermore, evidence suggests that F. nucleatum tracks with tumor stage and recruitment of myeloid-derived suppressor cells into the tumor microenvironment.Citation31 F. nucleatum activates the β-catenin pathway by expressing FadAc on the bacterial surface, thereby regulating tumor cell growth.Citation28 It was also reported that F. nucleatum can upregulate expression of BIRC3 via the TLR4/NK-kB pathway,Citation55 and F. nucleatum inhibits apoptosis by downregulating miRNA18a via the TLR-4/MYD88 pathway and suppresses the cytotoxicity of natural killer cells via Fap2-TIGIT.Citation56 In our study, F. nucleatum is one of the 15 features of random forest classifier based on microbiome and TCR repertoires (). We detected F. nucleatum expression in the intestinal tumor tissues of CRC patients to determine the F. nucleatum-specific TCR repertoire characteristics. The usages of TRBV7–3 which higher in HC than in CRC groups were significantly higher in F. nucleatum-negative CRC patients than in F. nucleatum-positive CRC patients; The usages of TRBJ1–4 expression was consistently increased in both CRC patients and F. nucleatum-positive patients. The comparison of maximum CDR3 clone ratio and the HEC number among the F. nucleatum-positive CRC patients, F. nucleatum-negative CRC patients and HC individuals showed significant differences. This indicates that the CDR3 sequence of F. nucleatum-positive CRC patients exhibited a significant increase in large clone fragments compared with F. nucleatum-negative CRC patients.
In conclusion, by using a multi-omics approach, we have performed comprehensive research on microorganisms, TCR, and variants from CRC patients and HC individuals. Here, we report significant differences in HEC number, the amino acid sequence, TRBV/J gene and sequence length of TCR CDR3 between the CRC patients and the HC individuals. The gut microbiome in patients with CRC significantly differed from that in HC individuals. The correlation between somatic mutations of target genes and TCR clonality and microbial biomarkers in CRC was investigated. Finally, we constructed metagenomic and TCR sequencing diagnostic markers to discriminate between cases of CRC patients and HC individuals. The CDR3 sequence of F. nucleatum-positive CRC patients exhibited a significant increase in large clone fragments compared with F. nucleatum-negative CRC patients. The present study is the first to construct a microbiome and TCR-based random forest classifier for discriminating cases of CRC patients from HC individuals. With the robust discrimination and predictive power of the CRC-prediction random forest classifier, our results highlight the possibility of bridging microbiome and TCR research with therapeutic management.
Materials and methods
Study design and study participants
The study and all of the experimental procedures were approved by the Ethics Committee of the Shanghai Tenth Hospital according to the Council for International Organizations of Medical Sciences, and in accordance with the Declaration of Helsinki of 1975. Ethical approval was obtained from the Institutional Review Board of Shanghai Tenth Hospital (Shanghai, P.R. China, SHSY-IEC-4.1/20–203/01). The participants provided written informed consent to participate in the study.
In this study, we conducted three omics studies including fecal metagenomic analysis in CRC patients and HCs, high-throughput TCR sequencing of blood samples from CRC patients and HCs, and target exome sequencing of tumor tissues and adjacent tissues from CRC patients. We collected stool samples from 97 CRC patients and 30 healthy controls for metagenomics, and blood samples from 107 CRC patients and 30 healthy controls for TCR sequencing. We performed target exome sequencing on the tumor tissues and adjacent tissues of 79 CRC patients. In addition, 30 healthy controls who underwent metagenomics and TCR sequencing were the same volunteers, while 73 of CRC patients were the same volunteers. We also collected a new independent validation cohort with 46 samples, including 26 patients with CRC and 20 health controls to perform external verification.
CRC patients who provided stool or blood samples were excluded if they had exposure to antibiotics, prebiotics, probiotics, steroids, or immunosuppressants within 4 weeks prior to fecal sampling. In addition, 30 healthy individuals free of malignancy, as assessed by the investigators, were enrolled as controls. Our experiment was conducted in the pathology department, Tenth People's Hospital of Tongji University.
Fecal sampling and DNA extraction
Fecal samples were collected with reference to the method provided in the Manual of Procedures for Human Microbiome Project Protocol (#07–001). All specimens were stored at −80°C in the laboratory before subsequent processing. A frozen aliquot (200 mg) of each fecal sample was suspended in 250 µl of guanidine thiocyanate, 0.1 M Tris (pH 7.5) and 40 µl of 10% N-lauroyl sarcosine. DNA was extracted using Qiagen QIAamp DNA Stool Mini Kit (Qiagen) according to manufacturer’s instructions. DNA concentration and molecular weight were estimated using a nanodrop instrument (Thermo Scientific) and agarose gel electrophoresis, respectively.
TCR samples collection
Individuals with acute infection, severe allergy, active autoimmune disease, immune deficiency, or who have had bone marrow transplantation were excluded. CRC patients with ongoing chemotherapy, radiotherapy or immunotherapy were also excluded. Every participant donated approximately 2 ml of peripheral blood, which was collected via venipuncture with lavender top tubes using ethylene diamine tetraacetic acid (EDTA) as an anticoagulant. Peripheral blood samples were collected from CRC patients 1 week before surgery.
DNA library construction and sequencing
DNA library construction was performed following the manufacturer’s instruction (Illumina). We used the same workflow as described previouslyCitation57 to perform cluster generation, template hybridization, isothermal amplification, linearization, blocking and denaturation, and hybridization of the sequencing primers. We constructed one paired-end (PE) library with insert size of 350 bp for each sample, followed by a high-throughput sequencing with PE reads of length 2 × 150 bp. High-quality reads were obtained by filtering low-quality reads with ambiguous “N” bases, adapter contamination, and human DNA contamination from the Illumina raw reads, and by trimming low-quality terminal bases of reads simultaneously.Citation57 Over 90% of the reads remained after the filtering for low quality and then human reads (mapped to the hg19 reference) (55.2 million reads per sample).
De novo assembly and gene catalogue construction
The sequencing reads were quality controlled and de novo assembled into contigs using metaSPAdes (SPAdes-3.10.1) with the default parameters (–k 21,33,55).Citation58 Gene prediction from the assembled contigs was performed using Meta Gene Mark (Gene Mark. hmm version 3.38) with the default parameters.Citation59 Redundant genes were removed using Blastn with the cutoff of 90% length and 95% identity. Relative abundance of the genes were determined by aligning high-quality sequencing reads to the gene catalog using the same procedure as in ref.3.Citation57
Functional annotation
We aligned putative amino acid sequences, which are translated from the updated gene catalog, against the proteins/domains in eggNOG (v4.5) and KEGG databases (release 59.0) using diamond (e-value ≤1e-5).Citation60 Each protein was assigned to the KEGG orthologue group (KO) or eggNOG orthologue group (OG) of the highest scoring annotated hit(s) containing at least one HSP scoring over 60 bits. We used the methods introduced in Citation16 to calculate the abundance of proteins archived in the eggNOG and KEGG databases.Citation34 To calculate abundance of eggNOG or KEGG orthologue groups, we added abundance of proteins assigned into the same eggNOG or KEGG orthologue groups, as abundance of eggNOG or KEGG orthologue groups, then profiles of eggNOG/KEGG orthologue groups were generated.
Taxonomic annotation
The quality-controlled reads were processed with MetaPhlAn2 to obtain the taxonomic profile of the microbial community, and we used the MetaPhlAn2 calculation tool to analyze the species abundance of microbial communities.Citation61 Species abundance analysis of the CRC group and the HC group was performed by comparing the filtered reads with the characteristic marker genes of approximately 17,000 known microbial reference genomes (~13,500 bacteria and archaea, ~3,500 viruses, and ~110 eukaryotes.
CAG/MGS analysis
CAG/MGS analysis was conducted according to the refs 60 and 61.Citation62,Citation63 Briefly, random seed genes as ‘baits’ for identifying groups of genes that correlate (PCC >0.9) to the abundance profile of the bait genes. To center the canopy on a co-abundance gene group (CAG), the median gene abundance profile of the genes within the original seed canopy (or subsequent canopies, symbolized as +) is used iteratively to recapture a new canopy until it settles on a particular profile. The gene content of a settled canopy is named a metagenomic species (MGS) if it contains 700 or more genes. The smaller groups remain referred to as CAGs.
Taxonomic assignment for MGSs
All genes from one MGS were aligned to the 6835 reference microbial genomes (the available reference genomes from the National Center for Biotechnology Information) at the nucleotide level (by BLASTN). The alignment hits were filtered by both the e-value (<1 × 10⁻¹⁰ at the nucleotide level and if more than 90% of genes in this MGS can be mapped onto a reference genome with a threshold of 95% identity at the nucleotide level, we considered this particular MGS to originate from this known bacterial species.
Random forest analysis
The Wilcoxon rank-sum test was used to analyze differentially abundant TCR repertoires (fdr <0.05). And the mRMR algorithm was used to select best features. Then, we performed an incremental search to select the optimal subset of TCR repertoires and microbes, named as markers.
Using these markers, tenfold cross-validation was performed on a random forest model. Cross-validation refers to dividing the data into multiple pieces at random, and then leaving one piece each time for verification, where the other pieces are used for modeling and looped multiple times. For example, a tenfold cross-validation is a loop modeling verification 10 times. Species relative abundances and TCR data, also referred to as features, were analyzed using the Random Forest package in R (version 3.10). A forest is trained by supervised learning in which each tree in the forest finds an ideal split for a set of randomly chosen features such that the predicted outcome of each sample is the same as the expected outcome. The data partition found by every tree in a forest is used to vote on a predicted overall outcome of each sample. The voting strategy of Random Forest is documented in the literature to avoid the over fitting of data due to the random sampling of features by each tree. Using every tree to vote on an outcome prevents any single tree that may have memorized the data from having a dominant prediction. For our study, outcomes are disease or no disease. Before building the model, all of the features were filtered to identify features that are meaningless or interfere with the results, leaving only the significant and meaningful features. AUC or area under the receiver-operator curve measured the accuracy of trained forests. In addition, the trained random forest model was further validated on an independent validation cohort.
Multiplex‐PCR amplification of the TCR CDR3 region
The TCR CDR3 region was defined according to International ImMunoGeneTics collaboration, starting with the second conserved cysteine encoded by the 39 portions of the V gene segment and ending with the conserved phenylalanine encoded by 59 portions of the J gene segment. To generate the template library for Genome Analyzer, a multiplex‐PCR system was designed to amplify rearranged TCR CDR3 regions from genomic DNA using 35 forward primers, each is specific to a functional TCR V segment, and 4 reverse primers, each is specific to a TCR J segment. The forward and reverse primers contain, with their five ends, the universal forward and reverse primer sequences, respectively, which are compatible with GA2 cluster station solid‐phase PCR. After amplification and selection, the products were purified using screening magnetic beads from bamager fragment. The final library was quantified in two ways: by determining the average molecule length using the Agilent 2100 bioanalyzer instrument (Agilent DNA 1000 Reagents) and by Qubit 4 Fluorometer (Qubit; Invitrogen).
High‐throughput sequencing and TCR data analysis
The PCR products were sequenced on the Ion GeneStudio S5 Series platform. The read length of sequencing was 400 bp, and the sequencing quality of these reads was evaluated by the formula shown below. The quality of the HiSeq sequencing ranged from 0 to 40 and was used for filtering out low‐quality reads. First, we filtered the raw data, including adapter contamination. Reads with an average quality score lower than 15 (0–40 quality system) were removed, and if the average Q value of 30 bp at the third end is less than 15, we will directly cut off the last 15 bp at the third ‘end until the average Q value of 30 bp at the third end is greater than or equal to 15. After filtering, raw data in BAM format are converted into data in FASTQ format, and unmatched data and sequences less than 150 bp are removed from the sample. Sequencing results were divided into separate Fasta files for each sample according to the barcodes added during amplification and library preparation. Then, Fasta files containing TCRβ variable region sequences were analyzed by open access database IgBLAST (https://www.ncbi.nlm.nih.gov/igblast/) to identify the functional cDNA sequence, V- and J-gene usage, and amino acid sequences (including the CDR3 sequences). For each sample 30,000 sequences were picked randomly from the complete functional TCRβ variable region sequence set. The randomly picked sequences were defined as the Picked Set of TCR repertoire. If any sample contains fewer than 30,000 functional sequences, then all functional sequences would be used as the Picked Set. According to the identity of each sequence after alignment, the expression level of each clone was clear and calculated. The expression of each distinct DNA sequence, amino acid sequence, and V–J combination was also identified. In addition, to measure the diversity of each sample, we calculated the distinct clone number, the diversity 50 (D50) value, and based on different resolutions combinations. The expression level of each sample was also calculated at different resolutions of distinct DNA sequence, amino acid sequence, and V–J combination. Moreover, we constructed the specific expression graph and plotted a heatmap according to the V–J combination profile. The diversity of the TCR repertoire was calculated based on the Simpson index of diversity (Ds) and the Shannon – Wiener index (H).
FastTarget sequencing
Sixteen genes were screened for the detection of mutations in 79 patients. Genomic DNA with high quality suitable for sequencing was extracted from the tissues using TIANamp tissue DNA Extraction Kit (TIANGEN BIOTECH CO., LTD, Beijing, China). Target sequencing was performed on Illumina Hiseq/Nova seq high-throughput sequencing platform (Illumina, San Diego, CA, USA) according to the manufacturer’s instructions. Raw fastQ files were aligned to the human reference sequence (NCBI Genome build GRCh37, https://www.ncbi.nlm.nih.gov/genome/guide/human/#download) with the Burrows-Wheeler Aligner (BWA, http://bio-bwa.sourceforge.net/). The Haplotype- Caller from the Genome Analysis Toolkit (GATK, https://software.broadinstitute.org/gatk/best-practices/) and VarScan (http://varscan.sourceforge.net/) were used for variant calling in the target region. Quality of sequencing was determined with FastQC (http://www.bioinformatics. babraham.ac.uk/projects/fastqc/). PolyPhen-2 (http://gen etics.bwh.harvard.edu/pph2/) and SIFT (http://sift.bii.a-star.edu.sg/) were used to predict the deleterious level of the functional variants.
Variant filtration
After sequencing, a series of filters were used to prioritize variants. Variants were considered a higher priority if they were (a) predicted to affect protein-coding sequences (including nonsynonymous, frameshift deletion, and stop-gain variants in exonic or splicing regions); (b) less common in reference databases (Minor allele frequency was less than 0.05 in 1000 Genome project Chinese Han population [ht tp://ht tp.1000genomes.ebi.ac.uk/vol1/ftp/release/20130502/] and GeneSky in-house Database [http://www.geneskybiotech.com/]); (c) predicted as damaging, possibly damaging or unknown by SIFT or PolyPhen-2; (d) sequencing read depth was higher than 10×.
Statistical analysis
Continuous variables were compared using the Wilcoxon rank-sum test between both groups. Nonparametric one-way ANOVA was used among three groups. Multiple test correction was used when appropriate and tests were controlled for false discovery rate at significance level of 0.05. Fisher’s exact test compared categorical variables. Statistical analyses were performed using SPSS V.20.0 for Windows (SPSS, Chicago, Illinois, USA). P-value was corrected the by Benjamini–Hochberg Method when involving extensive multiple testing issues. These analyses were performed using GraphPad Prism software (version 5.1) and SPSS (version 20.0). Principal component analysis (PCA) was performed by R (version 3.4.3).
Storms checklist DOI:10.5281/zenodo.7797222.
Author contributions
Yuan Cao designed the experiments, collected and process samples, analyzed the data and wrote the manuscript. Yanqiang Ding contributed greatly to the bioinformatics analysis section of the article. Jifeng Wang, Weiliang Hou, Yefei Zhu and Ruting Xie participated in the collection of samples. Jiayi Zheng and Zhan Cao participated in the analysis of the data. Qing Wei supervised the project. Huanlong Qin reviewed and edited the manuscript and supervised the project.
Supplemental Material
Download Zip (7.4 MB)Acknowledgments
This work was supported by the National Natural Science Foundation of China (81802886) and Shanghai Tenth People’s Hospital Cultivation Project (2021SYPDRC029).
Disclosure statement
No potential conflict of interest was reported by the author(s).
Data availability statement
The raw sequence data reported in this paper have been deposited in the Genome Sequence Archive in National Genomics Data Center, China National Center for Bioinformation/Beijing Institute of Genomics, Chinese Academy of Sciences (GSA-Human: HRA002407) that are publicly accessible at https://ngdc.cncb.ac.cn/gsa-human.
Supplementary material
Supplemental data for this article can be accessed online at https://doi.org/10.1080/19490976.2023.2263934
Additional information
Funding
References
- Wong SH, Yu J. Gut microbiota in colorectal cancer: mechanisms of action and clinical applications. Nat Rev Gastro Hepat. 2019;16(11):690–22. doi:10.1038/s41575-019-0209-8.
- Lichtenstein P, Holm NV, Verkasalo PK, Iliadou A, Kaprio J, Koskenvuo M, Pukkala E, Skytthe A, Hemminki K. Environmental and heritable factors in the causation of cancer — analyses of Cohorts of Twins from Sweden, Denmark, and Finland. N Engl J Med. 2000;343(2):78–85. doi:10.1056/NEJM200007133430201.
- Chung H, Pamp SJ, Hill JA, Surana NK, Edelman SM, Troy EB, Reading N, Villablanca E, Wang S, Mora J, et al. Gut immune maturation depends on colonization with a host-specific microbiota. Cell. 2012;149(7):1578–1593. doi:10.1016/j.cell.2012.04.037.
- Jemal A, Bray F, Center MM, Ferlay J, Ward E, Forman D. Global cancer statistics. CA Cancer J Clin. 2011;61(2):69–90. doi:10.3322/caac.20107.
- Feng Q, Liang S, Jia H, Stadlmayr A, Tang L, Lan Z, Zhang D, Xia H, Xu X, Jie Z, et al. Gut microbiome development along the colorectal adenoma–carcinoma sequence. Nat Commun. 2015;6(1):6528. doi:10.1038/ncomms7528.
- Yang Y, Weng W, Peng J, Hong L, Yang L, Toiyama Y, Gao R, Liu M, Yin M, Pan C, et al. Fusobacterium nucleatum increases proliferation of colorectal cancer cells and tumor development in mice by activating toll-like receptor 4 signaling to nuclear Factor−κB, and up-regulating expression of MicroRNA-21. Gastroenterology. 2017;152(4):851–866.e24. doi:10.1053/j.gastro.2016.11.018.
- Sommer F, Backhed F. The gut microbiota — masters of host development and physiology. Nat Rev Microbiol. 2013;11(4):227–238. doi:10.1038/nrmicro2974.
- Zheng DW, Dong X, Pan P, Chen KW, Fan JX, Cheng SX, Zhang X-Z. Phage-guided modulation of the gut microbiota of mouse models of colorectal cancer augments their responses to chemotherapy. Nat Biomed Eng. 2019;3(9):717–728. doi:10.1038/s41551-019-0423-2.
- Sears CL, Garrett WS. Microbes, microbiota, and colon cancer. Cell Host & Microbe. 2014;15(3):317–328. doi:10.1016/j.chom.2014.02.007.
- Gopalakrishnan V, Spencer CN, Nezi L, Reuben A, Andrews MC, Karpinets TV, Prieto PA, Vicente D, Hoffman K, Wei SC, et al. Gut microbiome modulates response to anti–PD-1 immunotherapy in melanoma patients. Sci. 2018;359(6371):97–103. doi:10.1126/science.aan4236.
- Geller LT, Barzily-Rokni M, Danino T, Jonas OH, Shental N, Nejman D, Gavert N, Zwang Y, Cooper ZA, Shee K, et al. Potential role of intratumor bacteria in mediating tumor resistance to the chemotherapeutic drug gemcitabine. Sci. 2017;357(6356):1156–1160. doi:10.1126/science.aah5043.
- Zheng DW, Chen Y, Li ZH, Xu L, Li CX, Li B, Fan J-X, Cheng S-X, Zhang X-Z. Optically-controlled bacterial metabolite for cancer therapy. Nat Commun. 2018;9(1):1680. doi:10.1038/s41467-018-03233-9.
- Fan JX, Li ZH, Liu XH, Zheng DW, Chen Y, Zhang XZ. Bacteria-mediated tumor therapy utilizing photothermally-controlled TNF-α expression via oral administration. Nano Lett. 2018;18(4):2373–2380. doi:10.1021/acs.nanolett.7b05323.
- Liu X, Cui Y, Zhang Y, Liu Z, Zhang Q, Wu W, Zheng Z, Li S, Zhang Z, Li Y, et al. A comprehensive study of immunology repertoires in both preoperative stage and postoperative stage in patients with colorectal cancer. Molec Gen & Gen Med. 2019;7(3):e504. doi:10.1002/mgg3.504.
- Mercader M, Bodner BK, Moser MT, Kwon PS, Park ES, Manecke RG, Ellis TM, Wojcik EM, Yang D, Flanigan RC, et al. T cell infiltration of the prostate induced by androgen withdrawal in patients with prostate cancer. Proc Natl Acad Sci USA. 2001;98(25):14565–14570. doi:10.1073/pnas.251140998.
- Jia Q, Zhou J, Chen G, Shi Y, Yu H, Guan P, Lin R, Jiang N, Yu P, Li Q-J, et al. Diversity index of mucosal resident T lymphocyte repertoire predicts clinical prognosis in gastric cancer. Oncoimmunology. 2015;4(4):e1001230. doi:10.1080/2162402X.2014.1001230.
- Speranza E, Ruibal P, Port JR, Feng F, Burkhardt L, Grundhoff A, Günther S, Oestereich L, Hiscox JA, Connor JH, et al. T-Cell receptor diversity and the control of T-Cell homeostasis Mark Ebola virus disease survival in humans. J Infect Dis. 2018;218(suppl_5):S508–S18. doi:10.1093/infdis/jiy352.
- Shao H, Ou Y, Wang T, Shen H, Wu F, Zhang W, Tao C, Yuan Y, Bo H, Wang H, et al. Differences in TCR-Vβ repertoire and effector phenotype between tumor infiltrating lymphocytes and peripheral blood lymphocytes increase with Age. PloS One. 2014;9(7):e102327. doi:10.1371/journal.pone.0102327.
- Cremonesi E, Governa V, Garzon JFG, Mele V, Amicarella F, Muraro MG, Trella E, Galati-Fournier V, Oertli D, Däster SR, et al. Gut microbiota modulate T cell trafficking into human colorectal cancer. Gut. 2018;67(11):1984–1994. doi:10.1136/gutjnl-2016-313498.
- Singh N, Gurav A, Sivaprakasam S, Brady E, Padia R, Shi H, Thangaraju M, Prasad P, Manicassamy S, Munn D, et al. Activation of Gpr109a, receptor for niacin and the commensal metabolite butyrate, suppresses colonic inflammation and carcinogenesis. Immunity. 2014;40(1):128–139. doi:10.1016/j.immuni.2013.12.007.
- Cani PD, Jordan BF. Gut microbiota-mediated inflammation in obesity: a link with gastrointestinal cancer. Nat Rev Gastro Hepat. 2018;15(11):671–682. doi:10.1038/s41575-018-0025-6.
- Wood LD, Parsons DW, Jones S, Lin J, Sjoblom T, Leary RJ, Shen D, Boca SM, Barber T, Ptak J, et al. The genomic landscapes of human breast and colorectal cancers. Sci. 2007;318(5853):1108–1113. doi:10.1126/science.1145720.
- Sjoblom T, Jones S, Wood LD, Parsons DW, Lin J, Barber TD, Mandelker D, Leary RJ, Ptak J, Silliman N, et al. The consensus coding sequences of human breast and colorectal cancers. Sci. 2006;314(5797):268–274. doi:10.1126/science.1133427.
- Bass AJ, Lawrence MS, Brace LE, Ramos AH, Drier Y, Cibulskis K, Sougnez C, Voet D, Saksena G, Sivachenko A, et al. Genomic sequencing of colorectal adenocarcinomas identifies a recurrent VTI1A-TCF7L2 fusion. Nat Genet. 2011;43(10):964–968. doi:10.1038/ng.936.
- Fearon ER. Molecular genetics of colorectal cancer. Annu Rev Pathol. 2011;6(1):479–507. doi:10.1146/annurev-pathol-011110-130235.
- Zaidi SH, Harrison TA, Phipps AI, Steinfelder R, Trinh QM, Qu C, Banbury BL, Georgeson P, Grasso CS, Giannakis M, et al. Landscape of somatic single nucleotide variants and indels in colorectal cancer and impact on survival. Nat Commun. 2020;11(1):3644. doi:10.1038/s41467-020-17386-z.
- Chang YS, Lee CC, Ke TW, Chang CM, Chao DS, Huang HY, Chang J-G. Molecular characterization of colorectal cancer using whole-exome sequencing in a Taiwanese population. Cancer Med. 2019;8(8):3738–3747. doi:10.1002/cam4.2282.
- Rubinstein MR, Wang X, Liu W, Hao Y, Cai G, Han YW. Fusobacterium nucleatum promotes colorectal carcinogenesis by modulating E-cadherin/beta-catenin signaling via its FadA adhesin. Cell Host & Microbe. 2013;14:195–206. doi:10.1016/j.chom.2013.07.012.
- Mima K, Sukawa Y, Nishihara R, Qian ZR, Yamauchi M, Inamura K, Kim SA, Masuda A, Nowak JA, Nosho K, et al. Fusobacterium nucleatum and T cells in colorectal carcinoma. JAMA Oncol. 2015;1(5):653–661. doi:10.1001/jamaoncol.2015.1377.
- Tomkovich S, Yang Y, Winglee K, Gauthier J, Muhlbauer M, Sun X, Mohamadzadeh M, Liu X, Martin P, Wang GP, et al. Locoregional effects of microbiota in a preclinical model of Colon carcinogenesis. Cancer Res. 2017;77(10):2620–2632. doi:10.1158/0008-5472.CAN-16-3472.
- Kostic AD, Chun E, Robertson L, Glickman JN, Gallini CA, Michaud M, Clancy T, Chung D, Lochhead P, Hold G, et al. Fusobacterium nucleatum potentiates intestinal tumorigenesis and modulates the tumor-immune microenvironment. Cell Host & Microbe. 2013;14(2):207–215. doi:10.1016/j.chom.2013.07.007.
- Cui JH, Lin KR, Yuan SH, Jin YB, Chen XP, Su XK, Jiang J, Pan Y-M, Mao S-L, Mao X-F, et al. TCR repertoire as a novel indicator for immune monitoring and prognosis assessment of patients with cervical cancer. Front Immunol. 2018;9:2729. doi:10.3389/fimmu.2018.02729.
- Chen Z, Zhang C, Pan Y, Xu R, Xu C, Chen Z, Lu Z, Ke Y. T cell receptor β-chain repertoire analysis reveals intratumour heterogeneity of tumour-infiltrating lymphocytes in oesophageal squamous cell carcinoma. J Pathol. 2016;239(4):450–458. doi:10.1002/path.4742.
- Qin J, Li R, Raes J, Arumugam M, Burgdorf KS, Manichanh C, Nielsen T, Pons N, Levenez F, Yamada T, et al. A human gut microbial gene catalogue established by metagenomic sequencing. Nature. 2010;464(7285):59–65. doi:10.1038/nature08821.
- Bazzi ZA, Sneddon S, Zhang PGY, Tai IT. Characterization of the immune cell landscape in CRC: clinical implications of tumour-infiltrating leukocytes in early- and late-stage CRC. Front Immunol. 2022;13:978862. doi:10.3389/fimmu.2022.978862.
- Gelsomino F, Barbolini M, Spallanzani A, Pugliese G, Cascinu S. The evolving role of microsatellite instability in colorectal cancer: a review. Cancer Treat Rev. 2016;51:19–26. doi:10.1016/j.ctrv.2016.10.005.
- Sanz-Pamplona R, Melas M, Maoz A, Schmit SL, Rennert H, Lejbkowicz F, Greenson JK, Sanjuan X, Lopez-Zambrano M, Alonso MH, et al. Lymphocytic infiltration in stage II microsatellite stable colorectal tumors: a retrospective prognosis biomarker analysis. PLoS Med. 2020;17(9):e1003292. doi:10.1371/journal.pmed.1003292.
- Yachida S, Mizutani S, Shiroma H, Shiba S, Nakajima T, Sakamoto T, Watanabe H, Masuda K, Nishimoto Y, Kubo M, et al. Metagenomic and metabolomic analyses reveal distinct stage-specific phenotypes of the gut microbiota in colorectal cancer. Nat Med. 2019;25(6):968–976. doi:10.1038/s41591-019-0458-7.
- Duncan SH, Hold GL, Harmsen HJM, Stewart CS, Flint HJ. Growth requirements and fermentation products of Fusobacterium prausnitzii, and a proposal to reclassify it as faecalibacterium prausnitzii gen. nov., comb. nov. Int J Syst Evol Microbiol. 2002;52(6):2141–2146. doi:10.1099/00207713-52-6-2141.
- Duncan SH, Louis P, Flint HJ. Lactate-utilizing bacteria, isolated from human feces, that produce butyrate as a major fermentation product. Appl Environ Microb. 2004;70(10):5810–5817. doi:10.1128/AEM.70.10.5810-5817.2004.
- Chaput N, Lepage P, Coutzac C, Soularue E, Le Roux K, Monot C, Boselli L, Routier E, Cassard L, Collins M, et al. Baseline gut microbiota predicts clinical response and colitis in metastatic melanoma patients treated with ipilimumab. Ann Oncol : Off J Eur Soc Medi Oncol. 2017;28(6):1368–1379. doi:10.1093/annonc/mdx108.
- Frankel AE, Coughlin LA, Kim J, Froehlich TW, Xie Y, Frenkel EP, Koh AY. Metagenomic shotgun sequencing and unbiased metabolomic profiling identify specific human gut microbiota and metabolites associated with immune checkpoint therapy efficacy in melanoma patients. Neoplasia. 2017;19(10):848–855. doi:10.1016/j.neo.2017.08.004.
- Lonardi S, Munoz-Amatriain M, Liang Q, Shu S, Wanamaker SI, Lo S, Tanskanen J, Schulman AH, Zhu T, Luo M-C, et al. The genome of cowpea (vigna unguiculata [L.] Walp.). Plant J. 2019;98(5):767–782. doi:10.1111/tpj.14349.
- Sabanadzovic S, Valverde RA, Brown JK, Martin RR, Tzanetakis IE. Southern tomato virus: the link between the families totiviridae and partitiviridae. Virus Res. 2009;140(1–2):130–137. doi:10.1016/j.virusres.2008.11.018.
- Li RH, Zettler FW, Purcifull DE, Hiebert E. The nucleotide sequence of the 3′-terminal region of dasheen mosaic virus (Caladium isolate) and expression of its coat protein in Escherichia coli for antiserum production. Arch Virol. 1998;143(12):2461–2469. doi:10.1007/s007050050476.
- Babu B, Hegde V. Molecular characterization of Dasheen mosaic virus isolates infecting edible aroids in India. Acta Virol. 2014;58(1):34–42. doi:10.4149/av_2014_01_34.
- Hao Y, Samuels Y, Li Q, Krokowski D, Guan BJ, Wang C, Jin Z, Dong B, Cao B, Feng X, et al. Oncogenic PIK3CA mutations reprogram glutamine metabolism in colorectal cancer. Nat Commun. 2016;7(1):11971. doi:10.1038/ncomms11971.
- Cao Y, Lin SH, Wang Y, Chin YE, Kang L, Mi J. Glutamic pyruvate transaminase GPT2 promotes tumorigenesis of breast cancer cells by activating sonic hedgehog signaling. Theranostics. 2017;7(12):3021–3033. doi:10.7150/thno.18992.
- Willard SS, Koochekpour S. Glutamate signaling in benign and malignant disorders: current status, future perspectives, and therapeutic implications. Int J Biol Sci. 2013;9(7):728–742. doi:10.7150/ijbs.6475.
- Shroff EH, Eberlin LS, Dang VM, Gouw AM, Gabay M, Adam SJ, Bellovin, DI, Tran, PT, Philbrick, WM, Garcia-Ocana, A, et al. MYC oncogene overexpression drives renal cell carcinoma in a mouse model through glutamine metabolism. Proc Natl Acad Sci U S A. 2015;112(21):6539–6544.
- Seidlitz EP, Sharma MK, Saikali Z, Ghert M, Singh G. Cancer cell lines release glutamate into the extracellular environment. Clin Exp Metastasis. 2009;26(7):781–787. doi:10.1007/s10585-009-9277-4.
- Collins CL, Wasa M, Souba WW, Abcouwer SF. Determinants of glutamine dependence and utilization by normal and tumor-derived breast cell lines. J Cell Physiol. 1998;176(1):166–178. doi:10.1002/(SICI)1097-4652(199807)176:1<166:AID-JCP18>3.0.CO;2-5.
- Karlsson FH, Tremaroli V, Nookaew I, Bergstrom G, Behre CJ, Fagerberg B, Nielsen J, Bäckhed F. Gut metagenome in European women with normal, impaired and diabetic glucose control. Nature. 2013;498(7452):99–103. doi:10.1038/nature12198.
- Ito M, Kanno S, Nosho K, Sukawa Y, Mitsuhashi K, Kurihara H, Igarashi H, Takahashi T, Tachibana M, Takahashi H, et al. Association of Fusobacterium nucleatum with clinical and molecular features in colorectal serrated pathway. Int J Cancer. 2015;137(6):1258–1268. doi:10.1002/ijc.29488.
- Zhang S, Yang Y, Weng W, Guo B, Cai G, Ma Y, Cai S. Fusobacterium nucleatum promotes chemoresistance to 5-fluorouracil by upregulation of BIRC3 expression in colorectal cancer. J Exp Clin Cancer Res. 2019;38(1):14. doi:10.1186/s13046-018-0985-y.
- Gur C, Ibrahim Y, Isaacson B, Yamin R, Abed J, Gamliel M, Enk J, Bar-On Y, Stanietsky-Kaynan N, Coppenhagen-Glazer S, et al. Binding of the Fap2 protein of Fusobacterium nucleatum to human inhibitory receptor TIGIT protects tumors from immune cell attack. Immunity. 2015;42(2):344–355. doi:10.1016/j.immuni.2015.01.010.
- Qin J, Li Y, Cai Z, Li S, Zhu J, Zhang F, Liang S, Zhang W, Guan Y, Shen D, et al. A metagenome-wide association study of gut microbiota in type 2 diabetes. Nature. 2012;490(7418):55–60. doi:10.1038/nature11450.
- Nurk S, Meleshko D, Korobeynikov A, Pevzner PA. metaSpades: a new versatile metagenomic assembler. Genome Res. 2017;27(5):824–834. doi:10.1101/gr.213959.116.
- Zhu W, Lomsadze A, Borodovsky M. Ab initio gene identification in metagenomic sequences. Nucleic Acids Res. 2010;38(12):e132. doi:10.1093/nar/gkq275.
- Buchfink B, Xie C, Huson DH. Fast and sensitive protein alignment using DIAMOND. Nat Methods. 2015;12(1):59–60. doi:10.1038/nmeth.3176.
- Arumugam M, Raes J, Pelletier E, Le Paslier D, Yamada T, Mende DR, Fernandes GR, Tap J, Bruls T, Batto J-M, et al. Enterotypes of the human gut microbiome. Nature. 2011;473(7346):174–180. doi:10.1038/nature09944.
- Le Chatelier E, Nielsen T, Qin J, Prifti E, Hildebrand F, Falony G, Almeida M, Arumugam M, Batto J-M, Kennedy S, et al. Richness of human gut microbiome correlates with metabolic markers. Nature. 2013;500(7464):541–546. doi:10.1038/nature12506.
- Nielsen HB, Almeida M, Juncker AS, Rasmussen S, Li J, Sunagawa S, Plichta DR, Gautier L, Pedersen AG, Le Chatelier E, et al. Identification and assembly of genomes and genetic elements in complex metagenomic samples without using reference genomes. Nat Biotechnol. 2014;32(8):822–828. doi:10.1038/nbt.2939.