
ABSTRACT
The gut microbiota interacts with intestinal epithelial cells through microbial metabolites to regulate the release of gut hormones. We investigated whether the gut microbiota affects the postprandial glucagon-like peptide-1 (GLP-1) response using antibiotic-treated mice and germ-free mice. Gut microbiome depletion completely abolished postprandial GLP-1 response in the circulation and ileum in a lipid tolerance test. Microbiome depletion did not influence the GLP-1 secretory function of primary ileal cells in response to stimulators in vitro, but dramatically changed the postprandial dynamics of endogenous bile acids, particularly ω-muricholic acid (ωMCA) and hyocholic acid (HCA). The bile acid receptor Takeda G protein-coupled receptor 5 (TGR5) but not farnesoid X receptor (FXR), participated in the regulation of postprandial GLP-1 response in the circulation and ileum, and ωMCA or HCA stimulated GLP-1 secretion via TGR5. Finally, fecal microbiota transplantation or ωMCA and HCA supplementation restored postprandial GLP-1 response. In conclusion, gut microbiota is indispensable for maintaining the postprandial GLP-1 response specifically in the ileum, and bile acid (ωMCA and HCA)-TGR5 signaling is involved in this process. This study helps to understand the essential interplay between the gut microbiota and host in regulating postprandial GLP-1 response and opens the foundation for new therapeutic targets.
Introduction
The prevalence of chronic metabolic diseases, such as type 2 diabetes and obesity, has increased globally. Glucagon-like peptide-1 (GLP-1) is an incretin and satiety hormone secreted by intestinal enteroendocrine L-cells. It enhances glucose-induced insulin release and suppresses appetite, thus contributing to the control of blood glucose levels and body weight.Citation1–4 Therefore, a better understanding of the mechanism underlying GLP-1 secretion is of great importance for the development of new therapeutic approaches for type 2 diabetes and obesity.Citation5
GLP-1, a post-translational product of proglucagon, is packaged in secretory granules and released by L-cells located predominantly in the distal ileum and colon.Citation1,Citation6,Citation7 Total GLP-1 (1–37) is susceptible to amidation and proteolytic cleavage, which gives rise to the two truncated and equally biologically active GLP-1 forms, amidated GLP-1 (7–36) and glycine-extended GLP-1 (7–37).Citation1 L-cells are open-type triangular epithelial cells that directly contact the intestinal lumen and can be stimulated by various luminal nutrients or other factors.Citation8 In the fasting state, GLP-1 is autonomously released into the circulation.Citation9 Upon ingestion of a meal, GLP-1 secretion is augmented shortly, and the amplitude of plasma GLP-1 spike is influenced by the composition and size of the meal.Citation10,Citation11 A lot of nutrients have been found to stimulate GLP-1 secretion, including glucose,Citation4,Citation12 lipids,Citation13 proteinsCitation14 and certain amino acids.Citation15,Citation16 The mechanism of nutrient-induced GLP-1 secretion has been illustrated quite clearly in vitro. However, it is still unclear which part of the intestine contributes the most in vivo and whether other factors, such as gut microbiota, are involved in the postprandial GLP-1 response.
The intestinal microbial ecosystem, comprising bacteria, viruses, and fungi, forms a critical interface between the host and external environment. Accumulating evidence has shown that commensal bacteria, hereto referred to as gut microbiota, are involved in the etiology of type 2 diabetes, obesity, and many other metabolic diseases.Citation17,Citation18 Gut microbiota produces a vast array of metabolites by breaking down dietary nutrients or other components of the host. Subsequently, these microbial metabolites act as signaling molecules and transmit signals to the intestinal epithelial cells and distal organs to modulate a variety of pathophysiological processes.Citation17,Citation19 A range of microbial metabolites, including secondary bile acids and short chain fatty acids, have been shown to stimulate GLP-1 secretion.Citation19 Bile acids are produced in the liver from cholesterol and released into the duodenum upon food intake to facilitate the digestion and absorption of lipids.Citation20 Around 95% of the released bile acids are reabsorbed at the terminal ileum into the enterohepatic circulation. Only around 5% of bile acids reach the colon, where the local bacteria promote the deconjugation and biotransformation of the primary bile acids into secondary bile acids.Citation21 The bile acid receptor Takeda G protein-coupled receptor 5 (TGR5) has been shown to regulate GLP-1 secretion and glucose metabolism,Citation22,Citation23 while the effect of farnesoid X receptor (FXR) on GLP-1 secretion is not consistent.Citation24,Citation25 Until now, it has not been determined whether gut microbiota and microbial bile acids contribute to the regulation of postprandial GLP-1 response, and whether TGR5 or FXR is involved in this process.
Studies have shown that fasting plasma GLP-1 levels increase dramatically in germ-free (GF) miceCitation26 as well as in mice with antibiotic-induced microbiome depletion.Citation27 In this study, we aimed to further investigate whether the postprandial GLP-1 response is influenced by gut microbiota. Lipids account for a large proportion of dietary ingredients, and a high-fat diet is a major risk factor for obesity. Therefore, we performed a lipid tolerance test to determine the postprandial state. Using antibiotic-treated (ABX) mice and GF mice, we found that the gut microbiome was indispensable for maintaining the postprandial GLP-1 response specifically in the ileum. Endogenous bile acids, especially ω-muricholic acid (ωMCA) and hyocholic acid (HCA), participated in this acute physiological process by activating the bile acid receptor TGR5.
Results
Gut microbiome depletion abolishes postprandial GLP-1 response in the circulation
In comparison with control male SPF mice, fasting plasma levels of total and active GLP-1 dramatically increased in ABX mice and GF mice (). Postprandial GLP-1 response was evaluated by a lipid tolerance test using olive oil gavage. Plasma levels of total and active GLP-1 secretion increased and peaked at 20 min after olive oil gavage in SPF mice. Strikingly, this reaction completely disappeared in ABX and GF mice, resulting in a significant difference between groups (). To confirm the phenotypes of GLP-1 response observed in males, the lipid tolerance test was performed in female SPF- and ABX- mice. Similar to male mice, fasting plasma GLP-1 level was increased and the GLP-1 response was abolished by ABX treatment in female mice (Fig. S1A and S1B). Therefore, the following experiments were mainly done in male mice.
Figure 1. Gut microbiome depletion increases fasting plasma GLP-1 level and completely abolishes postprandial GLP-1 response. (a, b) Comparison of fasting levels of total GLP-1 (a) and active GLP-1 (b) in the plasma of control SPF mice and gut microbiome-depleted (ABX and GF) mice (n = 6 per group). (c, d) Total GLP-1 response (c) and active GLP-1 response (d) after olive oil gavage in the plasma of SPF, ABX and GF mice (n = 6/time point/group). (e, f) Fasting active GLP-1 levels (e) and active GLP-1 response after olive oil gavage (f) in the plasma from mice treated with antibiotics for 0 h, 24 h, 48 h, 72 h, respectively (n = 5 per group). Data are shown as mean ± SEM. *P < .05, **P < .01, ***P < .001, vs. 0 min; #P < .05, ##P < .01, ###P < .001, vs. SPF mice or 0 h. Statistical significance was determined by (a, b, e) one-way ANOVA with the Dunnett’s posttest or (c, d, f) two-way ANOVA with the Dunnett’s posttest.
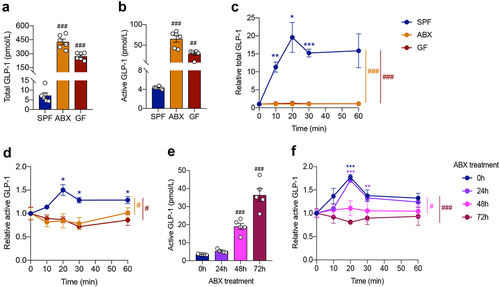
To illustrate the effect of gut microbiome depletion on GLP-1 levels, we treated mice with antibiotics for a short term of 24 h, 48 h, and 72 h, respectively. Antibiotic treatment for 24 h did not significantly influence fasting GLP-1 levels or postprandial GLP-1 responses in the plasma (). However, the fasting GLP-1 level increased 5 times (19.00 ± 1.59 pmol/L vs. 3.57 ± 0.09 pmol/L) after antibiotics treatment for 48 h, and went further high at 72 h (). Meanwhile, GLP-1 levels did not increase in response to olive oil gavage after antibiotics treatment for 48 h and 72 h (). These results indicated that gut microbiome depletion rapidly affected the postprandial GLP-1 response.
Fasting plasma levels of other hormones, including PYY and ghrelin, were also elevated by gut microbiome depletion (Fig. S1C and S1D). In contrast, fasting insulin and C-peptide levels decreased in ABX mice, but did not change in GF mice (Fig. S1E and S1F). In the lipid tolerance test, the postprandial PYY response was eliminated in ABX and GF mice (Fig. S1G). The ghrelin response was not obviously affected by gut microbiome depletion (Fig. S1H). Plasma insulin and C-peptide levels were elevated after olive oil gavage in SPF and ABX mice but not in GF mice (Fig. S1I and S1J).
Gut microbiome depletion abolishes postprandial GLP-1 response particularly in the ileum
Since plasma GLP-1 is mainly derived from the secretion of intestinal enteroendocrine L-cells, we measured GLP-1 levels in gut tissue segments (jejunum (12 cm from the pylorus), terminal ileum, and proximal colon) to investigate whether the postprandial GLP-1 response was affected by gut microbiota in an intestinal region-dependent manner.
In comparison with the jejunum, basal active GLP-1 content was much higher in the ileum and colon of SPF, ABX and GF mice (Table S1). This indicated that the majority of GLP-1 levels came from the ileum and colon, supporting the importance of the distal gut for GLP-1 secretion. Further, active GLP-1 content increased in the ileum and colon but not in the jejunum of ABX and GF mice as compared with SPF mice (). Consistently, immunofluorescence staining showed that the number of GLP-1 positive cells increased in the ileum and colon, but not in the jejunum, after gut microbiome depletion ().
Figure 2. Gut microbiome depletion abolishes postprandial GLP-1 response particularly in the ileum. (a) Comparison of fasting active GLP-1 level in the intestinal tissue from SPF, ABX and GF mice (n = 6 per group). (b) Representative immunofluorescence staining for GLP-1 (green) and quantification of GLP-1 positive cells in the jejunum, ileum and colon of SPF, ABX and GF mice (n = 6 fields of 3 mice per group with each mice containing 2 fields). Nuclei were stained by DAPI (blue). Scale bars, 200 μm. (c-e) GLP-1 response after olive oil gavage in the jejunum (c), ileum (d), and colon (e) of SPF, ABX and GF mice (n = 6/time point/group). (f, g) The effect of known GLP-1 secretagogues (Ibmx/forskolin (I/F), palmitate, glucose and deoxycholic acid (DCA)) on GLP-1 secretion in primary ileal cells (n = 4 per group) (f) and in fresh ileal tissue segments (n = 6 per group) (g) isolated from SPF and ABX mice. Data are shown as mean ± SEM. *P < .05, **P < .01, ***P < .001, vs. 0 min or control; #P < .05, ##P < .01, ###P < .001, vs. SPF mice. Statistical significance was determined by (a, b) one-way ANOVA with the Dunnett’s posttest or (c-g) two-way ANOVA with the Dunnett’s posttest.
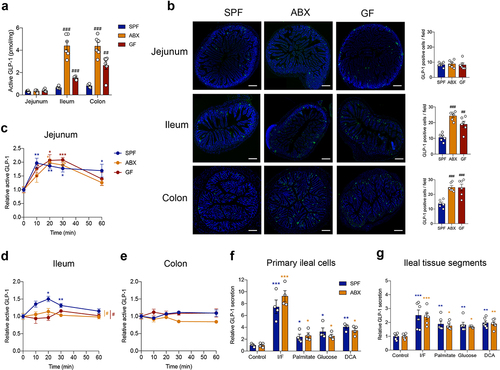
In the lipid tolerance test, GLP-1 levels were significantly increased in the jejunum from SPF mice, as well as from ABX and GF mice after olive oil gavage, and no difference was observed between the three groups ( and Table S1). Notably, in the ileum, GLP-1 levels increased significantly in response to olive oil gavage in SPF mice, but this response was lost in ABX and GF mice ( and Table S1). GLP-1 secretion in the colon did not respond to olive oil gavage ( and Table S1). These results indicated that the gut microbiota modulated the postprandial GLP-1 response, particularly in the ileum.
Primary intestinal epithelial cells were isolated from the ileum of SPF and ABX mice. Sodium palmitate was used to mimic the effects of olive oil in vitro, and IBMX/forskolin was used as a positive control, to determine the secretory function of ileal cells in vitro. Sodium palmitate stimulated GLP-1 secretion in primary ileal cells from both SPF and ABX mice with the same sensitivity, as well as other known GLP-1 secretagogues, including glucose and bile acid deoxycholic acid (DCA) (). Similar results were observed by using isolated fresh ileal tissue segments (). These data suggested that gut microbiome depletion did not affect GLP-1 secretion in ileal cells in response to stimulators in vitro. In addition, the mRNA expression of GPR120 (a receptor that can mediate lipid-induced GLP-1 secretion),Citation13 SGLT1 (a transporter that can mediate glucose-induced GLP-1 secretion),Citation28 or the bile acid receptor FXR was not different in the ileum between SPF and ABX or GF mice (Fig. S2A-S2C). The bile acid receptor TGR5 was downregulated in GF mice but not in ABX mice (Fig. S2D). Therefore, we speculated that gut microbiome depletion may influence the production of some metabolites in vivo, which contributed to the regulation of the postprandial GLP-1 response.
Gut microbiome depletion eliminates the increase of postprandial bile acids that stimulate GLP-1 secretion in the ileum
Bile acids, metabolized by gut microbiota, play essential roles in lipid metabolism and are released immediately into the duodenum upon food intake.Citation20 What’s more, large amounts of bile acids are reabsorbed into the enterohepatic circulation at the terminal ileum. Therefore, we speculated that gut microbiome depletion altered bile acid dynamics, which may lead to the loss of postprandial GLP-1 response in the ileum. 28 bile acids were included in this quantification. We divided these bile acids (BAs) into four groups: primary unconjugated BAs (Cholic acid (CA), Chenodeoxycholic acid (CDCA), α-muricholic acid (αMCA), β-muricholic acid (βMCA), HCA and Ursodeoxycholic acid (UDCA)), primary conjugated BAs (Glycocholic acid (GCA), Taurocholic acid (TCA), Glycochenodeoxycholic acid (GCDCA), Taurochenodeoxycholic acid (TCDCA), Tauro-α-muricholic acid (TαMCA), Tauro-β-muricholic acid (TβMCA), Glycohyocholic acid (GHCA), Taurohyocholic acid (THCA) and Glycoursodeoxycholic acid (GUDCA)), secondary unconjugated BAs (DCA, ωMCA, Hyodeoxycholic acid (HDCA), Murideoxycholic acid (MDCA) and 12-ketolithocholic acid (12KLCA)), and secondary conjugated BAs (Glycodeoxycholic acid (GDCA), Taurodeoxycholic acid (TDCA), Glycolithocholic acid (GLCA), Taurolithocholic acid (TLCA), Tauro-ω-muricholic acid (TωMCA), Glycodehydrocholic acid (GDHCA), Taurodehydrocholic acid (TDHCA), Taurohyodeoxycholic acid (THDCA)).
In the fasting state, the total bile acid pool was significantly decreased in the ileum of ABX and GF mice compared to SPF mice (Fig. S2E). Specifically, the concentration of primary unconjugated BAs and secondary BAs was largely reduced after gut microbiome depletion (Fig. S2F). After olive oil gavage, the concentration of primary unconjugated BAs tended to decrease, and primary- and secondary conjugated BAs decreased at 60 min and 30 min in the plasma of SPF mice, respectively, whereas secondary unconjugated BAs increased significantly at 10 min (Fig. S3A). A similar pattern was observed in the ileum of SPF mice (Fig. S3B). As expected, in microbiome-depleted mice, BAs did not show these fluctuations in response to olive oil gavage in the ileum (Fig. S3C and S3D).
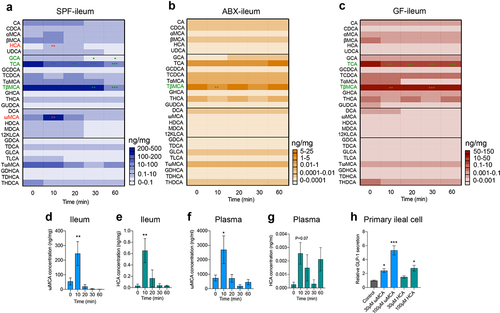
Among the 28 bile acids, the concentrations of HCA (0.65±0.21 ng/mg vs. 0.032±0.029 ng/mg) and ωMCA (245.1 ± 81.9 ng/mg vs. 54.5 ± 24.0 ng/mg) increased at the time point of 10 min after olive oil gavage in the ileum of SPF mice (), while GCA, TCA, and TβMCA decreased in a time-dependent manner, and other bile acid components did not change significantly (). In contrast to SPF mice, no significant increase in bile acid levels was detected in the ileum of ABX and GF mice (). TβMCA decreased in the ileum of ABX mice (), whereas TCA and TβMCA decreased in GF mice (). In the plasma of SPF mice, ωMCA increased at 10 min and HCA tended to increase at 10 min after olive oil gavage (). An in vitro study of primary ileal cells isolated from SPF mice showed that ωMCA and HCA stimulated GLP-1 secretion in a concentration-dependent manner (). Taken together, these results indicated that gut microbiome depletion eliminated the increase of postprandial ωMCA and HCA that stimulate GLP-1 secretion, which may lead to the loss of GLP-1 response.
Figure 3. Gut microbiome depletion eliminates the changes of specific bile acids in response to olive oil. (a-c) Heatmap showing the changes in 28 bile acids after olive oil gavage in the ileum of SPF (a), ABX (b) and GF (c) mice (n = 5-6/time point/group). (d-g) Changes in ωMCA and HCA after olive oil gavage in the ileum (d, e), and plasma (f, g) of SPF mice (n = 5-6 per time point). (h) The effect of ωMCA and HCA on GLP-1 secretion in primary ileal cells isolated from SPF mice (n = 3 per group). Data are shown as mean ± SEM. *P < .05, **P < .01, ***P < .001, vs. 0 min or control. Statistical significance was determined by one-way ANOVA with the Dunnett’s posttest. Abbreviations: ωMCA: ω-muricholic acid; HCA: hyocholic acid.
Bile acid receptor TGR5 mediates postprandial GLP-1 response in the circulation and ileum
Using the bile acid receptor TGR5 or FXR global knockout (KO) mice, we found that in the fasting state (0 min), GLP-1 levels in the plasma and in the intestinal tissue were not affected by TGR5 ablation () or FXR ablation (). The L-cell density in the intestinal tissue was not influenced by TGR5 or FXR ablation as well (Fig. S4). These data indicated that the bile acid receptor TGR5 and FXR deletion did not affect basal GLP-1 levels.
Figure 4. Bile acid receptor TGR5 but not FXR mediates postprandial GLP-1 response in the circulation and ileum. (a-d) GLP-1 response after olive oil gavage in the plasma (a) and intestinal tissue (b-d) of wild-type (WT) and TGR5 KO mice (n = 5–6/time point/group). (e-h) GLP-1 response after olive oil gavage in the plasma (e) and intestinal tissue (f-h) of WT and FXR KO mice (n = 6/time point/group). (i) The effect of TGR5 or FXR agonists on GLP-1 secretion in primary ileal cells isolated from SPF mice (n = 4 per group). (j, k) The effect of ωMCA and HCA on GLP-1 secretion in primary ileal cells isolated from WT vs. TGR5 KO mice (j) and WT vs. FXR KO mice (k) (n = 4 per group). Data are shown as mean ± SEM. *P < .05, **P < .01, ***P < .001, vs. 0 min or control; #P < .05, ###P < .001, vs. WT mice. Statistical significance was determined by (a-h, j, k) two-way ANOVA with the Dunnett’s posttest or (i) one-way ANOVA with the Dunnett’s posttest.
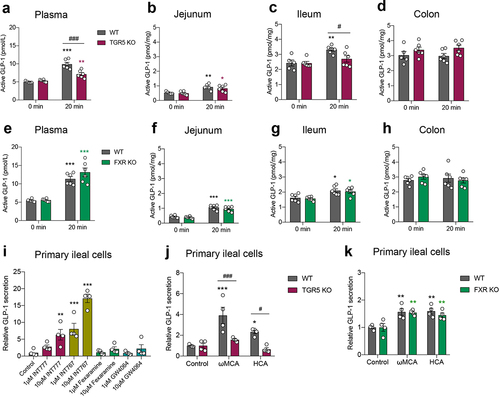
Since GLP-1 secretion peaked at 20 min after olive oil gavage, we next selected this time point to study whether TGR5 or FXR participated in the regulation of postprandial GLP-1 response. Plasma GLP-1 levels increased after olive oil gavage in wild-type (WT) mice, whereas this response was partially abolished in TGR5 KO mice (). At the intestinal tissue level, olive oil gavage elevated GLP-1 levels in the jejunum of both WT and TGR5 KO mice with the same sensitivity (). Notably, GLP-1 levels increased after olive oil gavage in the ileum of WT mice but not in TGR5 KO mice, resulting in a significant difference between the two groups (). No increase in GLP-1 levels after olive oil gavage was observed in the colon of the two groups (). FXR KO did not alter GLP-1 levels in response to olive oil in the plasma or intestinal tissues ().
An in vitro study in primary ileal cells showed that the TGR5 agonist INT777 and the TGR5/FXR dual agonist INT767 stimulated GLP-1 secretion (). The FXR agonists, Fexaramine and GW4064, did not affect GLP-1 secretion (). The bile acids ωMCA and HCA increased GLP-1 secretion in ileal cells isolated from WT mice, but not in those from TGR5 KO mice (). FXR KO did not influence the effects of ωMCA and HCA on GLP-1 secretion (). Taken together, these results indicated that the bile acid receptor TGR5, but not FXR, participated in the mediation of the postprandial GLP-1 response in the circulation and ileum.
FMT or bile acid treatment recovers postprandial GLP-1 response in microbiome-depleted mice
We next examined whether the postprandial GLP-1 response could be recovered by fecal microbiota transplantation (FMT). Compared to GF mice, fasting plasma GLP-1 levels were largely decreased after FMT (). FMT also reduced GLP-1 levels and the number of GLP-1 positive cells in the ileum and colon (). After olive oil gavage, the GLP-1 response was recovered in the plasma and ileum by FMT, while GLP-1 response in the jejunum and colon was not influenced by FMT (). Meanwhile, fasting levels of secondary BAs were dramatically increased in the ileum after FMT (), indicating the efficient metabolism of the gut microbiota on bile acids. In the lipid tolerance test, ωMCA was significantly increased at 10 min in the ileum and plasma of FMT mice (), while HCA was not significantly increased ().
Figure 5. FMT or bile acid treatment recovers postprandial GLP-1 response in microbiome- depleted mice. (a, b) Comparison of fasting GLP-1 levels in the plasma (a) and intestinal tissue (b) of GF mice and GF mice colonized with fecal microbiota (FMT) (n = 6 per group). (c) Representative immunofluorescence staining for GLP-1 (green) and quantification of GLP-1 positive cells in the ileum and colon from GF and FMT mice (n = 6 fields of 3 mice per group with each mice containing 2 fields). Nuclei were stained by DAPI (blue). Scale bars, 200 μm. (d-g) GLP-1 response after olive oil gavage in the plasma (d) and intestinal tissue (e-g) of GF and FMT mice (n = 6/time point/group). (h, i) Concentration of fasting primary bile acids (h) and secondary bile acids (i) in the ileum of GF and FMT mice (n = 6/group). (j, k) Changes in ωMCA after olive oil gavage in the ileum (j) and plasma (k) of FMT mice (n = 6 per time point). (l) Changes in HCA after olive oil gavage in the ileum of FMT mice (n = 6 per time point). (m, n) Comparison of fasting GLP-1 levels in the plasma (m) and intestinal tissue (n) of control or ωMCA + HCA treated ABX mice (n = 6 per group). (o-r) GLP-1 response after olive oil gavage in the plasma (o) and intestinal tissue (p-r) of control or ωMCA + HCA treated ABX mice (n = 6/time point/group). Data are shown as mean ± SEM. *P < .05, **P < .01, vs. 0 min; ##P < .01, ###P < .001, vs. GF mice or control group. Statistical significance was determined by (a-c, h and i, m and n) unpaired Student’s t-test, (d-g, o-r) two-way ANOVA with the Dunnett’s posttest, or (j-l) one-way ANOVA with the Dunnett’s posttest. Abbreviations: ωMCA: ω-muricholic acid; HCA: hyocholic acid.
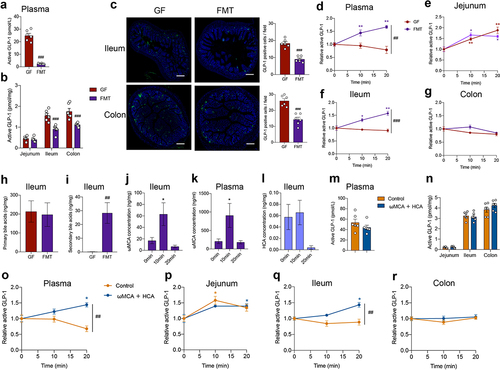
We further investigated whether bile acid treatment could restore the postprandial GLP-1 response in antibiotic-treated mice. In comparison with the control group, intragastric administration of ωMCA and HCA did not influence the fasting GLP-1 levels in the plasma and the intestinal tissue of ABX mice (). Expectedly, ωMCA and HCA treatment recovered the postprandial GLP-1 response in the plasma and ileum of ABX mice (), further supporting that bile acid-TGR5 signaling pathway was involved in the regulatory effects of gut microbiota on postprandial GLP-1 response.
Discussion
Gut microbiota interacts with intestinal enteroendocrine cells via a wide range of microbial metabolites to modulate gut hormone release, which further influences numerous essential metabolic processes, including glucose metabolism and body weight control. To date, no study has shown whether the gut microbiota affects the postprandial GLP-1 response in an acute physiological manner. In this study, we used ABX mice and GF mice to reveal that the gut microbiome is indispensable for maintaining postprandial GLP-1 response specifically in the ileum, which involves the endogenous bile acids (especially ωMCA and HCA) – TGR5 signaling pathway.
Studies have shown that fasting plasma GLP-1 levels are much higher in antibiotic-induced microbiome depletion miceCitation27 and GF mice.Citation26 However, elevated GLP-1 in GF mice does not improve glucose metabolism but slows intestinal transit, which might be an adaptive response to insufficient energy availability that allows for greater nutrient absorption.Citation26 This indicates that maintaining the normal GLP-1 level and its functional activity requires the presence of gut microbiota. In line with these studies, our study showed that gut microbiome depletion elevated fasting GLP-1 levels both in the plasma and in the distal intestinal tissue, which could be due to an increase in L-cell numbers. Moreover, we found that fasting GLP-1 level significantly increased as early as 48 h and 72 h of antibiotics treatment, indicating that the gut microbiota affects baseline GLP-1 levels in a quite rapid way. Regarding the possible mechanisms of basal GLP-1 elevation in the absence of gut microbiota, some previous studies have reported from different perspectives. Arora et al.Citation29 show that gut microbiota exerts major effects on ileal L-cells by suppressing vesicle localization and synaptic vesicle cycling, thus increases the number of densely packed vesicles in L-cells of GF mice. Zhao et al.Citation30 report that gut microbiome depletion relieves the inhibition of O-linked β-N-acetylglucosamine transferase on the expression of lineage-specifying transcription factor Neurogenin 3, which results in an increase in L-cell differentiation and GLP-1 secretion.
GLP-1 is released postprandially to regulate blood glucose levels and appetite. Various nutrients, including glucose,Citation12 lipids,Citation16 and amino acidsCitation31 can induce GLP-1 release. In a lipid tolerance test using olive oil gavage, we found for the first time that gut microbiome depletion completely eliminated the postprandial GLP-1 response in the plasma. We further studied how fast the gut microbiome depletion caused the loss of plasma GLP-1 response. Strikingly, the GLP-1 response to olive oil was diminished as early as 48 h and 72 h of antibiotics treatment. Taken together, these data indicate that the gut microbiome is indispensable for maintaining the postprandial GLP-1 response in mice. Regarding the changes in plasma GLP-1 in humans receiving antibiotics, in a randomized double-blind placebo-controlled trial including 57 obese and prediabetic men, the fasting and postprandial plasma GLP-1 level was not affected by amoxicillin or vancomycin treatment for 7 days.Citation32 While, in another study, eradication therapy with omeprazole, clarithromycin and amoxicillin for 2 months increased fasting and postprandial GLP-1 level in 40 Helicobacter pylori-positive patients.Citation33 These different results may arise from varied disease status or applied antibiotics. Future studies are warranted to clarify the essential effects of gut microbiome on postprandial GLP-1 response in humans.
Plasma GLP-1 is mainly derived from the secretion of intestinal enteroendocrine L-cells. We measured GLP-1 levels in the intestinal tissue segments to determine the key site where gut microbiota affects the postprandial GLP-1 response. Firstly, in the fasting state, GLP-1 content was much higher in the ileum and colon than in the jejunum, indicating the importance of the distal gut for GLP-1 secretion.Citation1,Citation8 Interestingly, we found that after olive oil gavage, GLP-1 level was promoted in the jejunum independent of the presence of gut microbiota, which indicated that the jejunal GLP-1 response to lipids may be caused by the direct interaction between fatty acids and jejunal L-cells.Citation13 In the colon, GLP-1 secretion did not respond to olive oil in all three groups of mice, which could be due to the fact that no nutrients or secretagogues reached the colon during the measured time period.Citation34 Most importantly, in the ileum, GLP-1 levels increased after olive oil gavage in SPF mice but lost the response in microbiome-depleted mice, which suggested that the ileum was the key site where gut microbiota modulated postprandial GLP-1 response. Grasset et al. shows that gut microbiota dysbiosis, especially in the ileum, causes GLP-1 resistance in type 2 diabetic mice.Citation35,Citation36 Using primary ileal cells and fresh ileal tissue segments, we found that depletion of gut microbiome did not affect the GLP-1 secretory function of ileal cells, which may not contribute to the loss of GLP-1 response in vivo, and other gut microbiota-derived metabolites may affect it.
When food is ingested (especially fat-rich meals), the gallbladder contracts immediately to release bile acids into the duodenum. Approximately 95% of bile acids are reabsorbed at the terminal ileum into the enterohepatic circulation.Citation37 Secondary bile acids are derived from primary bile acids through the modification carried out by gut microbiota.Citation38 Bile acids have been found to control a variety of physiological functions, including modulation of appetite and glycemia via the regulation of GLP-1 secretion.Citation39–42 Alterations in bile acid signaling are associated with many metabolic diseases, including type 2 diabetes and obesity.Citation39,Citation40 Previous studies have shown that secondary bile acids and primary unconjugated bile acids decreases while primary taurine-conjugated bile acids mainly TCA and TβMCA increases in the serum or small intestine of antibiotic-treated miceCitation27 and GF mice.Citation43 In our study, the ileal bile acid pool including the secondary bile acids and the primary unconjugated bile acids was largely reduced in the fasting state of ABX and GF mice, which was in line with the changes in the circulation of previous studies. We did not observe an increase of TCA and TβMCA in the ileum after microbiome depletion, which may be due to varied tested locations or antibiotic cocktails used between studies. Importantly, we observed an acute increase in secondary unconjugated bile acids at 10 min after olive oil gavage in the terminal ileum of SPF mice, supporting the rapid bile acid response to nutrients and essential roles of ileal bacteria in the metabolism of bile acids. Specifically, we found that the concentrations of ωMCA and HCA were elevated in the ileum and plasma of SPF mice after olive oil gavage, but not in the ileum of gut microbiome-depleted mice after olive oil gavage. We further demonstrated that both ωMCA and HCA stimulated GLP-1 secretion in vitro in primary ileal cells. ωMCA was a secondary bile acid that derived from gut microbiota, and the concentration of ωMCA was the highest among the secondary unconjugated bile acids in the small intestine and plasma of SPF mice, consistent with previous reports.Citation43 HCA was at a very low concentration. This indicates that ωMCA may be more important than HCA in mediating the postprandial GLP-1 response in SPF mice. More importantly, GF mice colonized with the fecal microbiota of SPF mice recovered fasting GLP-1 levels, postprandial GLP-1 responses, and ωMCA dynamics. Moreover, intragastric administration of ωMCA and HCA also restored postprandial GLP-1 response in antibiotic-treated mice. These results demonstrate that bile acid signaling is involved in the regulation of gut microbiota on the postprandial GLP-1 response.
Both the bile acid receptors TGR5Citation23 and FXRCitation24 are expressed in GLP-1 positive cells. Many studies have shown that activation of TGR5 stimulates GLP-1 secretion both in vivoCitation23 and in vitro.Citation44–46 Lund et al.Citation47 show that TGR5 participates in the facilitation of bile acids in L-cell differentiation and GLP-1 secretion in mouse and human intestinal organoids. Research conclusions on the regulatory effects of FXR on GLP-1 secretion are not consistent. Trabelsi et al.Citation24 show that FXR activation inhibits proglucagon gene expression and GLP-1 secretion. Recently, HCA is found to promote GLP-1 secretion by activating TGR5 and inhibiting FXR simultaneously.Citation48 In contrast, Pathak et al.Citation49 show that intestine-restricted FXR agonist fexaramine shapes the gut microbiota to produce more LCA, and thus activates TGR5-GLP-1 signaling to improve metabolism. In the present study, by using TGR5 or FXR KO mice, we found that TGR5 and FXR ablation did not affect basal GLP-1 level, while importantly, TGR5 but not FXR was involved in the modulation of postprandial GLP-1 response in the plasma and ileum. Our in vitro study in primary ileal cells also showed that activation of TGR5, but not FXR, stimulated GLP-1 release, and TGR5 also mediated ωMCA- and HCA-induced GLP-1 secretion. Therefore, it is likely that after a meal, bile acids are released into the small intestine, and reabsorbed in the distal ileum, where they can activate TGR5 in L-cells and promote GLP-1 secretion. Together, we uncovered the novel role of endogenous bile acid (ωMCA and HCA)-TGR5 signaling in mediating the postprandial GLP-1 response specifically in the ileum.
In conclusion, our results demonstrate that the gut microbiome is indispensable for postprandial GLP-1 response to lipids. The postprandial dynamics of endogenous bile acids (especially ωMCA and HCA) and the bile acid receptor TGR5 are essential for the acute GLP-1 response to lipids. More importantly, the ileum is the key site where gut microbiota-bile acid-TGR5 signaling modulates the postprandial GLP-1 response. Our findings help to better understand the complex mechanism underlying GLP-1 secretion in response to nutrients such as lipids in vivo and open the foundation for new therapeutic targets in the treatment for type 2 diabetes and obesity.
Materials and methods
Animals
Specific-pathogen-free (SPF) grade male or female C57BL/6J mice (8- to 10-week-old) were purchased from Jihui Company (Shanghai, China) and housed in a 12 h dark-light cycle room. Germ-free (GF) male C57BL/6J mice (8- to 10-week-old) were purchased from Cyagen Biosciences (Suzhou, China) and housed in sterile isolators. The Gpbar1 (also known as TGR5) global knock out (KO) mice were generated by Cyagen Biosciences (Guangzhou, China) using CRISPR-Cas9 technology. Nr1h4 (also known as FXR) KO mice were purchased from Jackson Laboratory (RRID: IMSR_JAX:004144; Bar Harbor, ME, USA) and maintained on a C57BL/6J background. All the mice were allowed free access to food and water. All experimental procedures were approved by the Animal Care Committee of the Shanghai Jiaotong University School of Medicine.
Antibiotics (ABX) treatment
The ABX cocktail, comprising vancomycin hydrochloride (250 mg/L), ampicillin (1 g/L), streptomycin sulfate (5 g/L), and colistin sulfate (1 g/L) (Meilunbio, China), was added to the drinking water of SPF mice for 24 h, 48 h, 72 h or 10 days to deplete the gut microbiome. The matched control SPF mice were administered normal water.
Fecal microbiota transplantation (FMT)
Feces for FMT were collected from conventionally raised 8-week-old C57BL/6J donor mice and stored in 20% glycerol at − 80°C until use. Fecal pellets (100 mg) were resuspended in 1 ml of sterile PBS, homogenized, settled, and the supernatant was collected. The germ-free recipient mice were intragastric administrated with 200 μL fecal solution for two consecutive days and housed in a sterile isolator for two weeks.
Lipid tolerance test
Mice were fasted for 16 h with free access to water. Afterwards, each mouse was orally gavaged with 200 µl of olive oil. Mice were sacrificed at specified time points, including before lipid infusion (0 min) and 10 min, 20 min, 30 min, and 60 min thereafter. The jejunum (12 cm from the pylorus), terminal ileum, and proximal colon were collected and stored at −80°C. Blood samples were collected in ethylenediaminetetraacetic acid (EDTA)-coated capillary microvette tubes. Dipeptidyl Peptidase IV (DPPIV) inhibitor (EMD Millipore, USA) was added to the blood (1% (v/v)) to reduce GLP-1 degradation. Plasma was isolated by centrifugation at 3000 g for 10 min at 4°C and stored at −80°C until hormone analysis.
Bile acid treatment
SPF mice were treated with antibiotics for 10 days. Afterwards, antibiotics were withdrawn. 50 mg/kg ωMCA and HCA were orally gavaged once a day for 4 days, followed by another gavage right before the fasting in the afternoon on the 4th day. PBS gavage was as a control group. Lipid tolerance tests were performed to collect blood samples and the intestinal tissues for GLP-1 measurement.
Primary intestinal epithelial cultures
Intestinal epithelial cells were isolated as previously described.Citation50 Fresh ileum tissue (distal part, 5 cm length) was dissected free of connective tissue, minced, rinsed with cold PBS, and digested with collagenase XI (0.35 mg/ml, Millipore Sigma, USA) in DMEM at 37°C. The resulting cell suspensions were centrifuged, filtered (100 µM) and resuspended in DMEM supplemented with 10% fetal bovine serum, 1% penicillin and streptomycin, and 10 µM Y-27632 (Tocris Biosciences). Cell aliquots were seeded on matrigel (1.4% (v/v), Corning)-coated 96-well plates. After 24 h incubation at 37°C, cells reached at least 60% confluence and were incubated for 2 h in saline solution (4.5 mM KCl, 138 mM NaCl, 4.2 mM NaHCO3, 1.2 mM NaH2PO4, 2.6 mM CaCl2, 1.2 mM MgCl2, 10 mM glucose, and 10 mM Hepes, pH 7.4) supplemented with 1 mM sodium palmitate (Millipore Sigma, USA), 200 mM glucose, 30–100 µM bile acids (Meilunbio, China), or 1–10 µM TGR5/FXR agonists (Absin, China). 10 µM IBMX/forskolin was used as the positive control. Stock solutions were prepared in ethanol (sodium palmitate), or in DMSO (IBMX/forskolin, ωMCA, HCA and TGR5/FXR agonists). The maximum ethanol and DMSO concentration of the final treatment solutions was 0.2% and 0.1%, respectively. A 1% (v/v) DPPIV inhibitor was added to reduce GLP-1 degradation. The culture supernatants were collected to measure GLP-1 levels, and the cells were lysed to determine the protein level per well.
Fresh ileal tissue segments
Overnight fasted SPF and ABX mice were sacrificed, and the fresh ileum (distal part, 5 cm length) was longitudinally cut open. Ileal segments (0.5 × 1 cm) were dissected and incubated at 37°C for 2 h with GLP-1 secretagogues as mentioned in primary ileal cells.Citation51 To avoid the impact of ileal segment location, the position of tissue segments applied in each treatment group was the same in SPF mice and ABX mice. A 1% (v/v) DPPIV inhibitor was added to reduce GLP-1 degradation. The culture supernatants were collected to measure GLP-1 levels, and the tissue segments were lysed to determine the protein level per well.
Hormone measurement
The intestinal tissue segments (0.5 cm length) were homogenized, lysed (1 M Tris-HCl, 5 M NaCl, 1% (v/v) Igepal CA-630, 0.5% (w/v) sodium deoxycholate monohydrate, and one tablet of EDTA-free protease inhibitor cocktail), and centrifuged to prepare the tissue extracts. GLP-1 levels in the plasma, cell culture supernatants, and tissue extracts were measured using an active GLP-1 (7–36 and 7–37; EGLP-35K) or total GLP-1 (7–36 and 9–36; EZGLP1T-36K) ELISA kit (EMD Millipore, USA). The quantification of GLP-1 levels in cell culture supernatants and tissue extracts was normalized to the protein levels of cell or tissue lysates, which were determined using the Pierce BCA Protein Assay Kit (Thermo Fisher Scientific, USA). Other hormones, including peptide YY (PYY), ghrelin, insulin, and C-peptide, were measured using a mouse metabolic hormone expanded panel kit (EMD Millipore, USA).
Bile acids quantification
Bile acid concentration in plasma and tissues was quantified using ultra-high-performance liquid chromatography-tandem mass spectrometry (UHPLC-MS/MS). 30 μl plasma was mixed with 20 μl internal standard and 150 μl of acetonitrile. The mixture was centrifuged, evaporated, and reconstituted in 40 μl of 50% methanol. We resected the ileum tissue (distal part, 3 cm length) and flushed out the luminal content. The tissue was then weighed, mixed with 20 μl/mg of methanol, homogenized, centrifuged, evaporated, and reconstituted in 100 μL of 50% methanol supplemented with an internal standard. The internal standards including deuterium-labeled CA-d4, CDCA-d4, LCA-d4 and GCA-d4 were purchased from Steraloids Inc (Newport, RI, USA). TCA-d4, TβMCA-d4 and TUDCA-d4 were obtained from Toronto Research Chemicals (North York, Ontario, Canada). βMCA-d4 was obtained from IsoSciences (Ambler, PA, USA). GCDCA-d4, DCA-d4, TDCA-d4, GDCA-d4, GLCA-d4, GUDCA-d4, and UDCA-d4 were the products of Cambridge Isotope Laboratories Inc (Tewksbury, MA, USA). The quality control sample was obtained by pooling all prepared samples. UHPLC-MS/MS analysis was performed on an Agilent 1290 Infinity II UHPLC system coupled to a 6470A Triple Quadrupole mass spectrometer (Santa Clara, CA, United States). Samples were injected into a Waters UPLC BEH C18 column (100 mm × 2.1 mm, 1.7 μm) at a flow rate of 0.4 ml/min. The mobile phase A was 0.1% (v/v) formic acid/water. The mobile phase B was 0.1% (v/v) formic acid/acetonitrile. The chromatographic separation was conducted by a gradient elution program as follows: 15% B at 0.5 min, 25% B at 1.5 min, 25% B at 5.5 min, 35% B at 6.5 min, 38% B at 9.5 min, 45% B at 10.5 min, 60% B at 13 min, 100% B at 13.1 min, 100%B at 14.4 min, 15% B at 14.5 min, 15% B at 16 min. The column temperature was set to 40°C. MassHunter Workstation Software (version B.08.00, Agilent) was used to process raw data.
RNA extraction and real-time PCR
Total RNA was extracted from frozen intestinal tissue using the EastepTM Super Total RNA Extraction Kit (Promega Biotech Co., China) and reverse transcribed to cDNA using PrimeScript Reverse Transcript Master Mix (TaKaRa, Japan). Real-time quantitative PCR was performed using Applied Biosystems QuantStudioDx (Thermo Fisher Scientific, USA) with the universal SYBR Green qPCR Master Mix (Vazyme Biotech, China). The following primers were used: 18S, forward TTCTGGCCAACGGTCTAGACAAC, reverse CCAGTGGTCTTGGTGTGCA; GPR120, forward GGCACTGCTGGCTTTCATA, reverse GATTTCTCCTATGCGGTTGG; SCLT1, forward CGGAAGAAGGCATCTGAGAA, reverse AATCAGCACGAGGATGAACA; TGR5, forward ACCATCAGGGCTACTGGTCC, reverse GCCATGTAGCGTTCCCCAT; FXR, forward TGGGCTCCGAATCCTCTTAGA, reverse TGGTCCTCAAATAAGATCCTTGG. All the samples were run in duplicate in a 384-well reaction plate. The comparative ∆∆CT method was used to evaluate the relative mRNA levels of the housekeeping gene 18S.
Immunofluorescence studies
Intestinal tissue was fixed with 4% (w/v) paraformaldehyde and embedded in paraffin. Tissue sections (5 μm) underwent antigen retrieval (1 mM Tris-EDTA PH9.0, for 15 min at 100°C), followed by preincubation with BSA blocking solution for 20 min. Slides were incubated overnight at 4°C with 100 μl mouse anti-GLP-1 primary antibody (1:800; ab23468, Abcam). Slides were then washed and incubated with 100 μl of Try-488 secondary antibody (Bry-try488, Runnerbio, China) for 30 min at 37°C. Cover slips were mounted with Antifade Mounting Medium containing DAPI (P0131, Beyotime, China), and images were taken using an automated acquisition system (TissueFAXS Plus, TissueGnostics GmbH, Austria).
Statistical analysis
The results are presented as the mean ± SEM. Differences between the two groups were analyzed using an unpaired Student’s t-test. Differences between three or more groups were analyzed using one-way ANOVA, followed by Dunnett’s multiple comparison test. Two-way ANOVA post-hoc corrections were performed to assess the interaction effect between the two factors. GraphPad Prism 8 software was used for all the statistical analyses. Statistical significance was accepted at P value < .05. Each experiment was repeated independently at least twice or thrice.
Author contributions
Conceptualization, R.X.L.; Supervision, R.X.L., G.N., J.Q.W.; Methodology, Q.L.W. and H.B.L.; Investigation, Q.L.W., H.B.L., C.R.S., M.C.Z., X.Y.W., M.M.Y., M.Y.Y., S.J., Z.W.C., C.W., B.R.C., A.B.G., Y.F.B., W.Q.W.; Writing, Q.L.W. and R.X.L.; Funding acquisition, G.N., R.X.L., J.Q.W., Q.L.W. All authors read and approved the final manuscript.
Supplemental Material
Download MS Word (5.6 MB)Acknowledgments
The authors thank Dongqin Gu, Yansong Liu, and Qingna Meng for their technical assistance. We thank Dr. Chi-chung Hui for his contribution to the data discussions.
Disclosure statement
No potential conflict of interest was reported by the author(s).
Data availability statement
The authors confirm that the data supporting the findings of this study are available within the article and its supplementary materials.
Supplementary material
Supplemental data for this article can be accessed online at https://doi.org/10.1080/19490976.2023.2274124.
Additional information
Funding
References
- Drucker DJ. The biology of incretin hormones. Cell Metab. 2006;3(3):153–16. doi:10.1016/j.cmet.2006.01.004.
- Finan B, Ma T, Ottaway N, Muller TD, Habegger KM, Heppner KM, Kirchner H, Holland J, Hembree J, Raver C, et al. Unimolecular dual incretins maximize metabolic benefits in rodents, monkeys, and humans. Sci Transl Med. 2013;5(209):209ra151. doi:10.1126/scitranslmed.3007218.
- Finan B, Yang B, Ottaway N, Smiley DL, Ma T, Clemmensen C, Chabenne J, Zhang L, Habegger KM, Fischer K, et al. A rationally designed monomeric peptide triagonist corrects obesity and diabetes in rodents. Nat Med. 2015;21(1):27–36. doi:10.1038/nm.3761.
- Herrmann C, Goke R, Richter G, Fehmann HC, Arnold R, Goke B. Glucagon-like peptide-1 and glucose-dependent insulin-releasing polypeptide plasma levels in response to nutrients. Digestion. 1995;56(2):117–126. doi:10.1159/000201231.
- Chia CW, Egan JM. Incretins in obesity and diabetes. Ann N Y Acad Sci. 2020;1461(1):104–126. doi:10.1111/nyas.14211.
- Bryant MG, Bloom SR, Polak JM, Hobbs S, Domschke W, Domschke S, Mitznegg P, Ruppin H, Demling L. Measurement of gut hormonal peptides in biopsies from human stomach and proximal small intestine. Gut. 1983;24(2):114–119. doi:10.1136/gut.24.2.114.
- Muller TD, Finan B, Bloom SR, D’Alessio D, Drucker DJ, Flatt PR, Fritsche A, Gribble F, Grill HJ, Habener JF, et al. Glucagon-like peptide 1 (GLP-1). Mol Metab. 2019;30:72–130. doi:10.1016/j.molmet.2019.09.010.
- Eissele R, Goke R, Willemer S, Harthus HP, Vermeer H, Arnold R, Göke B. Glucagon-like peptide-1 cells in the gastrointestinal tract and pancreas of rat, pig and man. Eur J Clin Invest. 1992;22(4):283–291. doi:10.1111/j.1365-2362.1992.tb01464.x.
- Toft-Nielson M, Madsbad S, Holst JJ. The effect of glucagon-like peptide I (GLP-I) on glucose elimination in healthy subjects depends on the pancreatic glucoregulatory hormones. Diabetes. 1996;45(5):552–556. doi:10.2337/diab.45.5.552.
- Vilsboll T, Krarup T, Sonne J, Madsbad S, Volund A, Juul AG, Holst JJ. Incretin secretion in relation to meal size and body weight in healthy subjects and people with type 1 and type 2 diabetes mellitus. J Clin Endocrinol Metab. 2003;88(6):2706–2713. doi:10.1210/jc.2002-021873.
- Nakajima S, Hira T, Hara H. Postprandial glucagon-like peptide-1 secretion is increased during the progression of glucose intolerance and obesity in high-fat/high-sucrose diet-fed rats. Br J Nutr. 2015;113(9):1477–1488. doi:10.1017/S0007114515000550.
- Gribble FM, Williams L, Simpson AK, Reimann F. A novel glucose-sensing mechanism contributing to glucagon-like peptide-1 secretion from the GLUTag cell line. Diabetes. 2003;52(5):1147–1154. doi:10.2337/diabetes.52.5.1147.
- Hirasawa A, Tsumaya K, Awaji T, Katsuma S, Adachi T, Yamada M, Sugimoto Y, Miyazaki S, Tsujimoto G. Free fatty acids regulate gut incretin glucagon-like peptide-1 secretion through GPR120. Nat Med. 2005;11(1):90–94. doi:10.1038/nm1168.
- Mochida T, Hira T, Hara H. The corn protein, zein hydrolysate, administered into the ileum attenuates hyperglycemia via its dual action on glucagon-like peptide-1 secretion and dipeptidyl peptidase-IV activity in rats. Endocrinology. 2010;151(7):3095–3104. doi:10.1210/en.2009-1510.
- Reimann F, Williams L, da Silva Xavier G, Rutter GA, Gribble FM. Glutamine potently stimulates glucagon-like peptide-1 secretion from GLUTag cells. Diabetologia. 2004;47(9):1592–1601. doi:10.1007/s00125-004-1498-0.
- Panaro BL, Yusta B, Matthews D, Koehler JA, Song Y, Sandoval DA, Drucker DJ. Intestine-selective reduction of gcg expression reveals the importance of the distal gut for GLP-1 secretion. Mol Metab. 2020;37:100990. doi:10.1016/j.molmet.2020.100990.
- Canfora EE, Meex RCR, Venema K, Blaak EE. Gut microbial metabolites in obesity, NAFLD and T2DM. Nat Rev Endocrinol. 2019;15(5):261–273. doi:10.1038/s41574-019-0156-z.
- Liu R, Hong J, Xu X, Feng Q, Zhang D, Gu Y, Shi J, Zhao S, Liu W, Wang X, et al. Gut microbiome and serum metabolome alterations in obesity and after weight-loss intervention. Nat Med. 2017;23(7):859–868. doi:10.1038/nm.4358.
- Greiner TU, Backhed F. Microbial regulation of GLP-1 and L-cell biology. Mol Metab. 2016;5(9):753–758. doi:10.1016/j.molmet.2016.05.012.
- Di Ciaula A, Garruti G, Lunardi Baccetto R, Molina-Molina E, Bonfrate L, Wang DQ, Portincasa P. Bile acid physiology. Ann Hepatol. 2017;16:s4–s14. doi:10.5604/01.3001.0010.5493.
- Funabashi M, Grove TL, Wang M, Varma Y, McFadden ME, Brown LC, Guo C, Higginbottom S, Almo SC, Fischbach MA, et al. A metabolic pathway for bile acid dehydroxylation by the gut microbiome. Nature. 2020;582(7813):566–570. doi:10.1038/s41586-020-2396-4.
- Thomas C, Gioiello A, Noriega L, Strehle A, Oury J, Rizzo G, Macchiarulo A, Yamamoto H, Mataki C, Pruzanski M, et al. TGR5-mediated bile acid sensing controls glucose homeostasis. Cell Metab. 2009;10(3):167–177. doi:10.1016/j.cmet.2009.08.001.
- Kuhre RE, Wewer Albrechtsen NJ, Larsen O, Jepsen SL, Balk-Moller E, Andersen DB, Deacon CF, Schoonjans K, Reimann F, Gribble FM, et al. Bile acids are important direct and indirect regulators of the secretion of appetite- and metabolism-regulating hormones from the gut and pancreas. Mol Metab. 2018;11:84–95. doi:10.1016/j.molmet.2018.03.007.
- Trabelsi MS, Daoudi M, Prawitt J, Ducastel S, Touche V, Sayin SI, Perino A, Brighton CA, Sebti Y, Kluza J, et al. Farnesoid X receptor inhibits glucagon-like peptide-1 production by enteroendocrine L cells. Nat Commun. 2015;6(1):7629. doi:10.1038/ncomms8629.
- Li K, Zou J, Li S, Guo J, Shi W, Wang B, Han X, Zhang H, Zhang P, Miao Z, et al. Farnesoid X receptor contributes to body weight-independent improvements in glycemic control after roux-en-Y gastric bypass surgery in diet-induced obese mice. Mol Metab. 2020;37:100980. doi:10.1016/j.molmet.2020.100980.
- Wichmann A, Allahyar A, Greiner TU, Plovier H, Lunden GO, Larsson T, Drucker D, Delzenne N, Cani P, Bäckhed F, et al. Microbial modulation of energy availability in the colon regulates intestinal transit. Cell Host & Microbe. 2013;14(5):582–590. doi:10.1016/j.chom.2013.09.012.
- Zarrinpar A, Chaix A, Xu ZZ, Chang MW, Marotz CA, Saghatelian A, Knight R, Panda S. Antibiotic-induced microbiome depletion alters metabolic homeostasis by affecting gut signaling and colonic metabolism. Nat Commun. 2018;9(1):2872. doi:10.1038/s41467-018-05336-9.
- Gorboulev V, Schurmann A, Vallon V, Kipp H, Jaschke A, Klessen D, Friedrich A, Scherneck S, Rieg T, Cunard R, et al. Na+- d -glucose cotransporter SGLT1 is pivotal for intestinal glucose absorption and glucose-dependent incretin secretion. Diabetes. 2012;61(1):187–196. doi:10.2337/db11-1029.
- Arora T, Akrami R, Pais R, Bergqvist L, Johansson BR, Schwartz TW, Reimann F, Gribble FM, Bäckhed F. Microbial regulation of the L cell transcriptome. Sci Rep. 2018;8(1):1207. doi:10.1038/s41598-017-18079-2.
- Zhao M, Ren K, Xiong X, Cheng M, Zhang Z, Huang Z, Han X, Yang X, Alejandro EU, Ruan H-B, et al. Protein O-GlcNAc modification links dietary and gut microbial cues to the differentiation of enteroendocrine L cells. Cell Rep. 2020;32(6):108013. doi:10.1016/j.celrep.2020.108013.
- Alamshah A, McGavigan AK, Spreckley E, Kinsey-Jones JS, Amin A, Tough IR, O’Hara HC, Moolla A, Banks K, France R, et al. L-arginine promotes gut hormone release and reduces food intake in rodents. Diabetes Obes Metab. 2016;18(5):508–518. doi:10.1111/dom.12644.
- Reijnders D, Goossens GH, Hermes GD, Neis EP, van der Beek CM, Most J, Holst J, Lenaerts K, Kootte R, Nieuwdorp M, et al. Effects of gut microbiota manipulation by antibiotics on host metabolism in obese humans: a randomized Double-blind placebo-controlled trial. Cell Metab. 2016;24(1):63–74. doi:10.1016/j.cmet.2016.06.016.
- Cornejo-Pareja I, Martin-Nunez GM, Roca-Rodriguez MM, Cardona F, Coin-Araguez L, Sanchez-Alcoholado L, Gutiérrez-Repiso C, Muñoz-Garach A, Fernández-García J, Moreno-Indias I, et al. H. pylori eradication treatment alters gut microbiota and GLP-1 secretion in humans. J Clin Med. 2019;8(4):451. doi:10.3390/jcm8040451.
- Goodman BE. Insights into digestion and absorption of major nutrients in humans. Adv Physiol Educ. 2010;34(2):44–53. doi:10.1152/advan.00094.2009.
- Grasset E, Puel A, Charpentier J, Collet X, Christensen JE, Terce F, Burcelin R. A specific gut microbiota dysbiosis of type 2 diabetic mice Induces GLP-1 resistance through an enteric NO-Dependent and gut-brain axis mechanism. Cell Metab. 2017;25(5):1075–90 e5. doi:10.1016/j.cmet.2017.04.013.
- Grasset E, Puel A, Charpentier J, Klopp P, Christensen JE, Lelouvier B, Servant F, Blasco-Baque V, Tercé F, Burcelin R, et al. Gut microbiota dysbiosis of type 2 diabetic mice impairs the intestinal daily rhythms of GLP-1 sensitivity. Acta Diabetol. 2022;59(2):243–258. doi:10.1007/s00592-021-01790-y.
- Xie C, Huang W, Young RL, Jones KL, Horowitz M, Rayner CK, Wu T. Role of bile acids in the regulation of food intake, and their Dysregulation in metabolic disease. Nutrients. 2021;13(4):1104. doi:10.3390/nu13041104.
- Agus A, Clement K, Sokol H. Gut microbiota-derived metabolites as central regulators in metabolic disorders. Gut. 2021;70(6):1174–1182. doi:10.1136/gutjnl-2020-323071.
- Perino A, Schoonjans K. Metabolic messengers: bile acids. Nat Metab. 2022;4(4):416–423. doi:10.1038/s42255-022-00559-z.
- Cai J, Sun L, Gonzalez FJ. Gut microbiota-derived bile acids in intestinal immunity, inflammation, and tumorigenesis. Cell Host Microbe. 2022;30(3):289–300. doi:10.1016/j.chom.2022.02.004.
- Han H, Yi B, Zhong R, Wang M, Zhang S, Ma J, Yin Y, Yin J, Chen L, Zhang H, et al. From gut microbiota to host appetite: gut microbiota-derived metabolites as key regulators. Microbiome. 2021;9(1):162. doi:10.1186/s40168-021-01093-y.
- Molinaro A, Wahlstrom A, Marschall HU. Role of bile acids in metabolic control. Trends Endocrinol Metab. 2018;29(1):31–41. doi:10.1016/j.tem.2017.11.002.
- Sayin SI, Wahlstrom A, Felin J, Jantti S, Marschall HU, Bamberg K, Angelin B, Hyötyläinen T, Orešič M, Bäckhed F, et al. Gut microbiota regulates bile acid metabolism by reducing the levels of tauro-beta-muricholic acid, a naturally occurring FXR antagonist. Cell Metab. 2013;17(2):225–235. doi:10.1016/j.cmet.2013.01.003.
- Katsuma S, Hirasawa A, Tsujimoto G. Bile acids promote glucagon-like peptide-1 secretion through TGR5 in a murine enteroendocrine cell line STC-1. Biochem Biophys Res Commun. 2005;329(1):386–390. doi:10.1016/j.bbrc.2005.01.139.
- Parker HE, Wallis K, le Roux CW, Wong KY, Reimann F, Gribble FM. Molecular mechanisms underlying bile acid-stimulated glucagon-like peptide-1 secretion. Br J Pharmacol. 2012;165(2):414–423. doi:10.1111/j.1476-5381.2011.01561.x.
- Brighton CA, Rievaj J, Kuhre RE, Glass LL, Schoonjans K, Holst JJ, Gribble FM, Reimann F. Bile acids trigger GLP-1 release predominantly by accessing basolaterally located G protein–coupled bile acid receptors. Endocrinology. 2015;156(11):3961–3970. doi:10.1210/en.2015-1321.
- Lund ML, Sorrentino G, Egerod KL, Kroone C, Mortensen B, Knop FK, Reimann F, Gribble FM, Drucker DJ, de Koning EJP, et al. L-Cell differentiation is induced by bile acids through GPBAR1 and Paracrine GLP-1 and serotonin signaling. Diabetes. 2020;69(4):614–623. doi:10.2337/db19-0764.
- Zheng X, Chen T, Jiang R, Zhao A, Wu Q, Kuang J, Sun D, Ren Z, Li M, Zhao M, et al. Hyocholic acid species improve glucose homeostasis through a distinct TGR5 and FXR signaling mechanism. Cell Metab. 2021;33(4):791–803 e7. doi:10.1016/j.cmet.2020.11.017.
- Pathak P, Xie C, Nichols RG, Ferrell JM, Boehme S, Krausz KW, Patterson AD, Gonzalez FJ, Chiang JYL. Intestine farnesoid X receptor agonist and the gut microbiota activate G-protein bile acid receptor-1 signaling to improve metabolism. Hepatology. 2018;68(4):1574–1588. doi:10.1002/hep.29857.
- Liszt KI, Wang Q, Farhadipour M, Segers A, Thijs T, Nys L, Deleus E, Van der Schueren B, Gerner C, Neuditschko B, et al. Human intestinal bitter taste receptors regulate innate immune responses and metabolic regulators in obesity. J Clin Invest. 2022;132(3):132. doi:10.1172/JCI144828.
- Wang Q, Liszt KI, Deloose E, Canovai E, Thijs T, Farre R, Ceulemans LJ, Lannoo M, Tack J, Depoortere I, et al. Obesity alters adrenergic and chemosensory signaling pathways that regulate ghrelin secretion in the human gut. FASEB J. 2019;33(4):4907–4920. doi:10.1096/fj.201801661RR.