
ABSTRACT
Dietary fiber plays a crucial role in maintaining gut and overall health. The objective of this study was to investigate whether different types of dietary fiber elicited specific changes in gut microbiota composition and the production of short-chain fatty acids. To test this, a longitudinal crossover study design was employed, in which healthy adult women consumed three distinct dietary fiber supplements: Inulin (fructo-oligosaccharide), Vitafiber (isomalto-oligosaccharide), and Fibremax (mixture of different fiber) during a one-week intervention period, followed by a 2-week washout period. A total of 15 g of soluble fiber was consumed daily for each supplement. Samples were collected before and after each intervention to analyze the composition of the gut microbiota by 16S rRNA sequencing and fecal levels of short-chain fatty acids measured using nuclear magnetic resonance. Phenotypic changes in peripheral blood mononuclear cells were studied in subsets of participants with higher SCFA levels post-intervention using spectral flow cytometry. The results revealed substantial stability and resilience of the overall gut bacterial community toward fiber-induced changes. However, each supplement had specific effects on gut bacterial alpha and beta diversity, SCFA production, and immune changes. Inulin consistently exerted the most pronounced effect across individuals and certain taxa were identified as potential indicators of SCFA production in response to inulin supplementation. This distinguishing feature was not observed for the other fiber supplements. Further large-scale studies are required to confirm these findings. Overall, our study implies that personalized dietary fiber intervention could be tailored to promote the growth of beneficial bacteria to maximize SCFA production and associated health benefits.
Introduction
Over the past few decades, the prevalence of non-communicable diseases in Western societies has risen dramatically. Environmental exposures, specifically the consumption of a diet low in dietary fiber is accepted as a significant risk factor. Low dietary fiber intake is associated with increased risk of all-cause mortality in humans,Citation1,Citation2 while preclinical studies have demonstrated that high dietary fiber intake protected against colitis, asthma, food allergies, arthritis, experimental autoimmune encephalitis, colorectal cancer, type 1 diabetes, and influenza infection.Citation3–10 Consequently, the potential of fiber supplements to be utilized for disease prevention and/or intervention is an attractive strategy.Citation11
Dietary fiber is a loosely defined term that refers to complex carbohydrates that are resistant to host digestion. Dietary fiber is utilized by gut bacteria as an energy source, and as prebiotics, they promote the growth of beneficial bacteria such as Bifidobacteria and Lactobacilli. The fermentation of dietary fiber by gut bacteria leads to the release of metabolites as by-products, particularly the short-chain fatty acids (SCFA) acetate, propionate, and butyrate.Citation12 Butyrate is the major source of energy for colonocytes and maintains an anaerobic environment optimal for the survival of beneficial bacteria in the lumen.Citation13 Butyrate and propionate are mostly metabolized in the liver, whereas acetate reaches the circulation and can exert systemic effects.Citation12 There is considerable evidence from preclinical and clinical studies that SCFA support many of the health benefits of dietary fiber on the host. For example, daily treatment with propionate restored immune balance in multiple sclerosis patients and reduced their clinical symptoms,Citation14 and acetate and butyrate have been shown to lower blood pressure in hypertensive patients.Citation15
Furthermore, detrimental changes in gut microbiota composition, or dysbiosis, have been reported in most non-communicable diseases. Although direct causality between dysbiosis and disease is yet to be established, preclinical models have confirmed that changes in gut microbiota composition can contribute to the development of these diseases. Mice recolonized with dysbiotic microbiota isolated from patients’ stool develop exacerbated disease in models of allergies, autoimmunity, and during cancer therapyCitation16–18. Thus, restoring gut microbiota composition and function, particularly by supporting optimal SCFA production through dietary fiber consumption, offers an attractive therapeutic approach.
There are conflicting results from clinical trials testing the impact of the dietary fiber supplement inulin and/or fructo-oligosaccharide on disease with either improvement or no effects.Citation19–23 The reasons why certain individuals do not respond to inulin are unknown but is likely due to differences in their gut microbiota composition.Citation24–26 Dietary fiber is composed of structurally diverse classes of polysaccharides, varying in their monosaccharide composition and chemical bondsCitation27. As such, the repertoire of enzymes needed to break down these polysaccharides, such as carbohydrate-active enzymes, can differ widely between types of fiber. These carbohydrate-degrading enzymes are broadly dispersed across microbial strains.Citation28 Hence, gut microbiota comprising distinct collections of strains will exhibit different responses to a given type of fiber due to differences in the enzymes they collectively possess. This was highlighted in a study by Kovatcheva-Datchary et al., which showed that the consumption of bread enriched in dietary fiber improved postprandial glucose metabolism only in participants with a microbiota characterized by an elevated Prevotella/Bacteroides ratio.Citation29 A landmark study demonstrated that individuals’ specific postprandial blood glucose responses to varying foods could be predicted by their preexisting gut microbial communities.Citation30 These studies raise the possibility of personalized nutrition, such as offering individuals tailored dietary fiber interventions to yield maximal SCFA production.
In this study, we examined individual responses to three different dietary fiber supplements and tested the hypothesis that an individual’s SCFA profile in response to a given dietary fiber can be predicted based on their gut microbiota composition. This was achieved through a cross-over intervention study to test the response of given individuals to the three different fiber supplements. We showed that although the gut microbiota was largely unchanged, there were supplement-specific effect between longitudinal samples of individuals on specific bacterial taxa, SCFA production, and the immune system. We also identified taxa that may be predictive of an individual’s likelihood of responding to inulin supplementation; however, a larger-scale study is required to confirm our findings.
Results
Impact of different fibre supplements on clinical characteristics in healthy women
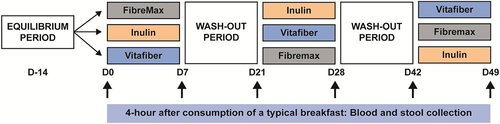
Thirty-four healthy females were recruited for a crossover study, with all participants asked to intake three different fiber supplements for a period of 1 week per supplement, with a 2-week washout period between supplements (). The three commercially available fiber supplement products used were Inulin (100% fructo-oligosaccharide), Vitafiber (100% Isomalto-oligosaccharide; IMO), and Fibremax (a mix of soluble and insoluble fiber consisting of chicory root extract, psyllium husk, soy fiber, oat bran and pectin). We chose structurally distinct dietary fibers: Inulin is a polymer of fructose with β-(2,1) glycosidic bonds and Vitafiber a polymer of glucose with α-D-(1,6)-linkages and Fibremax which contains a diverse mix of dietary fiber. These dietary fibers are commonly used in the food industry and as supplements,Citation31 and inulin (including FOS) are approved by FDA as a dietary fiberCitation32 and have been used in clinical trials to tests its effect on various conditions such as obesity and asthma.Citation19,Citation33
Figure 1. Cross-over study design in which the participants were asked to consume one of three dietary fiber supplements (Fibremax, Inulin or Vitafiber) daily for 1 week, with a two-week washout period between supplements. Prior to each dietary fiber intervention, and throughout the study, participants were asked to consume a standardized diet which excludes fiber-rich foods including beans, high-fiber cereals and bars, dietary supplements and antibiotics. Before and after each intervention, stool and blood were collected 4 hours following the consumption of a typical breakfast.
Of those enrolled, 28 participants completed the study. The median age at screening interview was 37 (IQR 15.25) years and BMI was 22.1 (IQR 4.1) kg/m2 (). Reasons for withdrawing from the study included pregnancy (n = 1), intolerance to supplements (n = 2), inability to attend clinical assessments due to injury (n = 1), or lack of time (n = 2). Overall compliance with fiber supplementation was 93.1% for Fibremax, 96% for Inulin, and 95.6% for Vitafiber (calculated as the number of doses reported/total number of doses prescribed for each supplement). Self-reported symptoms in response to each supplement (bloating or gas) during the 7-day of intervention was 54.5% for Fibremax, 48% for Inulin and 25% for Vitafiber. There was one report of diarrhea for both Fibremax and Inulin but none for Vitafiber. Baseline and intervention dietary fiber (excluding supplements), energy, protein, fat, and carbohydrate intakes were similar across all groups (Table S1).
Table 1. Baseline characteristics of participants who completed the study and for those used in downstream microbiota analysis. Data represented as median (IQR).
Body weight, waist and hip circumference, waist-to-hip ratio, and systolic and diastolic blood pressure were measured before and after each dietary fiber intervention (). There was no major impact on all measured clinical characteristics, although waist circumference was significantly increased with the supplement Fibremax (median +1.0 cm [IQR −0.5 to 2.13], p =.014) and decreased with the supplement Vitafiber (median −0.5 cm [IQR −2.13 to 1.5], p =.024). After Inulin supplementation, we observed an increase in hip circumference (median +1.0 cm [IQR −1 to 2], p =.012) while Vitafiber supplementation increased diastolic blood pressure (median +2.5 mmHg [IQR −0.63 to 6.5], p =.017).
Table 2. Change in characteristics following intervention.
Gut microbiota alteration in response to fibre supplements is constrained by individual characteristics
We assessed whether the 1-week intervention with the three fiber supplements had a discernible impact on gut microbial communities. To do this, we performed 16S rRNA sequencing from pre- and post-intervention stool samples from participants in which stool samples were collected from all time points (n = 24 out of 28 and baseline characteristics from this cohort is presented in ). Sequencing output generated sufficient reads from each sample to capture all amplicon sequence variants (ASV) (Fig. S1A), and no significant differences in reads per sample between fiber supplements, either pre- or post-intervention, were observed (Fig. S1B).
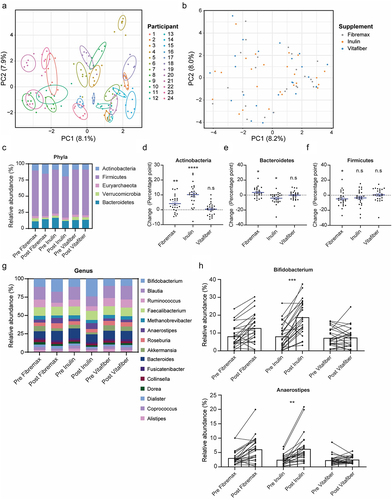
A global analysis of all samples by non-supervised clustering of principal component analysis (PCA) of Aitchison’s distance revealed that the principal driver of microbiota composition variation was the individual participant (). No evidence of a generic response to fiber was found, with no significant clustering of post-supplement gut microbiota composition (). Similarly, there was no significant clustering between pre- and post-supplementation microbiota for any of the three supplements (Fig. S1C). Altogether, one week of dietary fiber supplementation, regardless of the type of supplement, did not alter the overall gut microbiota composition to become significantly more similar.
Figure 2. Stools were collected before and one-week following the consumption of either Fibremax, Inulin or Vitafiber and 16S rRNA gene sequencing was performed to analyze gut microbiota composition. (a) differences in the overall microbiota communities of all participants and timepoints were analyzed by principal component analysis (PCA) of Aitchison’s distance. Colour represents unique individuals, and each cluster of individuals were statistically significantly (p <.001) from all other cluster of individuals as determined by Kolmogorov Smirnov test of within vs. between cluster distributions of Aitchison distance. (b) differences in the overall microbiota communities of post-intervention samples were analyzed by principal component analysis (PCA) of Aitchison’s distance. Colour represents fiber supplements, and overall post-microbiome supplement were not significantly different between groups as determined by PERMANOVA (Inulin vs. Vitafiber p > 0.99; Inulin vs. Fibremax p > .99; Vitafiber vs. Fibremax p =.9998). (c) relative abundance of bacteria in the stool at the phylum level (top 5 shown). (d-f) the absolute percentage change of (d) Actinobacteria, (e) Bacteroidetes and (f) Firmicutes following intervention with either Fibremax, Inulin or Vitafiber. *p <.05, **p <.01 and ****p <.0001 as determined by paired t-test between before and after intervention for each individual supplement. Data represented as mean ± SEM. (g) relative abundance of bacteria in the stool at the genus level (top 15 shown). (h) before/after plot of the relative abundance of Bifidobacterium (top) and Anaerostipes (bottom) for Fibremax, Inulin and Vitafiber. **p <.01 and ***p <.001 as determined by paired t-test between before and after intervention for each individual supplement.
Fibre supplementation induced signature changes to the gut microbiota composition
While none of the supplements altered the overall gut microbiota composition as measured using non-supervised clustering by PCA of Aitchison’s distance, we next investigated whether the consumption of fiber supplements led to more specific changes in the gut microbiota. Consistent changes to the relative abundance of taxa at the phylum level were observed in response to a specific fiber supplementation, regardless of the individuals’ pre-supplement microbiome (). Notably, Actinobacteria were significantly increased following Inulin (23/24 patients, p=<0.0001) and Fibremax (18/24 patients, p = .0017) supplementation (). In contrast, Bacteroidetes level was significantly increased by Fibremax (17/24 patients, p = 0.0172) and decreased by Inulin (15/24 patients, p = .0112) (), and Firmicutes decreased following Fibremax intervention (16/24 patients, p = .0286) (). Euryarchaeota, Verrucomicrobia and Proteobacteria were not affected by any supplement (Fig. S2A), and Vitafiber supplementation induced no changes to any phyla (, Fig. S2A). A summary of these changes is provided in . At the genus level (), differential abundance analysis of the top 30 genera (encapsulating 95% of total taxa) between pre- and post-supplement microbiota revealed that only Inulin induced a signature change, with a significant enrichment of Bifidobacterium (effect size = 1.47, p = .0002) and Anaerostipes (effect size = 1.25, p = 0.0017) after one week of supplementation (). When comparing post-supplement microbiota, Inulin had a significant enrichment in Bifidobacterium (effect size = 1.12, p = 0.0045) and Anaerostipes (effect size = 0.75, p =.037) over Vitafiber, but not over Fibremax.
Table 3. Supplement induced changes at the phyla level. Data represented as median (IQR). P-value represents paired t-test between baseline and intervention relative abundance value.
We then next asked whether each intervention induced a specific bacterial taxonomic signature at the ASV level, using supervised machine learning (Sparse partial least squares discriminant analysis; sPLS-DA) to build models classifying samples in accordance with post-intervention microbiota. This approach considers the overall complexity of the gut microbiota, rather than by comparing individual taxa. Post-supplementation samples could be discriminated against each other with an accuracy of 77.8% (Fig. S2B) (p =.02). Within the model, an Inulin supplemented microbiota had the most distinguishing features, with ASVs assigned as Anaerostipes hadrus, Holdemanella spp., and Mogibacterium spp. having the greatest contribution to the separation of the different post-supplementation microbiota (Fig. S2C and Table S2). In contrast, ASVs corresponding to Blautia, Clostridium IV species, and others were associated with Fibremax, while only Blautia faecis was marginally predictive of a Vitafiber supplemented microbiome (Fig. S2C and Table S2).
Together, we show that the composition of the gut microbiota can be selectively influenced by just one week of fiber supplementation. This effect was fiber specific with a significant increase in Bifidobacteria, a group of bacteria known for their ability to utilize dietary fiber, following the consumption of Inulin and Fibremax in the majority of participants. Fiber supplement-induced changes were substantial enough that post-supplement signatures could be reliably differentiated using a machine learning approach.
The effect of fibre supplementation on gut microbiota composition can be effectively eliminated with a two-week washout period.
To confirm whether a two-week washout period was sufficient, we applied supervised machine learning to build a model that classified post-washout (pre-supplement) samples in accordance with the preceding supplement. Pre-supplement samples from the first batch were excluded because there was no preceding intervention (). The resultant model correctly classified only 43.7% (vs. 33% for random guessing) of samples based on the preceding supplement (), which was not statistically significant (p =.22), indicating that preceding supplements did not induce any distinguishing changes in microbiomes that persisted past the washout period.
Figure 3. Stools were collected before and one-week following consumption of either Fibremax, Inulin or Vitafiber and 16S rRNA gene sequencing was performed to analyze gut microbiota composition. (a) schematic highlighting the supervised machine learning approach to determine if a two-week washout period is sufficient to reset the gut microbiome (b) scatter plot of sPLS-DA analysis illustrating the predicted gut microbiome composition of pre-supplement samples (left) and confusion matrix outlining the performance of the prediction model (right) and loading plots indicating the ASV contributing to the sPLS-DA model (left).
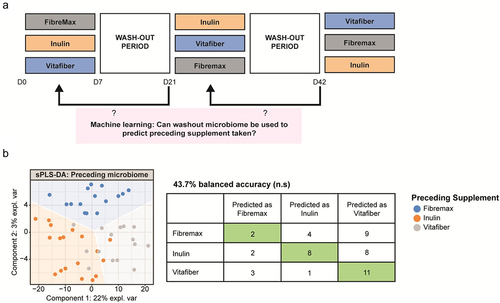
Thus, the 2 week-long washout period between the 1-week supplement interventions is sufficient for fiber supplement-induced effects on the gut microbiome to be lost. It also suggests that dietary fiber supplementation induced short-term and reversible alterations to gut microbiota.
Inulin and fibremax but not vitafiber supplementation reduced gut microbiota diversity.
Different fiber supplements had differential effects on gut microbial community alpha diversity metrics. When comparing post-supplement microbiota, we found that inulin induced a significant decrease in bacterial richness (Observed ASV), Shannon’s index, and the Inverse Simpson’s index compared to other interventions (). Importantly, no such differences were evident in pre-intervention samples (Fig. S3A), confirming that a 2-week washout period was sufficient to normalize the gut microbiota of each participant.
Figure 4. Stool were collected before and one-week following consumption of either Fibremax, Inulin or Vitafiber and 16S rRNA gene sequencing was performed to analyze gut microbiota composition. (a-c) alpha diversity measures of post-supplement gut microbiome as measured by (a) observed ASV (b) Shannon’s diversity index and (c) Inverse Simpson’s diversity index. Data represented as mean ± SEM and *p < 0.05, **p < 0.01 and ***p < 0.001 as determined by ordinary one-way ANOVA with Tukey’s multiple comparison. (d) cumulative distribution function (CDF) plot showing the cumulative change in diversity measures across all participants for each of the three dietary fiber supplements. Table shows the statistical output detailing whether the differences in a given alpha diversity measure significantly differs from zero based on paired Wilcoxon signed-rank test.
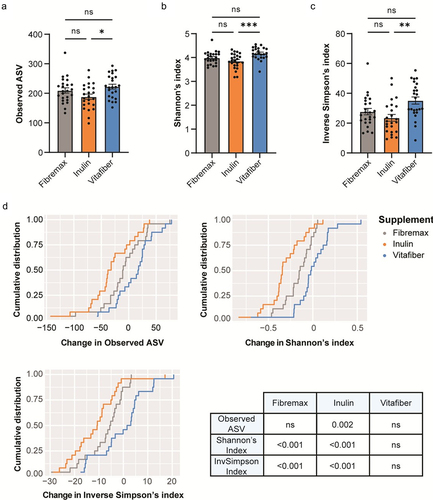
When comparing changes induced by specific fiber interventions, we found that Inulin had the most consistent effect across individuals on alpha diversity measures, with approximately 75% of the participants showing a decrease in observed ASV (), while Fibremax had an intermediate impact and Vitafiber had no impact. Overall, Inulin significantly decreased post-intervention bacterial richness (Observed ASV), Shannon’s and Inverse Simpson’s diversity indices relative to pre-intervention ( and Fig. S3B). Fibremax decreased Shannon’s and Inverse Simpson’s diversity indices relative to pre-intervention values ( and Fig. S3C), while Vitafiber had no impact on gut microbiota diversity across all measures (. and Fig. S3D).
The alpha diversity results support our previous observations that, while Inulin and Fibremax affected the gut microbiota, Vitafiber had little or no effect. To explore this, we used supervised machine learning to build a model to classify post-intervention microbiota (as done in Fig. S2B), but with the inclusion of baseline samples. In this model, Inulin and Fibremax could be differentiated with high accuracy, whereas the model could not distinguish between baseline samples and Vitafiber-supplemented gut microbiota (Fig. S3E). The inability of the sPLS-DA model in finding features that could differentiate between post-supplement Vitafiber and baseline microbiome suggests that Vitafiber supplementation does not have a prominent impact on gut microbiota composition.
Overall, both Inulin and Fibremax supplementation reduced gut microbiota alpha diversity, with inulin having the most significant effect. This is consistent with our previous analysis showing that Inulin has the greatest impact on the gut microbiota ().
Short-chain fatty acid production in response to dietary fibre is individual and fibre-specific.
We next investigated how the different fiber supplements altered stool SCFA profiles, a proxy measure of the effectiveness of microbe-stimulation by fiber supplements, in study participants. When comparing the change in stool SCFA levels between pre- and post-intervention samples, there was no significant difference between any of the supplements (Fig. S4A). Consistent with these findings, post-intervention stool SCFA levels were similar across the three fiber interventions (Fig. S4B). These data indicate that, on average, there was no increase or decrease in specific SCFAs when comparing the entire study population.
However, we found variation around zero change, consistent with fiber supplementation having personalized effects. To test this explicitly, we normalized SCFA changes (acetate, butyrate, and propionate) to lie on similar ranges of values, and then performed a non-parametric analysis of variance to test whether changes to SCFA were due to the participant irrespective of SCFA type or supplement; the supplement irrespective of SCFA type or participant; the interaction between participant and SCFA type or supplement; or the interaction between SCFA type and supplement. We found a statistically significant effect by participants (R2 = 0.23, p =.001), indicating that participants were differentially predisposed to SCFA level changes under fiber supplementation (). Furthermore, we found a significant effect of the interaction between participant and supplement type, meaning that changes in SCFA in individuals are supplement specific (R2 = 0.61, p =.001). We found no evidence of: 1) specific supplements affecting overall SCFA changes (irrespective of SCFA type or specific participant), 2) specific supplements on specific SCFA types, or 3) participants being differentially predisposed to changes in a specific SCFA type.
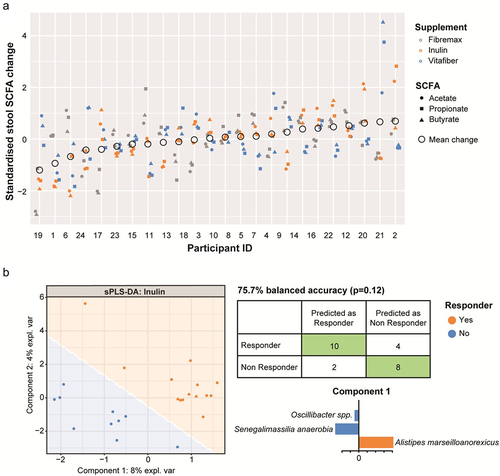
Figure 5. Stools were collected before and one-week following consumption of either Fibremax, Inulin or Vitafiber and stool SCFA concentrations were quantified by NMR. (a) standardized change in SCFA for each participant is shown. Circles represent the mean change in stool SCFA following intervention of each individual. (b) pre-supplement microbiome of responders (as determined by net increase of stool SCFA after dietary fiber supplementation) vs. non-responders were stratified, and pre-supplement features (taxa) that are positively or negatively associated with responders vs. non responders for Inulin were classified by supervised sPLS-DA analysis as illustrated by the scatter plot representing the two components of the model (left). Confusion matrix outlining the performance of the prediction model (right) and loading plots indicating the ASV contributing to the sPLS-DA model, with orange representing responders and blue representing non-responders. The length of the bar plot represents the importance of each ASV to the model (positive loading represents that the ASV is positively associated with either responders or non-responders while negative loading represents a negative association).
Plasma acetate, the prominent SCFA in blood, exhibited similar patterns to stool SCFA, with no significant change in plasma acetate levels between pre- and post-intervention samples (Fig. S4C), as well as when comparing post-intervention samples (Fig. S4D). There was a significant effect of the interaction between participant and supplement type (R2 = 0.228, p =.046), indicating that changes in plasma SCFA in individuals are also supplement specific (Fig. S4E).
Collectively, our data suggest that changes in SCFA levels in response to fiber supplementation depend on both the individual and the type of fiber supplement.
Specific microbial taxa are associated with SCFA production in response to inulin supplementation
It is evident that the response to dietary fiber (related to SCFA) depends on the composition of the gut microbiota and the type of fiber supplement consumed. Thus, we next asked whether an individual’s unique gut microbiota composition would dictate their response to different fiber supplements. To do this, we first stratified individuals as either responders (increase in total stool SCFA concentration) or non-responders (no change or decrease in total stool SCFA concentration) for each supplement. Next, we performed supervised sPLS-DA analysis on pre-supplement microbiota to identify features (taxa) associated with either responders or non-responders to each fiber supplement. Using this approach, a satisfactory model for Fibremax and Vitafiber could not be produced, resulting in over-fitted models that included most of the taxa present and had poor predictive accuracy (Fig. S5A and Fig. S5B). However, Inulin could produce a satisfactory model that could predict whether an individual would respond to Inulin supplementation with 75.7% accuracy (), although this was not statistically significant (p =.12). Within this model, the butyrate producer Alistipes marseilloanorexicus was predictive of responders, whereas non-responders were characterized by lower Senegalimassilia anaerobia and Oscillibacter spp ( and ). No satisfactory models could be produced for any of the supplement when stratifying responders and non-responders based on plasma acetate levels (data not shown).
Table 4. Taxa (components) relating to sPLS-DA model of responders vs. non responders to Inulin.
To examine if incorporating predicted metabolic functions of the gut microbiota could improve our classification approach, we utilized PICRUSt2,Citation34 a methodology that allows for predicting gene or pathway abundances based on 16S data. Predicted pathway abundances did not perform better compared to 16S data in classifying responders from non-responders for all three supplements (Fig. S5C). Of note, while an optimally tuned model for Inulin had comparable classification accuracy compared to 16S data, the model is likely not meaningful due to overfitting (i.e., component 1 of the model utilizes 305 pathways out of the included 394 pathways). As both 16S and predicted functional pathway abundance data indicate that it may be possible to predict responders to Inulin, we then looked at whether responders to Inulin had a different predicted baseline pathway abundances to non-responders. To do this, we performed differential abundance analysis, however, we did not find any significant pathways (after adjustment for multiple comparison) that was different between responders and non-responders (top 20 most significant pathways shown in Table S3).
Our results indicate that predicting an individual’s response to specific dietary fiber based on SCFA quantification is not straightforward and potentially not feasible for all fiber types. Nevertheless, we successfully developed a model that could predict an individual’s responsiveness to Inulin with some degree of certainty.
Fibre supplements differentially alter PBMC population and immune cell functional output
As dietary fiber and SCFA modulate host immunity, we examined how short-term dietary fiber supplementation affects the immune system in healthy individuals, and whether these effects are explicitly linked to an increase in SCFA. To do this, we took a subset of participants (n = 12) with increased stool SCFA post-supplementation and examined their blood T cells, B cells, monocytes, macrophages, dendritic cells, and natural killer cells using flow cytometry (gating strategy presented in Fig. S6). To determine whether each supplement influenced these immune parameters, we compared PBMC pre- and post-fiber supplementation for each supplement (where pre-supplement refers to PBMC samples collected immediately prior to intervention, i.e., at baseline or following washout).
We found that each fiber supplement had a unique effect on immune cells pre- vs. post supplementation (), indicating a differential effect of fiber supplements on immune cell activity. Consistent with its impact on the gut microbiota, Inulin had the strongest effect on the immune system, with a decreased proportion of circulating dendritic cells () and an increased proportion of classical monocytes (). Inulin supplementation also affected the activation profile of immune cells with decreased expression of CD86, a costimulatory molecule, on CD16hiCD14+ intermediate monocytes () and on immune cell cytokine production, with inulin supplementation leading to increased production of TNF in both CD4+ and CD8+ cells (), and IFNγ in CD4 T cells (). Some effects were not fiber specific, with all supplements leading to higher CD86 expression on non-classical monocytes (). Thus, fiber supplementation can differentially affect both the proportion and function of blood immune cells, with Inulin having the greatest impact.
Figure 6. PBMC from n = 12 responder individuals (characterized by an increased in stool SCFA levels following fiber supplement) were immunophenotyped by flow cytometry. Comparison of PBMC between pre-supplementation (immediately prior to supplement intervention) vs. post-supplementation was made for each fiber supplement. (a-g) before-after plot of (a) dendritic cell, (b) classical monocytes, (c) CD86 expression (MFI) on intermediate monocytes, (d) CD86 expression (MFI) on non-classical monocytes, (e) TNF-producing CD4+ and (f) CD8+ T cells and (g) IFNγ-producing CD4+ T cells. *p <.05, **p <.01, ***p <.001 and ****p <.0001 as determined by paired t test.
Table 5. Immune parameters in PBMC of participant at baseline and following intervention with Fibremax, Inulin or Vitafiber supplement. Data represented as median (IQR). P-value represents paired t-test between baseline and intervention.
Discussion
We show that one week of fiber supplementation in healthy women is sufficient to induce specific changes both at the levels of the gut microbiota and of the immune system. These responses were individualized and depended on the type of dietary fiber used. The product Inulin (fructo-oligosaccharide) elicited the most consistent and predictable effect across individuals, whereas Vitafiber had the least effect. Using a machine learning approach, we were able to identify taxa that were associated with SCFA production in response (Alistipes marseilloanorexicus) or not (Senegalimassilia anaerobia and Oscillibacter spp.) to supplementation with Inulin. Future large-scale studies are required to confirm these findings and to confirm that these taxa could be used to select the most appropriate dietary fiber for an individual to maximize SCFA production. Resolving the gut microbiota at the species level may further improve this approach, as 16S sequencing does not provide adequate species and strain level resolution.Citation35
Dysbiosis is associated with many diseases. Dietary fiber can restore gut microbiota composition and function, and therefore holds promise as a tool to prevent or alleviate diseases. However, human clinical trials using dietary fiber have shown varying success in recapitulating the beneficial effects of fiber demonstrated in preclinical studies.Citation19–21 This is likely explained by the high inter-individual heterogenicity of the human gut microbiota, each possessing a unique repertoire of enzymes with varying abilities to break down different fiber. Indeed, the ability to generate SCFA from specific fiber is dependent on an individual’s microbiomeCitation36 and improvement in glucose metabolism following fiber intake was only shown in individuals with increased abundance of Prevotella.Citation29 However, a recent study reported no correlation between microbial metagenomic gene abundance and microbiota-derived metabolite levels.Citation37 This suggests that it may not be possible to create a reliable model for predicting SCFA production based on either gut microbiota composition or its functional profile. Other strategies, such as examining the presence of interactions between different bacteria, may be required.
Despite its overall stability, our study showed that aspects of the human gut microbiome are modifiable. One week of inulin supplementation was sufficient to promote an increase in the relative abundance of specific bacterial taxa, particularly Actinobacteria, mostly due to increases in Bifidobacterium species. These are widely considered potent probiotics and high SCFA producers.Citation38 This is consistent with the notion that dietary fiber affects the gut microbiota within days.Citation39 Furthermore, known SCFA producers were signature to post-supplement microbiome, including Anaerostipes hadrusCitation40 for Inulin, and taxa belonging to the genera BlautiaCitation41 and Clostridium cluster IVCitation42 for Fibremax. These characteristics were lost following a 2-week washout period, suggesting that this timeframe was sufficient to revert diet-induced microbiome changes in healthy adults. This is consistent with previous studies, whereby inulin supplementation increased Bifidobacteria that peaked within a week and progressively normalized within a one-to-two-week period once supplementation stops.Citation43 Our results indicate that the consumption of prebiotics must be continuously maintained for their beneficial effects on the gut microbiota composition to persist.
Gut microbiota diversity was most reduced by Inulin supplementation, followed by Fibremax, whereas Vitafiber had no effect. High-fiber diet has been shown to reduce microbiota diversity in miceCitation5 and in humans.Citation44 This may be explained by the selection of bacteria that thrive on the source of energy substrates provided by a particular diet.Citation45 In the present study, participants were asked to maintain their usual diet, suggesting that fiber supplementation was sufficient to recapitulate the effects of a high-fiber diet on gut microbiota diversity, at least with Inulin. These results are contradictory to those of other studies, which reported an increase in gut microbiome diversity with high fiber intake, including in miceCitation24 and humans.Citation25 A recent study reported that microbiota diversity did not increase with a high-fiber diet, but rather with a diet high in fermented foodsCitation26. One differentiating factor between studies may be the dose and type of fiber used. Very high fiber intake creates an environment that selects for fiber-degrading bacteria, allowing them to outcompete other bacteriaCitation46 and reduce the overall microbiome diversity. As microbial diversity is often quoted as beneficial, our study indicates that this may be context-dependent, and reduced diversity is not necessarily an indicator of poor health.Citation44 For example, a high-fiber diet intervention was shown to improve glucose homeostasis in type 2 diabetes patients despite a decreased richness of the gut microbiota.Citation44
A more important readout may be the functional profile of the gut microbiome and its ability to degrade fiber that provide maximal SCFA for the host. Our study found that all three supplements had differential impact on PBMCs. SCFA typically have anti-inflammatory effects, including induction of tolerogenic dendritic cells and immunosuppressive regulatory T cells.Citation5,Citation47,Citation48 We did not observe changes in regulatory T cells in PBMC but instead found that Inulin increased the proinflammatory potential of T cells, including increased TNF and IFNγ production. Regulatory T cells have been reported to increase with fiber and SCFA; however, these were in the gastrointestinal tract.Citation5,Citation48,Citation49 While dietary fiber is typically associated with anti-inflammatory effects, inulin has been shown to drive type 2 inflammation in a mouse model of allergic airway inflammation, mediated by gut microbial production of secondary bile acids.Citation50 In contrast, our observed pro-Th1 effect of inulin under healthy conditions is consistent with the finding that inulin could prevent allergy development in mice.Citation51 Inulin may have differential effects in mice and humans or its impact on the immune system depends on the challenge encountered. Indeed, our data suggests that the beneficial effects of short-term dietary fiber supplementation on immunity might be context dependent. For example, Inulin could be beneficial in cancer as previously reported based on its impact on IFNγ and TNF response.Citation52,Citation53 However, these cytokines are known to aggravate autoimmune diseases, highlighting the importance of personalized interventions to avoid disease aggravation.
Differences in responses to fiber may also be explained by the status of the host. In our study, Vitafiber had the least observable impact on the gut microbiota composition, diversity, SCFA production, and immune phenotypes. This is likely because Vitafiber, composed of corn starch rich in soluble fiber, closely represents common dietary ingredients. Success with fiber supplementation, therefore, also relates to the individual’s dietary habits and microbiome profile. It also highlights a potential limitation of our study, which was performed in healthy participants and did not control for other aspects of diet. It also raises the question of whether individuals with dysbiosis would respond similarly to fiber supplements such as inulin. This aspect is particularly relevant as dysbiotic mice supplemented with inulin developed icteric hepatocellular carcinomaCitation54 and fiber supplementation in patients with inflammatory bowel disease elicited a proinflammatory effect due to the inability of a dysbiotic microbiota to ferment the fiber, leading to increased intact β-fructan that activates NLRP3 and TLR2 pathways.Citation55 These findings suggest that the health status of individuals and of their gut microbiota can switch the effects of supplements from beneficial to detrimental, which could raise concerns regarding the safety of these food products. Long-term deprivation of fiber, particularly across generations, can lead to irreversible loss of fiber digesting bacterial species.Citation24 Therefore, alternative approaches, such as synbiotic intervention, or prior fecal microbiota transplant, may be required to rescue individuals with a dysbiotic gut microbiota. For example, while the treatment success of fecal microbiota transplant has only been reliably demonstrated for Clostridium difficile infections, the impact of fecal microbiota transplant on recipients’ gut microbiota composition appears to be long-lasting, with close resemblance to donor microbiota composition even after 6 months.Citation56 As we have shown that gut microbiota composition can be predictive of a response to fiber supplement (at least with Inulin), this technique holds potential promise in restoring a healthy gut microbiome. Whether transplanting a fiber-responsive microbiota into individuals can improve their response to fiber and to promote higher SCFA production would need to be investigated in future studies.
By utilizing a cross-over design involving three different fiber supplements, we were able to show that fiber supplements have both universal and individualized effects across clinical, microbiota, and immune characteristics in healthy individuals. Our study indicates that different fiber supplementation should be personalized based on an individual’s gut microbiota composition and on the desired outcome.
Methods
Subjects and sampling
A total of 34 female volunteers aged between 30 and 65 years old, with a body mass index (BMI) ranging from 18 to 30 kg/m2 were recruited, and n = 28 completed the study. Exclusion criteria were type 1 or type 2 diabetes mellitus, renal or liver disease, cancer or active neoplasms, hyperthyroidism (unless treated or under control), use of medications known to affect weight or energy expenditure, unintentional weight loss (>10% body weight) over the past 5 years, smoking, alcohol consumption (>3 drinks/day), food allergies and/or intolerances, and when changes in diet are contraindicated by the treating doctor.
Volunteers were recruited through electronic and paper media advertisements, including social media and pamphlets, and assessed for eligibility through a screening questionnaire and a screening visit at the Clinical Research Facility at the Charles Perkins Centre. The screening questionnaire included questions regarding medical history, medications, supplements, allergies, and intolerances. Weight and height were measured according to standardized protocol, and BMI was calculated (weight/height)Citation2. Rolling recruitment and assessment were conducted between February 2018 and April 2019.
Ethics
The trial was conducted in accordance with the Declaration of Helsinki and all procedures were reviewed and approved (Protocol Number X17–0130 & HREC/17/RPAH/192) by the Ethics Review Committee (Royal Prince Alfred Hospital Zone) of the Sydney Local Health District. The trial was registered with the Australian and New Zealand Clinical Trials Registry (ACTRN12617001139369) on the 21st of November 2016. All participants signed a consent form.
Fibre supplements
Three different dietary fiber supplements were used for this study and were purchased commercially: Vitafiber (Isomalto-oligosaccharide; Myprotein), Inulin (fructo-oligosaccharide; Myprotein), and Fibremax (47% chicory root extract, 23.5% psyllium husk, 23.5% soy Fiber, 5% oat bran, and 1% Pectin; New Image). Participants were asked to consume the fiber supplements three times daily, a total of 15 g of Vitafiber, 34 g of Fibremax, or 15 g of inulin, equating to approximately 15 g of soluble fiber per day. During the intervention, participants were provided a 7-day dairy where they indicated the time(s) they took the supplement each day. They were also asked to record any adverse symptoms (bloating, gas and diarrhea) and their dietary intake. Dietary intake (habitual and during intervention) was determined through collection of a four-day estimated food record (4dEFR). Participants were required to record their dietary intake for four consecutive days (including one weekend day) giving as much detail about food consumed as possible. This included brands, preparation technique, leftovers (bones, skin, core), recipes and food consumed outside of home. Dietary intake data was analyzed using FoodWorks 10 Professional, v10.0. Brisbane: Xyris Pty Ltd, 2019 with the AUSNUT 2011‒13 database (Food Standards Australia New Zealand (2014). AUSNUT 2011–13 – Australian Food Composition Database. Canberra: FSANZ. Available at www.foodstandards.gov.au).
Stool collection
Stool samples were collected within 48 hours prior to each clinical assessment. Participants were provided with a thermal bag (Thermabag), a small icepack, and written instructions on sample collection, storage, and transportation. Participants were asked to record the time of the collection and to place the sample in the freezer immediately after collection. Participants were requested to minimize the time out of the freezer to less than 2 hours when delivering to the clinic on the assessment day. Once received, the samples were stored in −80°C freezers.
Blood collection and processing
Four-hour fasting blood samples were collected on the day of the clinical assessments. Blood samples were collected into 10 mL BD Vacutainer K2-EDTA collection tubes (Becton Dickinson, #367525) for plasma and 8.5 mL BD Vacutainer SSTII advance collection tubes (Becton Dickinson, #367958) for serum, centrifuged immediately (4500 rpm, 15 min at 4°C), pipetted into CryoPure cryogenic tubes (Sarstedt AG & Co, #72.380), and stored at − 80°C. For the isolation of peripheral blood mononuclear cell (PBMC) for immune phenotyping, the SepMate™ PBMC Isolation Tubes (StemCell Technologies, #85460) with Lymphoprep™ (StemCell Technologies, #07861) was used to isolate PBMC from whole blood, according to the manufacturer’s instructions. Purified PBMC were cryopreserved in 10% DMSO (Sigma-Aldrich, #276855) in fetal bovine serum (FBS) (Bovogen, #SFBS-AU).
Metabolite quantification from stool and plasma
SCFA levels in plasma and stool were measured by nuclear magnetic resonance (NMR) analysis. Briefly, samples were filtered through a 3 kDa membrane filter (Merck Millipore, #UFC500396), and polar metabolites was extracted from the aqueous phase of a water:chloroform:methanol mixture (Sigma-Aldrich, #151858 and #151947) and diluted in trisodium phosphate (Sigma-Aldrich, #342483) buffer (pH 7). Samples were analyzed on a Bruker 600 MHz NMR machine containing 0.5 mM 4,4-dimethyl-4-silapentane-1-sulfonic acid (Sigma-Aldrich, #178837) as an internal standard. Data were analyzed using the Chenomx Profiler software (8.31). Stool samples were first homogenized in deuterium oxide at a final concentration of 100 mg/ml before filtration.
Immune phenotyping of PBMC
Cryopreserved PBMC were thawed and washed with RPMI medium (Gibco, #21870092) containing 10% FBS, 2 mM L-glutamine (Gibco, #25030081), 100 units/mL penicillin, and 100 µg/mL streptomycin (Gibco, #15140122). 1 × 10⁶ cells were stained with Fc block (BioLegend, #422302) and the Live/Dead Fixable Blue Dead Cell Stain Kit (Invitrogen, #L34962) for 30 min at 4°C and washed with FACS buffer (2% FBS in PBS). For each participant, samples from each timepoint were first barcoded by staining with a combination of different fluorophore-conjugated CD45, washed, and then pooled for extracellular and intracellular staining. For staining of intracellular targets, PBMC were first stimulated with 50 ng/ml phorbol 12-myristate 13-acetate (Sigma-Aldrich, #P8139), 500 ng/ml ionomycin (Sigma-Aldrich, #I0634) and 5 µg/ml brefeldin A (Sigma-Aldrich, #B6542) for 4 h prior to staining. The Foxp3/Transcription Factor Staining Buffer Set (eBioscience, #00-5523-00) was used for intracellular cytokine staining. The following fluorescent-conjugated anti-human antibodies were used in this study: CD24-BUV395 (ML5), CD27-BUV661 (M-T271), CD45-BUV737 (HI30), CD38-BUV805 (HB7), CD19-V450 (HIB19), CD16-BV510 (3G8), CD86-PE/Cy5 (FUN-1), CD56-PE/Cy7 (B159), CD31-R718 (L133.1), CD3-APC-H7 (SK7) from BD Biosciences, CD45-BV570 (RA3-6B2), CD11c-BV605 (3.9), CD45-BV650 (HI30), CD45RA-BV711 (HI100), CD4-BV785 (OKT4), FoxP3-AF488 (259D), CD8-PerCP/Cy5.5 (SK1), CD14-APC (HCD14), IL-10-BV421 (JES3-9D7), TNF-PE (MAb11), IFNγ-PE/Cy7 (4S.B3) from BioLegend, CD25-PE (BC96) from Invitrogen and IL-6-APC (REA1037) from Miltenyi Biotec. Samples were acquired on a Cytek 5 L Aurora spectral flow cytometer, and data were analyzed using FlowJo v10.
Gut microbiota analysis
DNA was extracted using the FastDNA™ SPIN Kit for Feces (MP Biomedicals #116570200), following the manufacturer’s instructions. Amplifiability and DNA concentration were verified by PCR and the Qubit assay kit (Invitrogen). Illumina sequencing of the V4 region (515f-806 r) of the 16S rRNA gene was performed commercially at the Ramaciotti Centre for Genomics (The University of New South Wales). Paired-end reads (2 × 250 bp) were processed with the dada2 package (1.12.1) using R software (version 3.6.1). Briefly, forward and reverse reads were trimmed (F240; R200) and quality-filtered (using default parameters) to remove low sequence bases, and error model was determined (10Citation8 bases). Sequences were then dereplicated and exact amplicon sequence variants (ASVs) were inferred before merging of paired-end reads and removal of chimeric sequence. Taxonomy was assigned using the Ribosomal Database Project (RDP) training set (rdp_train_set_16) with specie-level taxonomy (dp_species_assignment_16) assignment (10.5281/zenodo.801828). The microbiome was explored using the following R packages phyloseq (1.42.0), microbiome (1.20.0), ALDEx2 (1.30.0), and mixOmics (6.22.0). Sequencing data were deposited in the European Nucleotide Archive under accession number PRJEB61931.
Statistical analysis
To calculate the number of participants required for the study, we estimated a dropout rate of approximately 10% and a within-subject correlation of changes to stool acetate of 0.5 (SD between supplement group). A total of 30 subjects will be required to detect a difference with 80% power and a bilateral alpha risk of 5%.
For the analysis of clinical characteristics, fixed effects of treatment (supplement) and time (before versus after intervention) were performed using linear mixed-effects models, with each individual participant as a random effect. To compare pre- vs. post-supplement characteristics for an individual supplement, a two-tailed paired t-test was used. For the comparison of post-supplement characteristics between supplements, one-way ANOVA with Tukey’s multiple comparison test was used. To evaluate whether the overall microbiome composition differed between groups, a PERMANOVA test was used. For differential abundance analysis of microbiome composition between pre- and post-supplement microbiome, and between post-supplement microbiome between supplements, paired or unpaired ALDEx2 tests were used, respectively. Sparse partial least squares discriminant analysis (sPLSDA) was used for feature selection and classification, and the models were tuned using M-fold cross-validation with five folds for each validation and 100 repeats. The Balanced Error Rate was used as a misclassification measure and “max.dist” as the distance metric. Multilevel analysis (repeated measurement of participants across different interventions) was used, where appropriate. An alpha cutoff of 0.05 was used for all statistical tests. Data were analyzed using R Software (4.2.2) or GraphPad Prism 9 software.
Author contributions
JT conducted research, analyzed data and wrote the paper. RVR conducted the clinical study and assisted with data analysis. CB and ES assisted with data analysis. CD, AH, RN and SJS participated to the design of the study. LM received fundings, initiated and designed the study. All authors have read and approved the final manuscript.
Supplemental Material
Download MS Word (1.4 MB)Acknowledgments
We acknowledge the Sydney Cytometry facility for providing access to flow cytometer analysers. This research was facilitated by access to Sydney Analytical, a core research facility at the University of Sydney.
Disclosure statement
No potential conflict of interest was reported by the author(s).
Supplementary material
Supplemental data for this article can be accessed online at https://doi.org/10.1080/19490976.2023.2274127
Additional information
Funding
References
- Park Y, Subar AF, Hollenbeck A, Schatzkin A. Dietary fiber intake and mortality in the NIH-AARP diet and health study. Arch Intern Med. 2011;171(12):1061–23. doi:10.1001/archinternmed.2011.18.
- Yang Y, Zhao L-G, Wu Q-J, Ma X, Xiang Y-B. Association between dietary fiber and lower risk of all-cause mortality: a meta-analysis of cohort studies. Am J Epidemiol. 2015;181(2):83–91. doi:10.1093/aje/kwu257.
- Macia L, Tan J, Vieira AT, Leach K, Stanley D, Luong S, Maruya M, Ian McKenzie C, Hijikata A, Wong C, et al. Metabolite-sensing receptors GPR43 and GPR109A facilitate dietary fibre-induced gut homeostasis through regulation of the inflammasome. Nat Commun. 2015;6(1):6734. doi:10.1038/ncomms7734.
- Thorburn AN, McKenzie CI, Shen S, Stanley D, Macia L, Mason LJ, Roberts LK, Wong CHY, Shim R, Robert R, et al. Evidence that asthma is a developmental origin disease influenced by maternal diet and bacterial metabolites. Nat Commun. 2015;6(1):7320. doi:10.1038/ncomms8320.
- Tan J, McKenzie C, Vuillermin PJ, Goverse G, Vinuesa CG, Mebius RE, Macia L, Mackay CR. Dietary fiber and bacterial SCFA enhance oral tolerance and protect against food Allergy through diverse cellular pathways. Cell Rep. 2016;15(12):2809–2824. doi:10.1016/j.celrep.2016.05.047.
- Mariño E, Richards JL, McLeod KH, Stanley D, Yap YA, Knight J, McKenzie C, Kranich J, Oliveira AC, Rossello FJ, et al. Gut microbial metabolites limit the frequency of autoimmune T cells and protect against type 1 diabetes. Nat Immunol. 2017;18(5):552–562. doi:10.1038/ni.3713.
- Trompette A, Gollwitzer ES, Pattaroni C, Lopez-Mejia IC, Riva E, Pernot J, Ubags N, Fajas L, Nicod LP, Marsland BJ. Dietary fiber confers protection against flu by shaping Ly6c− patrolling monocyte hematopoiesis and CD8+ T cell metabolism. Immunity. 2018;48(5):992–1005.e8. doi:10.1016/j.immuni.2018.04.022.
- Daïen CI, Tan J, Audo R, Mielle J, Quek LE, Krycer JR, Angelatos A, Duraes M, Pinget G, Ni D, et al. Gut-derived acetate promotes B10 cells with antiinflammatory effects. JCI Insight. 2021;6(7):e144156, 144156. doi:10.1172/jci.insight.144156.
- Fettig NM, Robinson HG, Allanach JR, Davis KM, Simister RL, Wang EJ, Sharon AJ, Ye J, Popple SJ, Seo JH, et al. Inhibition of Th1 activation and differentiation by dietary guar gum ameliorates experimental autoimmune encephalomyelitis. Cell Rep. 2022;40(11):111328. doi:10.1016/j.celrep.2022.111328.
- Tan JK, Macia L, Mackay CR. Dietary fiber and SCFAs in the regulation of mucosal immunity. J Allergy Clin Immunol. 2022;151(2):S361–370. doi:10.1016/j.jaci.2022.11.007.
- Makki K, Deehan EC, Walter J, Bäckhed F. The impact of dietary fiber on gut microbiota in host health and disease. Cell Host & Microbe. 2018;23(6):705–715. doi:10.1016/j.chom.2018.05.012.
- Tan J, McKenzie C, Potamitis M, Thorburn AN, Mackay CR, Macia L. The role of short-chain fatty acids in health and disease. Adv Immunol. 2014;121:91–119.
- Litvak Y, Byndloss MX, Bäumler AJ. Colonocyte metabolism shapes the gut microbiota. Sci. 2018;362(6418):eaat9076. doi:10.1126/science.aat9076.
- Duscha A, Gisevius B, Hirschberg S, Yissachar N, Stangl GI, Eilers E, Bader V, Haase S, Kaisler J, David C, et al. Propionic acid shapes the multiple sclerosis disease course by an immunomodulatory mechanism. Cell. 2020;180(6):1067–1080.e16. doi:10.1016/j.cell.2020.02.035.
- Jama H, Marques, FZ. Gut microbial metabolites lower blood pressure in patients with hypertension. Nat Cardiovasc Res. 2023;2(1):18–19. doi:10.1038/s44161-022-00204-8.
- Noval Rivas M, Burton OT, Wise P, Zhang Y, Hobson SA, Garcia Lloret M, Chehoud C, Kuczynski J, DeSantis T, Warrington J, et al. A microbiota signature associated with experimental food allergy promotes allergic sensitization and anaphylaxis. J Allergy Clin Immunol. 2013;131(1):201–212. doi:10.1016/j.jaci.2012.10.026.
- Cekanaviciute E, Yoo BB, Runia TF, Debelius JW, Singh S, Nelson CA, Kanner R, Bencosme Y, Lee YK, Hauser SL, et al. Gut bacteria from multiple sclerosis patients modulate human T cells and exacerbate symptoms in mouse models. Proc Natl Acad Sci U S A. 2017;114(40):10713–10718. doi:10.1073/pnas.1711235114.
- Gopalakrishnan V, Spencer CN, Nezi L, Reuben A, Andrews MC, Karpinets TV, Prieto PA, Vicente D, Hoffman K, Wei SC, et al. Gut microbiome modulates response to anti–PD-1 immunotherapy in melanoma patients. Sci. 2018;359(6371):97–103. doi:10.1126/science.aan4236.
- McLoughlin R, Berthon BS, Rogers GB, Baines KJ, Leong LEX, Gibson PG, Williams EJ, Wood LG. Soluble fibre supplementation with and without a probiotic in adults with asthma: a 7-day randomised, double blind, three way cross-over trial. EBioMedicine. 2019;46:473–485. doi:10.1016/j.ebiom.2019.07.048.
- Visuthranukul C, Chamni S, Kwanbunbumpen T, Saengpanit P, Chongpison Y, Tepaamorndech S, Panichsillaphakit E, Uaariyapanichkul J, Nonpat N, Chomtho S. Effects of inulin supplementation on body composition and metabolic outcomes in children with obesity. Sci Rep. 2022;12(1):13014. doi:10.1038/s41598-022-17220-0.
- Kok CR, Rose D, Hutkins R. Predicting personalized responses to dietary fiber interventions: opportunities for modulation of the gut microbiome to improve health. Annu Rev Food Sci Technol. 2023;14(1):157–182. doi:10.1146/annurev-food-060721-015516.
- McBurney MI, Davis C, Fraser CM, Schneeman BO, Huttenhower C, Verbeke K, Walter J, Latulippe ME. Establishing what constitutes a healthy human gut microbiome: state of the science, regulatory considerations, and future directions. J Nutr. 2019;149(11):1882–1895. doi:10.1093/jn/nxz154.
- Gill SK, Rossi M, Bajka B, Whelan K. Dietary fibre in gastrointestinal health and disease. Nat Rev Gastroenterol Hepatol. 2021;18(2):101–116. doi:10.1038/s41575-020-00375-4.
- Sonnenburg ED, Smits SA, Tikhonov M, Higginbottom SK, Wingreen NS, Sonnenburg JL. Diet-induced extinctions in the gut microbiota compound over generations. Nature. 2016;529(7585):212–215. doi:10.1038/nature16504.
- Menni C, Jackson MA, Pallister T, Steves CJ, Spector TD, Valdes AM. Gut microbiome diversity and high-fibre intake are related to lower long-term weight gain. Int J Obes (Lond). 2017;41(7):1099–1105. doi:10.1038/ijo.2017.66.
- Wastyk HC, Fragiadakis GK, Perelman D, Dahan D, Merrill BD, Yu FB, Topf M, Gonzalez CG, Van Treuren W, Han S, et al. Gut-microbiota-targeted diets modulate human immune status. Cell. 2021;184(16):4137–4153.e14. doi:10.1016/j.cell.2021.06.019.
- Enam F, Mansell TJ. Prebiotics: tools to manipulate the gut microbiome and metabolome. J Ind Microbiol Biotechnol. 2019;46(9–10):1445–1459. doi:10.1007/s10295-019-02203-4.
- El Kaoutari A, Armougom F, Gordon JI, Raoult D, Henrissat B. The abundance and variety of carbohydrate-active enzymes in the human gut microbiota. Nat Rev Microbiol. 2013;11(7):497–504. doi:10.1038/nrmicro3050.
- Kovatcheva-Datchary P, Nilsson A, Akrami R, Lee YS, De Vadder F, Arora T, Hallen A, Martens E, Björck I, Bäckhed F. Dietary fiber-induced improvement in glucose metabolism is associated with increased abundance of Prevotella. Cell Metab. 2015;22(6):971–982. doi:10.1016/j.cmet.2015.10.001.
- Zeevi D, Korem T, Zmora N, Israeli D, Rothschild D, Weinberger A, Ben-Yacov O, Lador D, Avnit-Sagi T, Lotan-Pompan M, et al. Personalized nutrition by prediction of glycemic responses. Cell. 2015;163(5):1079–1094. doi:10.1016/j.cell.2015.11.001.
- Singla V, Chakkaravarthi S. Applications of prebiotics in food industry: a review. Food Sci Technol Int. 2017;23(8):649–667. doi:10.1177/1082013217721769.
- Nutrition C for FS and A. Guidance for industry: the declaration of certain isolated or synthetic non-digestible carbohydrates as dietary fiber on nutrition and supplement facts labels [internet]. 2020 [cited 2023 Sep 20]; Available from: https://www.fda.gov/regulatory-information/search-fda-guidance-documents/guidance-industry-declaration-certain-isolated-or-synthetic-non-digestible-carbohydrates-dietary
- Hiel S, Gianfrancesco MA, Rodriguez J, Portheault D, Leyrolle Q, Bindels LB, Gomes da Silveira Cauduro C, Mulders MDGH, Zamariola G, Azzi A-S, et al. Link between gut microbiota and health outcomes in inulin -treated obese patients: lessons from the Food4Gut multicenter randomized placebo-controlled trial. Clin Nutr. 2020;39(12):3618–3628. doi:10.1016/j.clnu.2020.04.005.
- Douglas GM, Maffei VJ, Zaneveld JR, Yurgel SN, Brown JR, Taylor CM, Huttenhower C, Langille MGI. PICRUSt2 for prediction of metagenome functions. Nat Biotechnol. 2020;38(6):685–688. doi:10.1038/s41587-020-0548-6.
- Johnson JS, Spakowicz DJ, Hong B-Y, Petersen LM, Demkowicz P, Chen L, Leopold SR, Hanson BM, Agresta HO, Gerstein M, et al. Evaluation of 16S rRNA gene sequencing for species and strain-level microbiome analysis. Nat Commun. 2019;10(1):5029. doi:10.1038/s41467-019-13036-1.
- Baxter NT, Schmidt AW, Venkataraman A, Kim KS, Waldron C, Schmidt TM, Blaser MJ. Dynamics of human gut microbiota and short-chain fatty acids in response to dietary interventions with three fermentable fibers. mBio. 2019;10(1):e02566–18. doi:10.1128/mBio.02566-18.
- Pascal Andreu V, Augustijn HE, Chen L, Zhernakova A, Fu J, Fischbach MA, Dodd D, Medema MH. gutSMASH predicts specialized primary metabolic pathways from the human gut microbiota. Nat Biotechnol. 2023;41(10):1416–1423. doi:10.1038/s41587-023-01675-1.
- O’Callaghan A, van Sinderen D. Bifidobacteria and their role as members of the human gut microbiota. Front Microbiol. 2016;7:925. doi:10.3389/fmicb.2016.00925.
- David LA, Maurice CF, Carmody RN, Gootenberg DB, Button JE, Wolfe BE, Ling AV, Devlin AS, Varma Y, Fischbach MA, et al. Diet rapidly and reproducibly alters the human gut microbiome. Nature. 2014;505(7484):559–563. doi:10.1038/nature12820.
- Kant R, Rasinkangas P, Satokari R, Pietilä TE, Palva A. Genome sequence of the butyrate-producing Anaerobic Bacterium Anaerostipes hadrus PEL 85. Genome Announc. 2015;3(2):e00224–15. doi:10.1128/genomeA.00224-15.
- Liu X, Mao B, Gu J, Wu J, Cui S, Wang G, Zhao J, Zhang H, Chen W. Blautia—a new functional genus with potential probiotic properties? Gut Microbes. 2021;13(1):1875796. doi:10.1080/19490976.2021.1875796.
- Parada Venegas D, De la Fuente MK, Landskron G, González MJ, Quera R, Dijkstra G, Harmsen HJM, Faber KN, Hermoso MA. Short Chain Fatty Acids (SCFAs)-mediated gut epithelial and immune regulation and its relevance for inflammatory bowel diseases. Front Immunol. 2019;10:277. doi:10.3389/fimmu.2019.00277.
- Roberfroid MB. Introducing inulin-type fructans. Br J Nutr. 2005;93(Suppl S1):S13–25. doi:10.1079/BJN20041350.
- Zhao L, Zhang F, Ding X, Wu G, Lam YY, Wang X, Fu H, Xue X, Lu C, Ma J, et al. Gut bacteria selectively promoted by dietary fibers alleviate type 2 diabetes. Sci. 2018;359(6380):1151–1156. doi:10.1126/science.aao5774.
- Johnson AJ, Vangay P, Al-Ghalith GA, Hillmann BM, Ward TL, Shields-Cutler RR, Kim AD, Shmagel AK, Syed AN, Walter J, et al. Daily sampling reveals personalized diet-microbiome associations in humans. Cell Host & Microbe. 2019;25(6):789–802.e5. doi:10.1016/j.chom.2019.05.005.
- Holmes AJ, Chew YV, Colakoglu F, Cliff JB, Klaassens E, Read MN, Solon-Biet SM, McMahon AC, Cogger VC, Ruohonen K, et al. Diet-microbiome interactions in health are controlled by intestinal nitrogen source constraints. Cell Metab. 2017;25(1):140–151. doi:10.1016/j.cmet.2016.10.021.
- Tan J, Taitz J, Sun SM, Langford L, Ni D, Macia L. Your regulatory T cells are what you eat: how diet and gut microbiota affect regulatory T cell development. Front Nutr. 2022;9:878382. doi:10.3389/fnut.2022.878382.
- Furusawa Y, Obata Y, Fukuda S, Endo TA, Nakato G, Takahashi D, Nakanishi Y, Uetake C, Kato K, Kato T, et al. Commensal microbe-derived butyrate induces the differentiation of colonic regulatory T cells. Nature. 2013;504(7480):446–450. doi:10.1038/nature12721.
- Smith PM, Howitt MR, Panikov N, Michaud M, Gallini CA, Bohlooly-Y M, Glickman JN, Garrett WS. The microbial metabolites, short-chain fatty acids, regulate colonic treg cell homeostasis. Science [Internet]. 2013;341(6145):569–573. [Accessed 2019 Jan 23]. https://www.ncbi.nlm.nih.gov/pmc/articles/PMC3807819/.
- Arifuzzaman M, Won TH, Li T-T, Yano H, Digumarthi S, Heras AF, Zhang W, Parkhurst CN, Kashyap S, Jin W-B, et al. Inulin fibre promotes microbiota-derived bile acids and type 2 inflammation. Nature. 2022;611(7936):578–584. doi:10.1038/s41586-022-05380-y.
- Bouchaud G, Castan L, Chesné J, Braza F, Aubert P, Neunlist M, Magnan A, Bodinier M. Maternal exposure to GOS/inulin mixture prevents food allergies and promotes tolerance in offspring in mice. Allergy. 2016;71(1):68–76. doi:10.1111/all.12777.
- Han K, Nam J, Xu J, Sun X, Huang X, Animasahun O, Achreja A, Jeon JH, Pursley B, Kamada N, et al. Generation of systemic antitumour immunity via the in situ modulation of the gut microbiome by an orally administered inulin gel. Nat Biomed Eng. 2021;5(11):1377–1388. doi:10.1038/s41551-021-00749-2.
- Boucher E, Plazy C, Richard ML, Suau A, Mangin I, Cornet M, Aldebert D, Toussaint B, Hannani D. Inulin prebiotic reinforces host cancer immunosurveillance via ɣδ T cell activation. Front Immunol. 2023;14:1104224. doi:10.3389/fimmu.2023.1104224.
- Singh V, Yeoh BS, Chassaing B, Xiao X, Saha P, Olvera RA, Lapek JD, Zhang L, Wang W-B, Hao S, et al. Dysregulated microbial fermentation of soluble fiber induces cholestatic liver cancer. Cell. 2018;175(3):679–694.e22. doi:10.1016/j.cell.2018.09.004.
- Armstrong HK, Bording-Jorgensen M, Santer DM, Zhang Z, Valcheva R, Rieger AM, Sung-Ho Kim J, Dijk SI, Mahmood R, Ogungbola O, et al. Unfermented β-fructan fibers fuel inflammation in select inflammatory bowel disease patients. Gastroenterology. 2023;164(2):228–240. doi:10.1053/j.gastro.2022.09.034.
- Grehan MJ, Borody TJ, Leis SM, Campbell J, Mitchell H, Wettstein A. Durable alteration of the colonic microbiota by the administration of donor fecal flora. J Clin Gastroenterol. 2010;44(8):551–561. doi:10.1097/MCG.0b013e3181e5d06b.