
ABSTRACT
Numerous studies have described the notable impact of gut microbiota on the brain in Alzheimer’s disease (AD) via the gut – brain axis. However, the molecular mechanisms underlying the involvement of gut microbiota in the development of AD are limited. This study aimed to explore the potential mechanisms of gut microbiota in AD by integrating multi-omics data. In this study, APP/PS1 and WT mice at nine months of age were used as study mouse model. Cognitive function was assessed using the Morris water maze test. The levels of Aβ plaque and neuroinflammation in the brain were detected using immunofluorescence and PET/CT. In addition, we not only used 16S rRNA gene sequencing and metabolomics to explore the variation characteristics of gut microbiota and serum metabolism abundance, but also combined spatial metabolomics and transcriptomics to explore the change in the brain and identify their potential correlation. APP/PS1 mice showed significant cognitive impairment and amyloid-β deposits in the brain. The abundance of gut microbiota was significantly changed in APP/PS1 mice, including decreased Desulfoviobrio, Enterococcus, Turicibacter, and Ruminococcus and increased Pseudomonas. The integration of serum untargeted metabolomics and brain spatial metabolomics showed that glycerophospholipid metabolism was a common alteration pathway in APP/PS1 mice. Significant proliferation and activation of astrocyte and microglia were observed in APP/PS1 mice, accompanied by alterations in immune pathways. Integration analysis and fecal microbiota transplantation (FMT) intervention revealed potential association of gut microbiota, host glycerophospholipid metabolism, and neuroinflammation levels in APP/PS1 mice.
Introduction
Alzheimer’s disease (AD), the leading type of dementia, is rapidly becoming a leading cause of death and disability worldwide this century.Citation1 To date, there are nearly 45 million people with AD worldwide, and this number is expected to triple by 2050 as the global population agesCitation2. Due to the lack of effective cure or treatment strategies for prevention, AD brings a heavy psychological and economic burden to patients, their families, and society as a whole.Citation3 Despite significant efforts in basic and clinical research, the current understanding of AD pathogenesis is still limited. Recently, numerous studies have described the notable impact between gut microbiota and brain in AD via the microbiota – gut–brain axis.Citation4–8 For example, the abundance of the gut microbiota changes dynamically with the progression of AD in APP/PS1 mice.Citation7 In our previous study, we found that patients with mild cognitive impairment (MCI) already had changes in gut microbiota abundance, similar to those seen in AD stage.Citation5 In addition, targeted regulation of the gut microbiota through fecal microbiota transplantation, antibiotic and probiotic interventions has been shown to be effective in delaying the progression of AD mouse models.Citation9–11 These studies provide an important basis for screening disease-specific gut microbiota and the optimal window period for the early diagnosis and treatment of AD from the perspective of gut microbiota.
Gut microbiota include microorganisms that live in the gastrointestinal tract, such as bacteria, fungi, and viruses. Among them, bacteria are the most predominant.Citation12 Gut microbiota can communicate with the central nervous system (CNS) through several different pathways, including immune, endocrine, neural, and metabolic pathways.Citation13 Among them, the metabolic pathway involved in the gut microbiota is an important way to affect the host.Citation14 For example, short-chain fatty acids (SCFAs) are the main metabolites produced by gut microbiota through the metabolism of indigestible dietary fibers.Citation15 SCFAs have been shown to participate in the pathological process of AD in various ways.Citation15 A recent study showed that butyrate supplementation improved quinolinic acid-induced cognitive impairment in an obesity models.Citation16 In addition, microbiota-derived indoles can ameliorate cognitive impairment and neuropathological changes and inhibit neuroinflammation through the AhR-NLRP3 pathway in APP/PS1 mice.Citation17 However, little is known about the role of metabolic pathways in the gut microbiota in AD patients.
Recently, several studies have explored the relationship between gut microbiota and metabolic pathways in APP/PS1 mice through 16S rRNA gene sequencing and metabolomics.Citation14,Citation18 However, most current studies only focus on the alteration and correlation of metabolite abundance in feces and blood, while there is a lack of research on the correlation characteristics of the spatial distribution of metabolites, gene expression levels, and pathological changes in the brains of AD. In this study, we not only used 16S rRNA gene sequencing and metabolomics to explore the variation characteristics of gut microbiota abundance and serum metabolism abundance but also combined spatial metabolomics, transcriptomics, neuroimaging, and pathology to explore the changes in the brain and identify their correlation in APP/PS1 mice. Finally, the results of the multi-omics was verified through fecal microbiota transplantation (FMT) intervention. This study provided a more direct basis for clarifying the mechanism of the microbiota-gut-brain axis in AD.
Methods
Study design
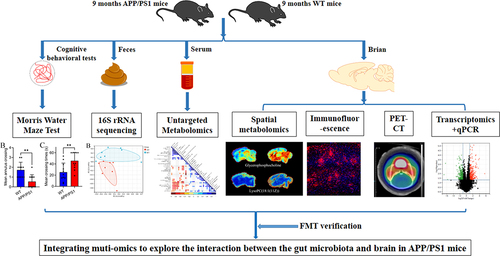
APPswe/PSEN1dE9 (APP/PS1) transgenic mice aged 9 months were used as the disease group and wild-type mice aged 9 months born in the same litter were used as the control group. The cognitive level in each group (n = 11, 5 female and 6 male) was determined using the Morris water maze test. AV45 and DPA714 PET-CT were used to detect the levels of Aβ plaques and neuroinflammation in the brains of mice (n = 3). Fecal and serum samples from each group were collected for 16S rRNA sequencing (n = 8) and untargeted metabolomic (n = 8) detection, respectively. Brain samples from each group were used for spatial metabolomics (n = 3), immunofluorescence (n = 6), transcriptomic (n = 3) and quantitative real-time PCR analysis (n = 3) detection. Multi-omics data were integrated for correlation analysis to explore the interaction between the gut microbiota and the brain in APP/PS1 mice. In order to verify the results of the multi-omics, we further selected APP/PS1 transgenic mice for FMT intervention. Twelve 7.5-month-old APP/PS1 transgenic mice (6 female and 6 male) were randomly divided into two groups: APP/PS1 control and APP/PS1FMT group (3 female and 3 male per group). After 6 weeks FMT intervention, serum and brain samples were used for untargeted metabolomic (n = 6), immunofluorescence (n = 3), and quantitative real-time PCR analysis (n = 3), respectively. The detected contents of each mouse was shown in Table S1 and .
Figure 1. Experimental design.
Experimental animal
APP/PS1 transgenic and WT C57BL/6J mice were generated by the Shanghai Model Organisms Center (Shanghai, China). The mice were housed in individual ventilation cages (specific pathogen-free, two-three mice per cage) under standard laboratory conditions (room temperature:22 ± 2°C, relative humidity at 55 ± 5%, 12:12 h light-dark cycle). All procedures involving animals were conducted according to the Institutional Guidelines and associated guidelines of the European Communities Council (86/609/ECC). The experimental protocol was approved by the Animal Ethics Committee of the School of Shanghai Model Organisms Center (authorization number:2022–0008).
Fecal 16S rRNA sequencing and processing
Each mouse was kept in a sterile cage for 24 h to collect the fecal samples. A total of 16 samples were collected for 16S rRNA gene amplicon sequencing at Shanghai Applied Protein Technology Co., Ltd. (APTBIO, Shanghai, China). First, total genomic DNA extraction from fecal samples was performed using the CTAB/SDS method. DNA was diluted to 1ng/ul according to its concentration. The 16S rDNA V3–4 region was amplified using the Applied Biosystems® PCR System 9700. The primer sequences were as follows: Primer 5′-3′:357F (5’-ACTCCTACGGRAGGCAGCAG-3’) and 806 R (5’-GGACTACHVGGGTWTCTAAT-3’). The PCR products were subjected to electrophoresis on a 2% agarose gel for detection and purified using an AxyPrepDNA Gel Extraction Kit (AXYGEN, USA). Library quality was assessed on a Qubit @ 2.0 Fluorometer (Thermo Scientific, USA) and Agilent Bioanalyzer 2100 system. Finally, the Illumina Miseq/HiSeq 2500 platform (NEB, USA) was used to sequence the sample DNA, followed by bioinformatic analysis. Sequence quality control adopted Trimmomatic (version: 0.38) software to remove low quality by window. According to the overlap between PEreads, the FLASH software (version: 1.2.11) merged pairs of reads into a sequence.Citation19 The minimum overlap length was 10bp, the maximum mismatch ratio allowed by the overlap of the concatenated sequence was 0.2. After filtering low-quality data, the UPARSE package was used to cluster the sequences with at least 97% similarity as the same operational taxonomic units (OTUs).Citation20 The Ribosomal Database Project (RDP) was applied to annotate the representative sequences for each OUT.Citation21 The α-diversity and β-diversity indices were calculated based on the OTU counts. Differential abundance analysis of gut microbiota at genus levels was performed through the Wilcoxon rank-sum test.
Preparation of donor gut microbiota suspension
The donor fresh fecal pellets was selected from age-sex matched WT mice. The fresh fecal pellets were diluted with sterile PBS for approximately 15 min (20 mg fecal pellet/ml). Then the mixture was shaken at 4°C for 5 min. After that, the bacterial suspension was obtained through centrifuging at 8000 rpm and 4°C for 5 min and filtering twice in PBS. The bacterial suspension was mixed with an equal volume of 40% sterile glycerol and then stored at − 80°C until transplantation.Citation22,Citation23
FMT intervention
Before the FMT intervention, APP/PS1 mice were treated with broad-spectrum antibiotics (ABX: ampicillin 1 g/L, HY-B0522, MedChemExpress, USA; neomycin sulfate 1 g/L, HY-B0470, MedChemExpress, USA; metronidazole 1 g/L, HY-B0318, MedChemExpress, USA) in drinking water for 2 weeks to deplete the gut microbiota, which can kill > 90% of the gut microbiotaCitation24–26 Stop antibiotics treatment three days before FMT. During FMT intervention, each mouse in APP/PS1 FMT group was given 100 ul of donor gut microbiota suspension, while the APP/PS1 control group was given the same amount of glycerol/PBS solution for 14 consecutive days. After two weeks of gut microbiota colonization, two groups were used for follow-up study. The process of FMT intervention was shown in .
Morris water maze (MWM) test
The spatial memory ability of APP/PS1 and WT mice was assessed at 9 months of age using the Morris water maze test. The standardized Morris water maze test was described in a previous studyCitation27. Briefly, the mice were placed in rooms 24 hours in advance to acclimatize before starting the experiment. Each mouse was trained to search for the platform within 60 s in each of the four quadrants of the pool for five consecutive days. On the sixth day, the platform in the pool was removed for testing. Each mouse was allowed to swim in the pool for 60 seconds to explore the platform position. Each mouse’s trajectory for every training and testing in the pool was recorded using water maze software for analysis.
Micro-PET/CT imaging of 18F-DPA714 and 18F-AV45
Micro-PET/CT Imaging was performed using the Inveon MM Platform (Siemens Preclinical Solutions, Knoxville, Tennessee, USA). APP/PS1 and WT mice (n = 3) were injected with 18F-DPA714 (5 ± 1 MBq) or 18F-AV45 (5 ± 1 MBq), respectively, through the tail vein. 18F-DPA714 is a ligand for TSPO that reflects the level of neuroinflammation in the brain. 8F-AV45 is ligand of Aβ and can be used to detect the pathological load of Aβ in the brain.Citation28 One hour after the injection, 10-minute static PET and CT scans were acquired. The mice were placed prone on the PET scanner bed near the center field of view and anesthetized with 1.5% isoflurane in oxygen at a flow of 1 L/min. The scanning procedure was performed using an Inveon Acquisition Workplace (IAW) 1.5.0.28. The images were reconstructed through the OSEM3D (Three-Dimensional Ordered Subsets Expectation Maximum) algorithm followed by MAP (Maximization/Maximum a Posteriori) or FastMAP provided by IAW. The Inveon Research Workplace (IRW) software v3.0, was used to process the final brain images. The 3D regions of interest (ROIs) of the brain were drawn and standardized uptake values (SUV) were calculated.
Untargeted metabolomic analysis of serum
Liquid Chromatography Triple Quadrupole Mass Spectrometer (LC-MS/MS) was used for the untargeted metabolomic analysis of serum at APTBIO. To extract metabolites from serum samples of APP/PS1 and WT mice, 100 mg of the sample was added to 400 μL of cold extraction solvent methanol/acetonitrile/H2O (2:2:1, v/v/v), and adequately vortexed. After resting on ice for 20 min, the mixture was centrifuged at 4°C and 14,000 × g for 20 min. The supernatant was collected and dried using a vacuum centrifuge at 4°C. For LC-MS analysis, the samples were re-dissolved in 100 μL of an acetonitrile/water (1:1, v/v) solvent. The extracts were separated by Agilent 1290 Infinity LC ultra-high-performance liquid chromatography (UHPLC). Primary and secondary spectra were collected using a quadrupole time-of-flight mass spectrometer (Sciex TripleTOF 6600). Raw data were converted into MzXML files using ProteoWizard. The data were then imported into the XCMS software (Scripps Research Institute, La Jolla, USA) for peak picking, peak grouping, and extracted ion features. Identification of metabolites by MS/MS using an in-house database established with authentic standards. Principal Component Analysis (PCA) was applied to distinguish the characteristics of metabolite differences between the two groups. The unpaired Student’s t-test was used to determine significance. The variable influence on projection (VIP) > 1 and p <.05 was set as significantly different metabolites. Kyoto Encyclopedia of Genes and Genomes (KEGG) enrichment analysis of different metabolites was performed using MetaboAnalyst (https://www.metaboanalyst.ca/).Citation20
Spatial metabolomics analysis of brain
Mass spectrometry imaging (MSI) was applied to spatial metabolomic analysis of the brain at APTBIO. Briefly, fresh brain tissue was sliced at a thickness of 20um at −20°C using a Leica CM1950 cryostat (Leica Microsystems GmbH, Wetzlar, Germany). Brain slice samples were imaged using a timsTOF fleX MALDI 2 (Bruker) equipped with a 10 kHz smartbeam 3D laser. MSI data were analyzed using the SCiLS Lab software (version 2021c premium, Bruker Daltonics, Billerica, MA, USA) with Root Mean Square normalization. Metabolites were identified by comparing the accuracy of the m/z value (<10 ppm) with the in-house database and the Bruker Library MS-Metabobase 3.0 database. Principal Component Analysis (PCA) was applied to distinguish the characteristics of metabolite differences between the two groups. The unpaired Student’s t-test was used to determine significance. The VIP > 1 and p <.05 was set as significantly different metabolites. Kyoto Encyclopedia of Genes and Genomes (KEGG) enrichment analysis of different metabolites was performed using MetaboAnalyst (https://www.metaboanalyst.ca/).Citation29
Transcriptomic analysis of brain
Total RNA was extracted from the brain using TRIzol Reagent (ThermoFisher, USA). Library preparation and transcriptome sequencing were performed using APTBIO. A total of 1 μg of RNA from each sample was used to construct the library using an ABclonal mRNA-seq Lib Prep Kit, following the manufacturer’s protocol. PCR products were purified using the AMPure XP system. Library quality was assessed using an Agilent Bioanalyzer 4150 system. Finally, the library preparations were sequenced on an Illumina Novaseq 6000 (or MGISEQ-T7), and 150 bp paired-end reads were generated. The generated raw data were used for bioinformatic analysis using an in-house pipeline from Shanghai Applied Protein Technology. The major software and parameters were showed as follows. First of all, quality control was performed. The raw data of fastq format was firstly processed through in-house perl scripts. After removing the adapter sequence, the low quality and N ratio > 5% reads were filtered out to obtain clean reads. Then clean reads were separately aligned to reference genome with orientation mode through HISAT2 software (http://daehwankimlab.github.io/hisat2/) to obtain mapped readsCitation30. Mus_musculus_Ensembl_104 was selected as the reference genome. The total samples resulted in 286,631,804 clean reads with an average of 47,771,967 ± 5,474,691.2 clean tags per sample. Feature Counts (http://subread.sourceforge.net/) was applied to count the reads numbers mapped to each gene. After that, FPKM of each gene was calculated based on the length of the gene and reads count mapped to this gene. Differential expression analysis between APP/PS1 and WT mice were analyzed by the “DESeq2” R package. |log2FC| > 1 and p < .05 were considered statistically significant. WikiPathway enrichment and protein-protein interaction analyses of differentially expressed genes were performed using the STRING database (https://cn.string-db.org/). When p <.05, it is considered that the WikiPathway enrichment was significantly enriched. The cytoHubba plugin in Cytoscape was used to select hub differentially expressed genes, which was a gene that played an important role in the biological process.
Immunofluorescence assay
Immunofluorescence assays were performed as previously described.Citation8 After washing with PBS, 30 μm mouse brain slices were soaked in PBS containing 0.5% Triton X-100 (PBS-T) for 30 min. The brain slices were then blocked with 10% goat serum and 0.5% Triton X-100 in PBS for 1 h at room temperature. Next, brain slices were incubated with primary antibodies [Neu N (Abcam, UK, ab177487), GFAP (Cell Signaling Technology, USA 80,788), 4G8 (BioLegend, USA 800,709), TMEM119 (Abcam, UK, ab209064)] overnight at 4°C. The next day, brain slices were incubated with fluorescently labeled secondary antibodies and DAPI for 2 h at room temperature. After washing with PBST for five times, the brain slices were sealed with an anti-quench sealing tablet. Images were captured using a microscope (BX60, Olympus, Tokyo, Japan). The fluorescence intensity was analyzed using the ImageJ software.
Quantitative real-time PCR analysis
Total RNA was extracted and purified through RNAeasy™ Animal RNA Isolation Kit with Spin Column (R0026, Beyotime, China). Total RNA was used for reverse transcription into c.DNA through a PrimerScript RT Reagent kit at 55°C for 15 min (RK20429, Abclonal, China). Finally, the mRNA expression of target genes was measured by real-time PCR through 2 × Universal SYBR Green Fast qPCR Mix (RK21203, Abclonal, China). The GAPDH expression level was used as internal reference. The 2(−ΔΔCt) method was applied to calculate the expression level of the target genes. Primer sequences were provided in Table S2.
Statistical analysis
Data are presented as mean ± SD. A two-tailed Student’s t-test or Wilcoxon Mann Whitney test was used to compare the data between the two groups. The correlation between gut microbiota and serum glycerophospholipid metabolism-related metabolites/brain glycerophospholipid metabolism-related metabolites and hub gene expression level were analyzed by Spearman analysis, and corrected by Benjamini-Hochberg method. The data were analyzed using GraphPad Prism 9.0, or R software.
Result
Cognitive behavioral and pathological features in APP/PS1 mice
Differences in cognitive levels between APP/PS1 transgenic mice and WT mice were detected using the Morris water maze test. During the training period from day one to day five, the APP/PS1 mice group showed extended escape latency of platform searching compared with the WT group (). On the sixth day of the test period, the hidden platform was removed from the water to measure the spatial memory ability of both groups. During the 60-second detection period, the APP/PS1 mice group showed decreased mean crossing times and increased escape latency for the first crossing of the platform compared with the WT group (). There was no statistical difference between the two groups in total swimming distance and average swimming speed within 60 s ().
Figure 2. Cognitive level and neuropathology in APP/PS1 and WT mice.
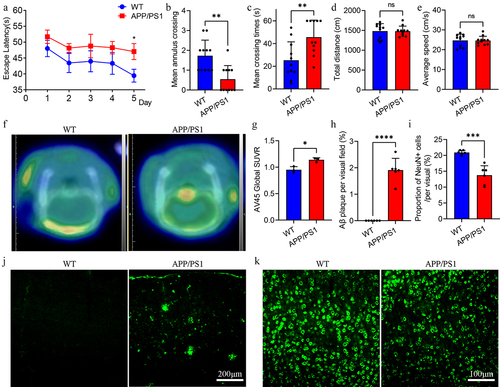
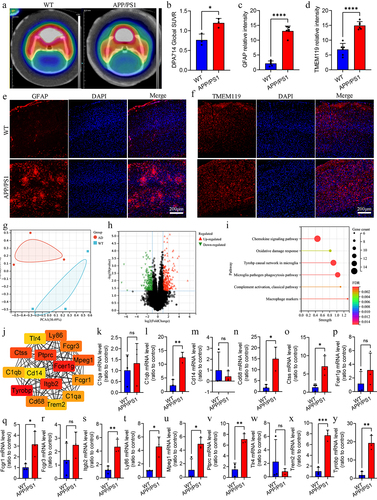
In addition, PET-CT and immunofluorescence techniques were used to detect the pathological levels of Aβ and neuroinflammation in the brains of the two groups. PET-CT results showed that APP/PS1 mice had higher AV45 uptake than WT mice, suggesting a higher Aβ load in the brains of APP/PS1 (). Similarly, immunofluorescence results demonstrated significant Aβ plaque deposition in the brains of APP/PS1 mice but not in WT mice (). In addition, NeuN immunofluorescence was used to label cortical neurons to compare differences in the number of neurons between the two groups. The results revealed that the number of neurons in the cortex of the APP/PS1 mice group was lower than that in the WT group (). In general, APP/PS1 mice at the age of 9 months present with typical cognitive impairment and pathological changes in AD.
Difference of gut microbiota abundance between APP/PS1 and WT mice
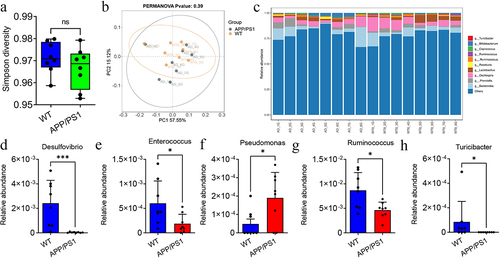
To investigate the differences in gut microbiota abundance between APP/PS1 and WT mice, fecal samples from the two groups were collected for 16S rRNA detection. Simpson diversity showed no significant difference in the α diversity of the gut microbiota between APP/PS1 and WT mice (). PCoA analysis showed no significant difference in β diversity between APP/PS1 and WT mice (). Therefore, we further compared the differences in the gut microbiota at the genus level between the APP/PS1 and WT mice (). There was a decreased abundance of Desulfovibrio, Enterococcus, Turicibacter, and Ruminococcus in the APP/PS1 mice group compared with the WT group (). There was an increased abundance of Pseudomonas in the APP/PS1 group ().
Figure 3. The difference of gut microbiota between APP/PS1 and WT mice.
Difference of metabolites in serum and brain tissue between APP/PS1 and WT mice
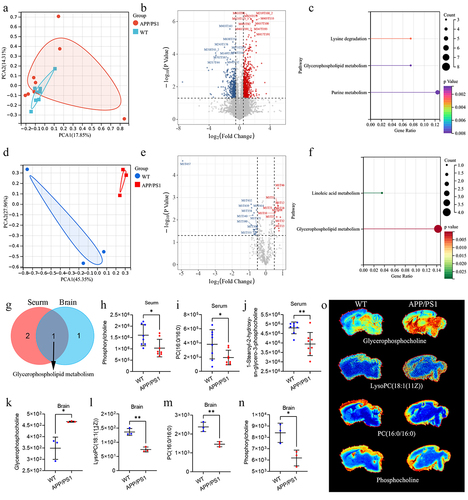
To further explore the metabolic pathways between APP/PS1 and WT mice, untargeted metabolomic and spatial metabolomics were used to detect metabolic changes in serum and brain tissue, respectively. In the serum, we first constructed the PCA analysis and found that the serum metabolomics of APP/PS1 mice was different from that of WT mice (). Under the screening threshold of VIP > 1 and p <.05, we identified 40 metabolites with significant differences in the serum between APP/PS1 and WT mice (). Enrichment analysis revealed that these metabolites were enriched in lysine degradation, glycerophospholipid metabolism, and purine metabolism (). Similarly, the PCA analysis based on spatial metabolomics of the brain tissue showed significant differences in metabolic characteristics between APP/PS1 and WT mice (). In addition, total different 28 kinds of metabolites were identified between APP/PS1 and WT under the screening threshold of VIP > 1 and p <.05, respectively (). These metabolites were enriched in linoleic acid and glycerophospholipid metabolism (). It is noteworthy that the glycerophospholipid metabolism were common differential metabolic pathways in the brain tissue and serum (). In the serum, metabolites associated with glycerophospholipid metabolism include phosphorylcholine, PC (16:0/16:0), and 1-stearoyl-2-hydroxy-sn-glycero-3-phosphocholine. They were all decreased in the serum of APP/PS1 mice (). In the brain, metabolites associated with glycerophospholipid metabolism include glycerophosphocholine, lysoPC(18:1(11Z)), PC (16:0/16:0), and phosphorylcholine. There were increased levels of glycerophosphocholine and decreased levels of lysoPC(18:1(11Z), PC (16:0/16:0), and phosphorylcholine levels in the brains of APP/PS1 mice compared with WT mice (). These results demonstrated that the glycerophospholipid metabolism may play a critical role in mediating the interaction between the gut microbiota and the brain in APP/PS1 mice.
Figure 4. The difference of metabolites in serum and brain of APP/PS1 and WT mice.
Glia-mediated neuroinflammation and immune signaling pathway in APP/PS1 mice
Recently, glia-mediated neuroinflammation in AD has attracted considerable attention. It is also an important pathway that mediates the involvement of gut microbiota in the progression of AD. First, we measured the total level of neuroinflammation in the brains of APP/PS1 and WT mice using 18F-DPA714 PET-CT. The results showed that there was a higher uptake of 18F-DPA714 in the brains of APP/PS1 mice than in WT mice, suggesting a higher level of neuroinflammation in the brains of APP/PS1 mice (). We further detected changes in glial cells in the brains of APP/PS1 and WT mice at the cellular level by immunofluorescence. We found obvious proliferation and activation of astrocyte and microglia in the brains of APP/PS1 mice (). At the molecular level, we analyzed gene expression differences in the brains of APP/PS1 and WT mice using RNA sequencing. PCA showed significant difference in gene expression patterns between APP/PS1 and WT mice (). Under the screening threshold of |log2 (FC)|>1 and p <.05, we screened 269 up-regulated expression genes and 215 downregulated expression genes in the brains of APP/PS1 mice compared with WT mice (). WikiPathway enrichment analysis showed that they were mainly associated with chemokine signaling pathway, oxidative damage response, tyrobp causal network in microglia, and microglia pathogen phagocytosis pathway (). The top 15 hub genes were Tlr4, Ctss, C1qb, Tyrobp, Cd68, Trem2, C1qa, Fcgr1, Mpeg1, Fcgr3, Ly86, Ptprc, Cd14, Itgb2, and Fcer1g (). We further verified the expression level of hub gene through quantitative real-time PCR analysis. The expression level of Ctss, C1qb, Tyrobp, Cd68, Trem2, Mpeg1, Fcgr1, Ly86, Ptprc, and Itgb2 were significantly different between the two groups, while C1qa, Cd14, Fcer1g, Fcegr3, and Tlr4 were no difference (). Overall, glia-mediated immune signaling pathway changes were an important characteristic of the brains of APP/PS1 mice.
Figure 5. Difference analysis of neuroinflammation and signaling pathway in APP/PS1 and WT mice.
Comprehensive analysis of different gut microbiota, metabolites, and differentially expressed genes
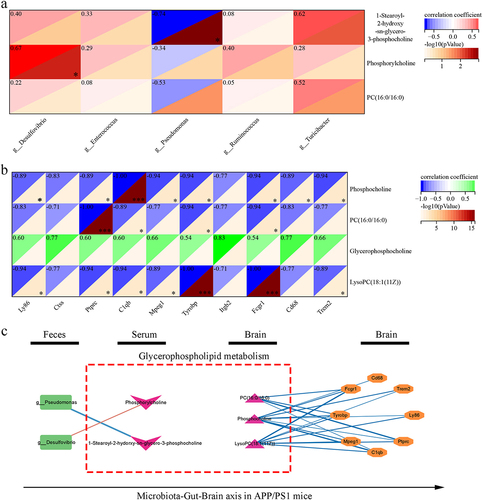
To further explore the association between differential gut microbiota, metabolites, and differential gene expression levels, we explored the correlation between them. Analysis of differential metabolites related to glycerophospholipid metabolism in serum and differences in gut microbiota at the genus level showed that the level of 1-stearoyl-2-hydroxy-sn-glycero-3-phosphocholine in serum was negatively correlated with the abundance of Pseudomonas (r = −0.74, adj p =.016) (). The phosphorylcholine in serum was positively correlated with the abundance of Desulfovibrio (r = 0.67, adj p = .032) (). In the brain, we explored the correlation between the expression levels of hub differentially expressed genes and glycerophospholipid metabolism-related differential metabolites (). The level of phosphorylcholine in the brain was negatively correlated with the expression of Ly86 (r = −0.89, adj p = 0.040), Ptprc (r = −0.89, p =.040), C1qb (r = −1.00, adj p <.001), Mpeg1 (r = −0.94, adj p =.015), Tyrobp (r = −0.94, adj p =.015), Fcgr1 (r = −0.94, adj p = 0.015), Cd68 (r = −0.89, adj p =.040), and Trem2 (r = −0.94, adj p =.015) (). The levels of PC (16:0/16:0) in the brain were negatively correlated with the expression levels of Ptprc (r = −1.00, adj p <.001), C1qb (r = −0.89, adj p =.040), Tyrobp (r = −0.94, adj p =.015), and Fcgr1 (r = −0.94, adj p =.015) (). The levels of lysoPC(18:1(11Z)) in the brain were positively correlated with the expression levels of Ly86 (r = −0.94, adj p =.015), Ptprc (r = −0.89, p =.040), C1qb (r = −0.94, adj p =.015), Mpeg1 (r = −0.89, adj p = 0.040), Tyrobp (r = −1.00, adj p < 0.001), Fcgr1 (r = −1.00, adj p <.001),, and Trem2 (r = −0.89, adj p =.040) (). The correlation network is shown in .
Figure 6. Correlation analysis of different gut microbiota, metabolites and hub differently expressed genes.
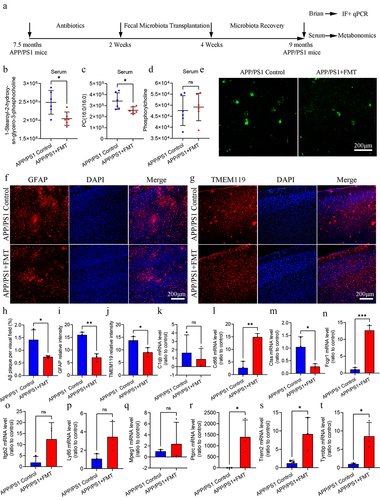
FMT intervention regulated glycerophospholipid metabolism and ameliorated Aβ pathology and neuroinflammation in APP/PS1 mice
In this part, we further used FMT intervention to verify the multi-omics results. We found that FMT intervention can reduce the 1-stearoyl-2-hydroxy-sn-glycero-3-phosphocholine and PC (16:0/16:0) level in serum of APP/PS1 mice, without change of phosphocholine level, indicating that FMT intervention partially regulated the glycerophospholipid metabolism in APP/PS1 mice (). In brain, there was decreased Aβ plaque, proliferation and activation of astrocyte and microglia in FMT group (). In addition, we further detected the expression level of hub different expression genes in brain. The result showed that FMT intervention can regulate the expression of Cd68, Ctss, Fcrg1, Ptprc, Trem2, and Tyrobp, without influencing the expression of C1qb, Itgb2, Ly86, and Mpeg1 (). Based on the above findings, we confirmed the potential regulatory role of gut microbiota on glycerophospholipid metabolism and neuroinflammation in APP/PS1 mice.
Figure 7. FMT intervention regulated glycerophospholipid metabolism and ameliorated Aβ pathology and neuroinflammation in APP/PS1 mice.
Discussion
Recent studies have demonstrated the important role of bidirectional communication between the gut and the brain in the occurrence and progression of AD. Specifically, both AD and MCI patients showed dysbiosis of the gut microbiota.Citation5,Citation18 Several intervention strategies targeting the gut microbiota have also shown better efficacy in delaying the progression of AD.Citation11,Citation31,Citation32 However, due to the complex interaction between the gut microbiota-gut–brain axis, the underlying molecular mechanisms between gut microbiota and AD have not been clearly elucidated until now. In this study, we observed that APP/PS1 mice were characterized by alterations in the gut microbiota, metabolic pathways in the serum and brain, and neuroinflammation signaling pathways in the brain.
Dysbiosis of the gut microbiota has been extensively reported in AD mouse models and patients.Citation6,Citation7,Citation18,Citation33,Citation34 In this study, we also found changes in the gut microbiota at the genus level in APP/PS1 mice at 9 months of age compared to WT mice, including decreased Desulfoviobrio, Enterococcus, Turicibacter, and Ruminococcus, and increased Pseudomonas. In a study of preclinical AD, decreased genera Enterococcus levels were found in Aβ+ CN compared to Aβ− CNCitation35. However, an increased abundance of the genus Enterococcus was found in AD patientsCitation36. In addition, a decreased abundance of Turicibacter was observed in 5×fAD at 18 months of age.Citation37 In the Tgf344 AD rat model, decreased Ruminococcus was observed at 14 months of age,Citation33 which is consistent with the results of this study. Moreover, previous studies have shown that Pseudomonas aeruginosa infection can promote neuronal tauopathy and Aβ amyloidosis.Citation38,Citation39 Furthermore, we found that alterations in gut microbiota were associated with abnormal glycerophospholipid metabolism.
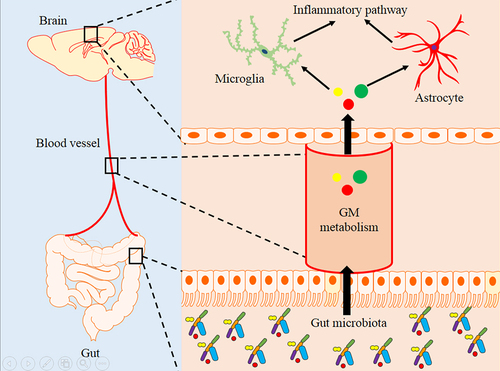
Figure 8. The diagram of the hypothesis model in this study.
Glycerophospholipids (GPLs) are the major components of eukaryotic cellular membranes.Citation40 PC and phosphatidylethanolamine (PE) are the most abundant GPLs in the eukaryotic cellular membranes. PC accounts for approximately 95% of total choline in most tissues.Citation40 PE is the second-most abundant GPLs in eukaryotic cells.Citation40 Other minor phospholipid species, such as phosphatidylinositol (PI) and phosphatidylserine (PS), are also part of the biological membranes.Citation40 Previous studies have shown that GPLs played an important role in apoptosis by regulating cellular signaling, epigenetic mechanisms, and membrane trafficking.Citation40–42 In the CNS, GPLs are the major components of the neuronal membranes and myelin. However, the primary source of synthetic brain neural membrane GLPs is the gastrointestinal tract.Citation43 This also suggests an important role for the gut microbiota in glycerophospholipid metabolism. Recently, several studies have demonstrated that the disturbance of glycerophospholipid metabolism was associated with the gut microbiota-brain axis in depression.Citation43–45 In this study, we integrated the metabolomics of the serum and brain between APP/PS1 and WT mice and found a significant difference in glycerophospholipid metabolism. In addition, FMT intervention can regulate glycerophospholipid metabolism in APP/PS1 mice. In a study based on mass spectrometry imaging techniques, abnormal glycerophospholipid metabolism was implicated in APP/PS1 mice at 2 and 3 months of age.Citation46 Similarly, a targeted metabolomics study also revealed abnormal glycerophospholipid metabolism in the hippocampus of 3×Tg-AD male mice at 2 and 6 months of age.Citation47 Combined with our results, abnormal glycerophospholipid metabolism may be an early pathological process of AD that promotes the occurrence and development of AD.
Central and peripheral immune dysfunction have recently been identified as an important process that promotes the occurrence and development of AD.Citation48–50 In this study, we observed the activation and proliferation of glial cells in APP/PS1 mice, accompanied by changes in a series of immune signaling pathways. More importantly, the immune signaling pathway is currently considered to be one of the most important pathways mediating communication between gut microbiota and the brain.Citation4,Citation51–53 A recent study has confirmed that the transformation of microglial subpopulations was modulated by the gut microbiome.Citation54 Nevertheless, our understanding of the regulation of microglia-mediated neuroinflammation by gut microbiota is limited. In this study, we found that glycerophospholipid metabolism may be an important pathway mediating gut microbiota in microglia-mediated neuroinflammation in APP/PS1 mice. In a previous study, the result identified as potential inflammatory mediators that participate in systemic immune and low-grade inflammatory states in generally healthy adults.Citation55,Citation56 In atherosclerosis, glycerophospholipid metabolism is associated with the occurrence of atherosclerotic inflammation.Citation57 However, the mechanism of glycerophospholipid metabolism in the regulation of inflammation in the CNS remains unclear and needs further exploration.
This study had some limitations. First, the present study observed the characteristics of the gut microbiota – gut–brain axis in APP/PS1 mice at 9 months of age; however, longitudinal changes in the gut microbiota – gut–brain axis in APP/PS1 mice were lacking. More importantly, this study was limited to an AD mouse model and has not yet been confirmed in patients with AD. APP/PS1 mice can’t recapitulate all of the cognitive deficits observed in AD patients.Citation58 In addition, APP/PS1 mice can only imitate the amyloid and/or tau pathology without fully recapitulate the AD phenotype.Citation59 In future studies, we will conduct relevant in-depth research on these limitations.
In general, integrating these multi-omics results, we characterized the abundance of altered gut microbiota, glycerophospholipid metabolism in the serum and brain, and neuroinflammatory pathways in the brain of the APP/PS1 AD mouse model. FMT intervention verified the correlation between gut microbiota, host glycerophospholipid metabolism and neuroinflammatory pathways in APP/PS1 mice (). Our results can promote the understanding of the relationship between the gut microbiota and AD.
Authors’ contributions
Qian XH and Hai WX performed the experiments, analyzed the data, and wrote the original manuscript. Chen SY and Zhang M assisted with the experiments and data analysis. Tang HD, Jiang XF, and Zhang M designed and guided the study, provided comments, and revised the paper. All authors have read and approved the final manuscript.
Availability of data and materials
The datasets generated in this study are available in the Figshare (https://figshare.com/s/d5c17763056c6db5ebd5). All other data are available from the authors upon reasonable request.
Ethics approval and consent to participate
The experimental protocol was approved by the Animal Ethics Committee of the School of Shanghai Model Organisms Center (authorization number: 2022–0008).
Supplemental Material
Download Zip (28.2 KB)Acknowledgments
We sincerely appreciate the technical support provided by Shanghai Applied Protein Technology Co., Ltd., for this study.
Disclosure statement
No potential conflict of interest was reported by the author(s).
Supplementary material
Supplemental data for this article can be accessed online at https://doi.org/10.1080/19490976.2023.2282790
Additional information
Funding
References
- 2023 Alzheimer’s disease facts and figures. Alzheimer’s & dementia : J Alzheimer’s Assoc. 2023;19(4):1598–18. doi:10.1002/alz.13016.
- Susmitha G, Kumar R. Role of microbial dysbiosis in the pathogenesis of Alzheimer’s disease. Neuropharmacology. 2023;229:109478. doi:10.1016/j.neuropharm.2023.109478.
- Scheltens P, De Strooper B, Kivipelto M, Holstege H, Chételat G, Teunissen CE, Cummings J, van der Flier, WM. Alzheimer’s disease. Lancet. 2021;397:1577–1590. doi:10.1016/S0140-6736(20)32205-4.
- Qian XH, Song XX, Liu XL, Chen SD, Tang HD. Inflammatory pathways in Alzheimer’s disease mediated by gut microbiota. Ageing Res Rev. 2021;68:101317. doi:10.1016/j.arr.2021.101317.
- Li B, He Y, Ma J, Huang P, Du J, Cao L, Wang Y, Xiao Q, Tang H, Chen S. Mild cognitive impairment has similar alterations as Alzheimer’s disease in gut microbiota. Alzheimer’s & dementia : J Alzheimer’s Assoc. 2019;15:1357–1366. doi:10.1016/j.jalz.2019.07.002.
- Borsom EM, Conn K, Keefe CR, Herman C, Orsini GM, Hirsch AH, Palma Avila M, Testo G, Jaramillo SA, Bolyen E, et al. Predicting neurodegenerative disease using prepathology gut microbiota composition: a longitudinal study in mice modeling Alzheimer’s disease pathologies. Microbiol Spectr. 2023;11(2):e0345822. doi:10.1128/spectrum.03458-22.
- Li Y, Chen Y, Fan Y, Chen Y, Chen Y. Dynamic network modeling of gut microbiota during Alzheimer’s disease progression in mice. Gut Microbes. 2023;15(1):2172672. doi:10.1080/19490976.2023.2172672.
- Qian XH, Liu XL, Chen G, Chen SD, Tang HD. Injection of amyloid-β to lateral ventricle induces gut microbiota dysbiosis in association with inhibition of cholinergic anti-inflammatory pathways in Alzheimer’s disease. J Neuroinflammation. 2022;19(1):236. doi:10.1186/s12974-022-02599-4.
- Zhu G, Zhao J, Wang G, Chen W. Bifidobacterium breve HNXY26M4 attenuates cognitive deficits and neuroinflammation by regulating the gut–brain axis in APP/PS1 mice. J Agr Food Chem. 2023;71(11):4646–4655. doi:10.1021/acs.jafc.3c00652.
- Wang M, Cao J, Gong C, Amakye WK, Yao M, Ren J. Exploring the microbiota-Alzheimer’s disease linkage using short-term antibiotic treatment followed by fecal microbiota transplantation. Brain Behav Immun. 2021;96:227–238. doi:10.1016/j.bbi.2021.06.003.
- Kim MS, Kim Y, Choi H, Kim W, Park S, Lee D, Kim DK, Kim HJ, Choi H, Hyun D-W, et al. Transfer of a healthy microbiota reduces amyloid and tau pathology in an Alzheimer’s disease animal model. Gut. 2020;69(2):283–294. doi:10.1136/gutjnl-2018-317431.
- Nguyen NM, Cho J, Lee C. Gut microbiota and Alzheimer’s disease: how to study and apply their relationship. Int J Mol Sci. 2023;24(4):24. doi:10.3390/ijms24044047.
- Collins SM, Surette M, Bercik P. The interplay between the intestinal microbiota and the brain. Nat Rev Microbiol. 2012;10(11):735–742. doi:10.1038/nrmicro2876.
- Feng M, Hou T, Zhou M, Cen Q, Yi T, Bai J, Zeng Y, Liu Q, Zhang C, Zhang Y, et al. Gut microbiota may be involved in Alzheimer’s disease pathology by dysregulating pyrimidine metabolism in APP/PS1 mice. Front Aging Neurosci. 2022;14:967747. doi:10.3389/fnagi.2022.967747.
- Qian XH, Xie RY, Liu XL, Chen SD, Tang HD. Mechanisms of short-chain fatty acids derived from gut microbiota in Alzheimer’s disease. Aging Dis. 2022;13(4):1252–1266. doi:10.14336/AD.2021.1215.
- Ge X, Zheng M, Hu M, Fang X, Geng D, Liu S, Wang L, Zhang J, Guan L, Zheng P, et al. Butyrate ameliorates quinolinic acid–induced cognitive decline in obesity models. J Clin Invest. 2023;133(4). doi:10.1172/JCI154612.
- Sun J, Zhang Y, Kong Y, Ye T, Yu Q, Kumaran Satyanarayanan S, Su K-P, Liu J. Microbiota-derived metabolite Indoles induced aryl hydrocarbon receptor activation and inhibited neuroinflammation in APP/PS1 mice. Brain, Behavior, And Immunity. 2022;106:76–88. doi:10.1016/j.bbi.2022.08.003.
- Zhu Z, Ma X, Wu J, Xiao Z, Wu W, Ding S, Zheng L, Liang X, Luo J, Ding D, et al. Altered gut microbiota and its clinical relevance in mild cognitive impairment and Alzheimer’s disease: Shanghai Aging study and Shanghai memory study. Nutrients. 2022;14(19):14. doi:10.3390/nu14193959.
- Magoč T, Salzberg SL. FLASH: fast length adjustment of short reads to improve genome assemblies. Bioinform (Oxford, England). 2011;27(21):2957–2963. doi:10.1093/bioinformatics/btr507.
- Edgar RC. UPARSE: highly accurate OTU sequences from microbial amplicon reads. Nat Methods. 2013;10(10):996–998. doi:10.1038/nmeth.2604.
- Wang Q, Garrity GM, Tiedje JM, Cole JR. Naive bayesian classifier for rapid assignment of rRNA sequences into the new bacterial taxonomy. Appl Environ Microb. 2007;73(16):5261–5267. doi:10.1128/AEM.00062-07.
- Hou YF, Shan C, Zhuang SY, Zhuang QQ, Ghosh A, Zhu KC, Kong X-K, Wang S-M, Gong Y-L, Yang Y-Y, et al. Gut microbiota-derived propionate mediates the neuroprotective effect of osteocalcin in a mouse model of Parkinson’s disease. Microbiome. 2021;9(1):34. doi:10.1186/s40168-020-00988-6.
- Hamilton MJ, Weingarden AR, Sadowsky MJ, Khoruts A. Standardized frozen preparation for transplantation of fecal microbiota for recurrent Clostridium difficile infection. Am J Gastroenterol. 2012;107(5):761–767. doi:10.1038/ajg.2011.482.
- Pu Y, Tan Y, Qu Y, Chang L, Wang S, Wei Y, Wang X, Hashimoto K. A role of the subdiaphragmatic vagus nerve in depression-like phenotypes in mice after fecal microbiota transplantation from Chrna7 knock-out mice with depression-like phenotypes. Brain Behav Immun. 2021;94:318–326. doi:10.1016/j.bbi.2020.12.032.
- Hernández-Chirlaque C, Aranda CJ, Ocón B, Capitán-Cañadas F, Ortega-González M, Carrero JJ, Suárez MD, Zarzuelo A, Sánchez de Medina F, Martínez-Augustin O, et al. Germ-free and antibiotic-treated mice are highly susceptible to epithelial injury in DSS colitis. J Crohn’s Colitis. 2016;10(11):1324–1335. doi:10.1093/ecco-jcc/jjw096.
- Zhan G, Yang N, Li S, Huang N, Fang X, Zhang J, Zhu B, Yang L, Yang C, Luo A, et al. Abnormal gut microbiota composition contributes to cognitive dysfunction in SAMP8 mice. Aging. 2018;10(6):1257–1267. doi:10.18632/aging.101464.
- Zhao P, Qian X, Nie Y, Sun N, Wang Z, Wu J, Wei C, Ma R, Wang Z, Chai G, et al. Neuropeptide S ameliorates cognitive impairment of APP/PS1 transgenic mice by promoting synaptic plasticity and reducing Aβ deposition. Front Behav Neurosci. 2019;13:138. doi:10.3389/fnbeh.2019.00138.
- Zhang M, Qian XH, Hu J, Zhang Y, Lin X, Hai W, Shi K, Jiang X, Li Y, Tang H-D, et al. Integrating TSPO PET imaging and transcriptomics to unveil the role of neuroinflammation and amyloid-β deposition in Alzheimer’s disease. Eur J Nucl Med Mol Imaging. 2023;1–13. doi:10.1007/s00259-023-06446-3.
- Xia J, Psychogios N, Young N, Wishart DS. MetaboAnalyst: a web server for metabolomic data analysis and interpretation. Nucleic Acids Res. 2009;37(Web Server):W652–60. doi:10.1093/nar/gkp356.
- Pertea M, Kim D, Pertea GM, Leek JT, Salzberg SL. Transcript-level expression analysis of RNA-seq experiments with HISAT, StringTie and Ballgown. Nat Protoc. 2016;11(9):1650–1667. doi:10.1038/nprot.2016.095.
- Zhu G, Guo M, Zhao J, Zhang H, Wang G, Chen W. Bifidobacterium breve intervention combined with environmental enrichment alleviates cognitive impairment by regulating the gut microbiota and microbial metabolites in Alzheimer’s disease mice. Front Immunol. 2022;13:1013664. doi:10.3389/fimmu.2022.1013664.
- Bello-Medina PC, Corona-Cervantes K, Zavala Torres NG, González A, Pérez-Morales M, González-Franco DA, Gómez A, García-Mena J, Díaz-Cintra S, Pacheco-López G, et al. Chronic-antibiotics induced gut microbiota dysbiosis rescues memory impairment and reduces β-amyloid aggregation in a preclinical Alzheimer’s disease model. Int J Mol Sci. 2022;23(15):23. doi:10.3390/ijms23158209.
- Nagarajan A, Srivastava H, Morrow CD, Sun LY. Characterizing the gut microbiome changes with aging in a novel Alzheimer’s disease rat model. Aging. 2023;15(2):459–471. doi:10.18632/aging.204484.
- Kaiyrlykyzy A, Kozhakhmetov S, Babenko D, Zholdasbekova G, Alzhanova D, Olzhayev F, Baibulatova A, Kushugulova, AR, Askarova S. Study of gut microbiota alterations in Alzheimer’s dementia patients from Kazakhstan. Sci Rep. 2022;12:15115. doi:10.1038/s41598-022-19393-0.
- Jung JH, Kim G, Byun MS, Lee JH, Yi D, Park H, Lee DY. Gut microbiome alterations in preclinical Alzheimer’s disease. PloS One. 2022;17(11):e0278276. doi:10.1371/journal.pone.0278276.
- Wang SS, Li XH, Liu P, Li J, Liu L. The relationship between Alzheimer’s disease and intestinal microflora structure and inflammatory factors. Front Aging Neurosci. 2022;14:972982. doi:10.3389/fnagi.2022.972982.
- Dunham SJB, McNair KA, Adams ED, Avelar-Barragan J, Forner S, Mapstone M, Whiteson KL. Longitudinal analysis of the microbiome and metabolome in the 5xfAD mouse model of Alzheimer’s disease. mBio. 2022;13(6):e0179422. doi:10.1128/mbio.01794-22.
- Javed I, Zhang Z, Adamcik J, Andrikopoulos N, Li Y, Otzen DE, Lin S, Mezzenga R, Davis TP, Ding F, et al. Accelerated amyloid beta pathogenesis by bacterial amyloid FapC. Adv Sci (Weinheim, Baden-Wurttemberg, Germany). 2020;7(18):2001299. doi:10.1002/advs.202001299.
- Choi CS, Gwin M, Voth S, Kolb C, Zhou C, Nelson AR, deWeever A, Koloteva A, Annamdevula NS, Murphy JM, et al. Cytotoxic tau released from lung microvascular endothelial cells upon infection with Pseudomonas aeruginosa promotes neuronal tauopathy. J Biol Chem. 2022;298(1):101482. doi:10.1016/j.jbc.2021.101482.
- Guido ME, Monjes NM, Wagner PM, Salvador GA. Circadian regulation and clock-controlled mechanisms of glycerophospholipid metabolism from neuronal cells and tissues to fibroblasts. Mol Neurobiol. 2022;59(1):326–353. doi:10.1007/s12035-021-02595-4.
- Kim SJ, Tang T, Abbott M, Viscarra JA, Wang Y, Sul HS. AMPK phosphorylates Desnutrin/ATGL and hormone-sensitive lipase to regulate lipolysis and fatty acid oxidation within adipose tissue. Mol Cell Biol. 2016;36(14):1961–1976. doi:10.1128/MCB.00244-16.
- Fiume R, Faenza I, Sheth B, Poli A, Vidalle MC, Mazzetti C, Abdul SH, Campagnoli F, Fabbrini M, Kimber ST, et al. Nuclear phosphoinositides: Their regulation and roles in nuclear functions. Int J Mol Sci. 2019;20(12):20. doi:10.3390/ijms20122991.
- Zheng P, Wu J, Zhang H, Perry SW, Yin B, Tan X, Chai T, Liang W, Huang Y, Li Y, et al. The gut microbiome modulates gut–brain axis glycerophospholipid metabolism in a region-specific manner in a nonhuman primate model of depression. Mol Psychiatr. 2021;26(6):2380–2392. doi:10.1038/s41380-020-0744-2.
- Tian T, Mao Q, Xie J, Wang Y, Shao WH, Zhong Q, Chen J-J. Multi-omics data reveals the disturbance of glycerophospholipid metabolism caused by disordered gut microbiota in depressed mice. J Adv Res. 2022;39:135–145. doi:10.1016/j.jare.2021.10.002.
- Xie J, Zhong Q, Wu WT, Chen JJ. Multi-omics data reveals the important role of glycerophospholipid metabolism in the crosstalk between gut and brain in depression. J Transl Med. 2023;21(1):93. doi:10.1186/s12967-023-03942-w.
- Zhang X, Wu C, Tan W. Brain lipid dynamics in amyloid precursor Protein/presenilin 1 mouse model of early alzheimer’s disease by desorption electrospray ionization and matrix assisted laser desorption ionization–mass spectrometry imaging techniques. J Proteome Res. 2021;20(5):2643–2650. doi:10.1021/acs.jproteome.0c01050.
- Zhao Y, Chen H, Iqbal J, Liu X, Zhang H, Xiao S, Jin N, Yao F, Shen L. Targeted metabolomics study of early pathological features in hippocampus of triple transgenic Alzheimer’s disease male mice. J Neurosci Res. 2021;99(3):927–946. doi:10.1002/jnr.24750.
- Qian XH, Liu XL, Chen SD, Tang HD. Identification of immune hub genes associated with braak stages in Alzheimer’s disease and their correlation of immune infiltration. Front Aging Neurosci. 2022;14:887168. doi:10.3389/fnagi.2022.887168.
- Qian XH, Liu XL, Chen SD, Tang HD. Integrating peripheral blood and brain transcriptomics to identify immunological features associated with Alzheimer’s disease in mild cognitive impairment patients. Front Immunol. 2022;13:986346. doi:10.3389/fimmu.2022.986346.
- Thakur S, Dhapola R, Sarma P, Medhi B, Reddy DH. Neuroinflammation in Alzheimer’s disease: Current progress in molecular signaling and therapeutics. Inflammation. 2023;46(1):1–17. doi:10.1007/s10753-022-01721-1.
- Thu Thuy Nguyen V, Endres K. Targeting gut microbiota to alleviate neuroinflammation in Alzheimer’s disease. Adv Drug Deliv Rev. 2022;188:114418. doi:10.1016/j.addr.2022.114418.
- Zhou R, Qian S, Cho WCS, Zhou J, Jin C, Zhong Y, Wang J, Zhang X, Xu Z, Tian M, et al. Microbiota-microglia connections in age-related cognition decline. Aging Cell. 2022;21(5):e13599. doi:10.1111/acel.13599.
- Bairamian D, Sha S, Rolhion N, Sokol H, Dorothée G, Lemere CA, Krantic S. Microbiota in neuroinflammation and synaptic dysfunction: a focus on Alzheimer’s disease. Mol Neurodegener. 2022;17(1):19. doi:10.1186/s13024-022-00522-2.
- Huang Y, Wu J, Zhang H, Li Y, Wen L, Tan X, Cheng K, Liu Y, Pu J, Liu L, et al. The gut microbiome modulates the transformation of microglial subtypes. Mol Psychiatr. 2023;28(4):1611–1621. doi:10.1038/s41380-023-02017-y.
- Pietzner M, Kaul A, Henning AK, Kastenmüller G, Artati A, Lerch MM, Adamski J, Nauck M, Friedrich N. Comprehensive metabolic profiling of chronic low-grade inflammation among generally healthy individuals. BMC Med. 2017;15(1):210. doi:10.1186/s12916-017-0974-6.
- Yu EA, He S, Jones DP, Sun YV, Ramirez-Zea M, Stein AD. Metabolomic profiling demonstrates postprandial changes in fatty acids and glycerophospholipids are associated with fasting inflammation in Guatemalan adults. J Nutr. 2021;151(9):2564–2573. doi:10.1093/jn/nxab183.
- Su D, Liao L, Zeng Q, Liao Z, Liu Y, Jin C, Zhu G, Chen C, Yang M, Ai Z, et al. Study on the new anti-atherosclerosis activity of different herba patriniae through down-regulating lysophosphatidylcholine of the glycerophospholipid metabolism pathway. Phytomed: Inter J Phytothera And Phytopharmacol. 2022;94:153833. doi:10.1016/j.phymed.2021.153833.
- Webster SJ, Bachstetter AD, Nelson PT, Schmitt FA, Van Eldik LJ. Using mice to model Alzheimer’s dementia: an overview of the clinical disease and the preclinical behavioral changes in 10 mouse models. Front Genet. 2014;5:88. doi:10.3389/fgene.2014.00088.
- Kosel F, Pelley JMS, Franklin TB. Behavioural and psychological symptoms of dementia in mouse models of Alzheimer’s disease-related pathology. Neurosci Biobehav Rev. 2020;112:634–647. doi:10.1016/j.neubiorev.2020.02.012.