
 ?Mathematical formulae have been encoded as MathML and are displayed in this HTML version using MathJax in order to improve their display. Uncheck the box to turn MathJax off. This feature requires Javascript. Click on a formula to zoom.
ABSTRACT
Obesity and the metabolic syndrome are complex disorders resulting from multiple factors including genetics, diet, activity, inflammation, and gut microbes. Animal studies have identified roles for each of these, however the contribution(s) specifically attributed to the gut microbiota remain unclear, as studies have used combinations of genetically altered mice, high fat diet, and/or colonization of germ-free mice, which have an underdeveloped immune system. We investigated the role(s) of the gut microbiota driving obesity and inflammation independent of manipulations in diet and genetics in mice with fully developed immune systems. We demonstrate that the human obese gut microbiota alone was sufficient to drive weight gain, systemic, adipose tissue, and intestinal inflammation, but did not promote intestinal barrier leak. The obese microbiota induced gene expression promoting caloric uptake/harvest but was less effective at inducing genes associated with mucosal immune responses. Thus, the obese gut microbiota is sufficient to induce weight gain and inflammation.
Keywords:
Introduction
Obesity, defined as a body mass index (BMI) >30 kg/m2, is a complex disorder arising in part due to contributions from lifestyle, genetics, diet, inflammation, and gut microbes. Obesity is reaching epidemic proportions in Westernized societies and is associated with numerous complications, including insulin resistance, type 2 diabetes, increased risk of cancer, and increased risk of cardiovascular diseases, ultimately resulting in premature death. Low-grade chronic inflammation is thought to be the precipitating factor for many of these complications. Obesity can be associated with elevated levels of circulating inflammatory cytokines such as interleukin-1 (IL-1) and IL-6 and with infiltration of inflammatory cells in the adipose tissue, the liver, muscle, pancreas, and gut which are thought to be contributors to insulin resistance and type 2 diabetes.Citation1,Citation2 Specifically, accumulation of macrophages and T cells in adipose tissue is thought to be a driver of insulin resistance.Citation3,Citation4 While Th17 cells are enriched in the liver and adipose tissue of obese patients,Citation5,Citation6 the role Th17 cells in obesity and the associated metabolic syndrome is controversial as some models of diet-induced obesity have suggested they may be protective.Citation7,Citation8 How this low-grade systemic inflammation arises in obesity is incompletely understood, but may be related to alterations in the gut microbiota which can be associated with obesity.Citation9,Citation10
The gut microbiota has emerged as an important factor regulating host physiology and metabolism.Citation11,Citation12 Studies in humans have demonstrated an altered gut microbiota in subjects with obesity. Seminal studies revealed that fecal microbial transplant from obese individuals into adult germ-free mice consuming an obesogenic diet contributes to increased weight gain.Citation13 The role of the gut microbiota in contributing to weight gain is in part believed to be due to increased caloric harvest as the gut microbiota influences the expression of host metabolic genes in the intestine.Citation13 Additionally the healthy gut microbiota has been shown to be important for the normal and balanced development of the immune system, which becomes unbalanced and displays low-grade inflammation in the setting of obesity and the metabolic syndrome. Further high fat diet could contribute to weight gain and inflammation directly and/or indirectly through alterations in the gut microbiota.Citation14 Thus, while the gut microbiota has been demonstrated to be a contributor to obesity and inflammation, the current models have been unable to determine if the gut microbiota, independent of an obesogenic diet, genetic alterations, and in the setting of a healthy immune system, is sufficient to induce weight gain and induce inflammation in adipose tissue.
Here we describe a gut microbe driven model of obesity that is independent of manipulations in genetics and diet in adult mice with a normally developed immune system. We observed that colonization of antibiotic pretreated adult mice with fecal slurry from obese individuals results in weight gain, systemic inflammation, and accumulation of inflammatory immune cells in the adipose tissue and the intestine when compared to mice colonized with microbiota from lean individuals. Our findings are among the first to demonstrate that obesity-associated microbial dysbiosis is sufficient to promote weight gain, inflammation, and immune cell expansion in the adipose tissue in the setting of a non-obesogenic diet and a normally developed immune system.
Results
Gut microbiota from obese individuals can promote weight gain independent of manipulations in genetics and diet
To determine if the gut microbiota from obese individuals was sufficient to induce weight gain independent of genetic manipulations, immune development, and an obesogenic diet, cohorts of adult five to 6-week-old wild-type C57BL/6 specific-pathogen-free (SPF) housed male mice from our colony were treated with antibiotic cocktail for 2 weeks and then randomly assigned to be colonized with fecal slurries prepared from deidentified human lean (body mass index; BMI < 25) or obese (BMI > 30) donors ( aggregate clinical data by donor group, clinical data for individual donors, schematic of cohort treatments). Cohorts were monitored for weight gain over the course of 4–5 weeks. To avoid the confounding effects of high fat diet on weight gain and on inducing gut microbial dysbiosis, mice were maintained on a normal chow diet. Mice colonized with microbiota from donors with obesity gained significantly more weight than those colonized with microbiotas from lean donors (; average weight gains for all cohorts at 4 weeks post colonization and supplemental ; weight gains for individual mice in cohorts). Mice receiving microbiotas from lean donors gained weight following colonization, that was not significantly different than genetically identical, sex and aged matched mice not receiving colonization (), suggesting that this increase in weight was part of normal growth over the time period the cohorts were monitored.
Figure 1. The gut microbiota from obese individuals induces significant weight gain independent of obesogenic diet, genetics, and in mice with a normal immune system. (a) schematic of experimental approach, male SPF-C57BL/6 mice maintained on a normal chow diet were treated with oral antibiotics on alternate days for two weeks. Mice were colonized with fecal slurry from cohorts of deidentified human lean (BMI <25) or obese (BMI > 30) donors 3 d after last antibiotic gavage and were monitored for weight change over five weeks. (b) graph depicts weight gain at four-weeks post colonization along all the cohorts. (c) 16s rRNA sequencing on donor samples and colonic contents of colonized mice revealed reduced richness at the level of amplicon sequence variants (ASVs). (d) six taxa that were significantly reduced in the colonic contents of mice colonized with microbiotas from obese individuals. Each dot represents an individual mouse with color coding for each donor. Dot plot show the mean ± SD, * = p < 0.05; ** = p < 0.01, ns = non- significant. Statistics were performed using an unpaired student’s t test. Bar plots show median with interquartile range of relative abundance of ASVs for each group with individual data points overlayed.
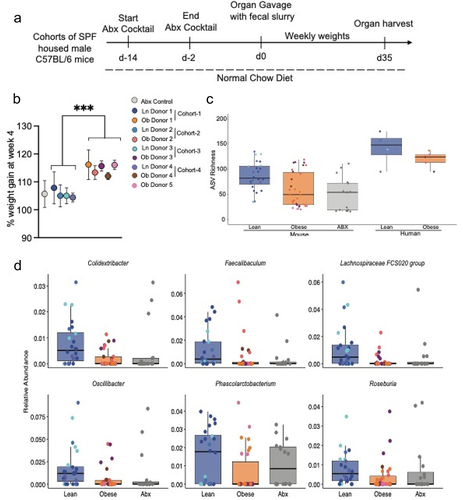
Table 1. Aggregate characteristics of study groups.
Table 2. Individual characteristics of donors and identifiers of donor microbiota recipients.
The gut microbiota of obese individuals has reduced richness when compared with lean individuals.Citation15 Characterization of the gut microbial communities using 16S rRNA gene amplicon sequencing on colonic samples at five-weeks post microbiota transfer revealed that mice colonized with obese or lean gut microbiotas had distinct microbial compositions (). Indeed, mice colonized with microbiota from obese donors, have significantly reduced estimated richness when analyzed at the level of amplicon sequence variants (ASV) recapitulating observations of the gut microbiota seen in obese and lean donors ( and ). Multiple genera were found to overlap in donor specimens and the gut microbiota of their respective recipient mouse cohorts (). Differential abundance analysis with corncob identified 6 ASVs, mapping to the genuses Colidextribacter, Faecalibaculum, Lachnospiracea, Oscillibacter, Phascolarcctobacterium, and Rosburia, that were significantly reduced in the colonic samples from mice colonized with microbiota from obese donors compared to those colonized with microbiotas from lean donors (). No ASVs were observed to be significantly enriched in recipients of obese vs. lean microbiotas. Thus, the gut microbiota from obese individuals maintains its dysbiosis after colonization and can induce weight gain independent of manipulations in genetics and diet in mice with normal immune development.
Table 3. Overlapping genera among obese donor specimens and mice colonized with microbiota from obese donors.
Table 4. Overlapping genera among lean donor specimens and mice colonized with microbiota from lean donors.
The obesity promoting gut microbiota can drive inflammation independent of barrier leak
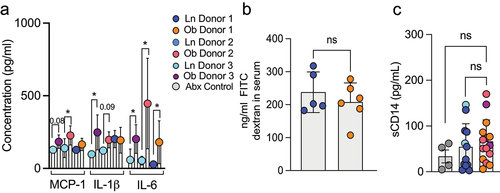
Obesity can be associated with systemic low-grade chronic inflammation and infiltration of the adipose tissue with inflammatory cells. We observed an increase in serum levels of the pro-inflammatory cytokines IL-6, MCP-1 and IL-1β 5 weeks post colonization of mice with obese microbiotas when compared to mice colonized with lean microbiotas (). Notably not all obese microbiotas recapitulated the increased inflammation despite demonstrating increased weight gain, suggesting different effects of gut microbes from obese individuals independent of their ability to induce weight gain. In models of diet-induced obesity, increased circulating cytokines have been attributed to a leaky intestinal barrier.Citation16 However, we did not observe increased intestinal permeability following gavage of 4KDa FITC dextran in mice colonized with obese microbiotas (). Additionally, soluble CD14 (sCD14) serum levels, a co-receptor for LPS that is elevated by systemic LPS, were not elevated in mice colonized with obese microbiota () . Taken together, these observations suggest that the obese microbiota can drive systemic inflammation in a manner independent of increased gut barrier permeability.
Figure 2. The microbiota from obese individuals drives systemic inflammation but not intestinal barrier leak. (a) serum cytokines were measured in colonized mice at five weeks post colonization revealed significant increases in IL-1β, MCP-1 and IL-6 in recipients of some obese microbiotas. (b) concentration of orally gavaged 4-kDa fluorescence isothiocyanate (FITC) dextran in the plasma after four hours in mice four weeks after colonization with lean or obese microbiotas. (c) graph depicts the concentration of CD14 in the serum as measured by Elisa at five weeks post colonization. Each dot represents an individual mouse with color coding for each donor. Bar graphs show the mean ± SEM, * = p < 0.05; ** = p < 0.01, ns = non- significant. Statistics were performed using an unpaired student’s t test.
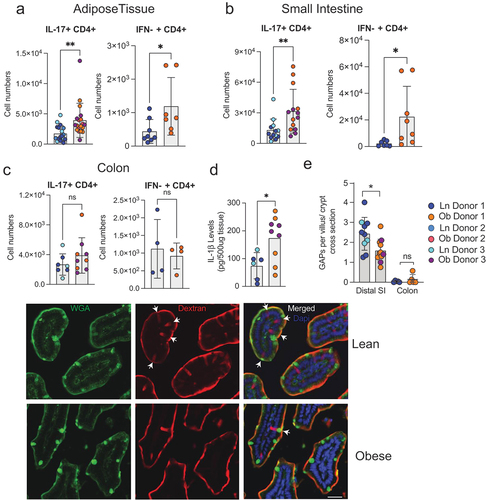
We investigated the effect of the obese and lean gut microbiotas on cell populations in the adipose tissue and gut 5 weeks post colonization using flow cytometry. We observed that the number of IL-17 producing CD4+ T cells and IFNγ producing CD4+ T cells was significantly increased in the adipose tissue of mice colonized with gut microbiotas from obese individuals when compared with those colonized with gut microbiotas from lean individuals (). Similar to the adipose tissue, we observed a substantial increase in the number of IL-17 producing CD4+ T cells and IFNγ producing CD4+ T cells in the small intestinal lamina propria (). However, these changes were not seen in the colon lamina propria (). One explanation for this difference could be that the colon has a thicker mucus layer which prevents close association between the gut microbes and the epithelium.Citation17,Citation18 In comparison, the small intestine has a thinner mucus layer which could allow microbes to come into closer contact with the epithelium. Adherent bacteria have been demonstrated to induce the production of IL-1β,Citation19 which can promote the development of Th17 cells.Citation20 Consistent with this we observed significantly more IL-1β in the small intestinal epithelium from mice colonized with microbiotas from obese donors than from those colonized with microbiotas from lean donors (). IL-1b production during Salmonella infection inhibits the ability of intestinal goblet cells to form goblet cell associated antigen passages (GAPs),Citation21 which in the homeostatic state deliver luminal substances to the underlying lamina propria immune system.Citation22 Small intestine GAPs play a critical role in shaping the immune response.Citation23 When present, small intestinal GAPs promote tolerance and when inhibited the immune response shifts from a tolerogenic to an inflammatory phenotype.Citation21,Citation23 Indeed, we observed that mice colonized with microbiota from obese individuals, had significantly reduced number of GAPs in their small intestine when compared with mice colonize with microbiotas from lean individuals (). GAPs in the colon are largely inhibited by the abundant luminal microbiota in the colon at the steady state,Citation24,Citation25 and consistent with this we did not observe differences in colonic GAPs when comparing obese and lean microbiota colonized mice ().
Figure 3. The microbiota from obese individuals drives accumulation of inflammatory immune cells in adipose tissue and small intestine, but not the colon. Graphs depict flow cytometry analysis of IL-17A+ CD4 T cells and IFN-γ+ CD4 T cells in (a) adipose tissue, (b) small intestinal lamina propria and (c) colonic lamina propria of mice 5 weeks post colonization. (d) IL-1β in the small intestine epithelium measured by ELISA. (e) graph depicts number of goblet cell associated antigen passages (GAPs) measured in the small intestine and colon of colonized mice. Representative images showing GAPs in small intestinal villus cross section. Dextran columns co-localized with goblet cell marker wheat germ agglutinin (WGA). Scale bar: 50 µm. Each dot represents an individual mouse with color coding for each donor. Bar graphs show the mean ± SEM, * = p < 0.05; ** = p < 0.01, ns = non- significant. Statistics were performed using an unpaired student’s t test.
Collectively, these data show that microbiota from obese individuals, compared to lean individuals, promotes accumulation of inflammatory immune cells in the adipose tissue and small intestine, but not the colon in colonized mice. Moreover, accumulation of inflammatory cells was not associated with increased gut permeability, but was associated with epithelial IL-1β production and subsequent small intestine GAP inhibition, which may contribute to the inflammatory tone of the intestinal immune response.
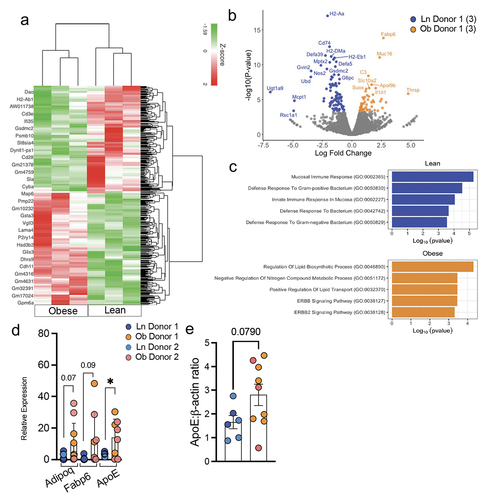
In order to gain additional insight into the effect of the microbiotas from lean or obese individuals on the small intestine, we performed bulk RNA-sequencing (RNA-Seq) of ileum of three mice colonized with obese and three mice colonized with lean microbiotas as well as two mice treated with antibiotics but not colonized. When analyzing differentially expressed genes between the obese and lean colonized mice using Differential Expression (DE) analysis, we identified 135 genes significantly differentially expressed upon colonization, of which 51 genes were upregulated in mice colonized with obese microbiota and 84 were upregulated in mice with lean microbiota (). Upregulated genes in mice with obese microbiotas included genes related to lipid uptake and metabolism such as Adipoq, Fabp6, Scd1, Cyp2d26, Thrsp, and Apoe (). We also detected upregulation of IL1rl1, which could further enhance signaling in the setting of the increased IL-1β levels in the small intestinal epithelium that we observed by ELISA. Consistent with the upregulation of these genes and the weight gain seen in mice colonized with obese microbiotas, GO Term Enrichment Analysis revealed enrichment for lipid transportation and lipid biosynthesis pathways response signature (). Elevated expression of these genes and protein were confirmed by RT-PCR () and Western blot (). Unexpectedly, genes significantly increased in mice colonized with lean microbiotas included genes associated with innate immune responses such as Defa5 and Defa39, and genes associated with adaptive immune responses such as H2-Aa, H2-DM, H2-b1, and CD74 and accordingly were enrichment for pathways associated with mucosal immune responses and responses to bacteria (). A secondary analysis of differentially expressed genes between the obese and lean colonized mice and the antibiotic treated mice not receiving FMT using DE analysis revealed 76 differentially expressed genes that were unique to the comparison of lean and obese colonized mice (Supplemental Fig S3). These genes were likewise enriched in pathways identified in the comparison limited to lean and obese colonized mice (), suggesting these differences were not attributable to the antibiotic treatment. Comparison of pathways enriched in obese colonized mice with mice not receiving FMT likewise revealed upregulation of metabolic processes (Supplemental Fig S3B). Interestingly, comparison of pathways enriched in lean colonized mice with mice not receiving FMT revealed enrichment in catabolic processes (Supplemental Fig S3B) despite the inability to observe changes in weight gain (), suggesting that microbes from lean individuals could have beneficial impacts on the metabolic syndrome. These observations indicate that the microbiota from obese individuals is sufficient to induce upregulation of pathways promoting caloric harvest and weight gain independent of diet and genetics in the setting of a normally developed immune system, yet is less effective at inducing genes associated with mucosal immune responses to bacteria.
Figure 4. The microbiota from obese individuals drives small intestine expression of genes promoting caloric harvest/uptake but is less effective at inducing genes associated with mucosal immune responses and responses to bacteria (a) heat map depicting 135 differentially regulated genes in the small intestinal tissue of mice colonized with microbiota from a lean or obese donors. (b) volcano plot showing the most prominent genes altered between the two groups. (c) GO enrichment analysis of small intestinal tissue from lean vs obese colonized mice. RNA seq was conducted on small intestinal tissue of n=3 mice per group. (d) Relative expression of Adipoq, Fabp6 and ApoE, normalized to housekeeping gene (Hprt1 and Gapdh) in small intestinal tissue. (n = 6–8 per group, two distinct donors per group) (e) graph depicts expression of ApoE normalized to actin, as measured by Western blot (Supplemental figure S4). Bar graphs show the mean ± SEM, * = p < 0.05. Statistics were performed using an unpaired student’s t test.
Discussion
Obesity and the associated metabolic syndrome are rapidly increasing in Westernized societies. These disorders result from a complex interplay between diet, exercise, genetics, and more recently recognized, the gut microbiota and the immune system. Parsing out the contributions of each of these has been difficult, if not impossible in humans. While animal studies have demonstrated a contribution of the gut microbiota to obesity and associated phenotypes, the exact contribution(s) of the gut microbiota have remained unclear as studies have used models of gut microbial manipulation in combination with obesogenic diets and/or colonization of germ-free adult mice, which lack a normally developed immune system.Citation26 Here we present, for the first time to our knowledge, a model of obesity driven by the gut microbiota independent of manipulations in genetics, diet, and in the setting of normal immune development. We find that the gut microbiota from obese individuals alone, in comparison to the gut microbiota from lean individuals, was sufficient to drive weight gain, low grade systemic inflammation, and infiltration of the adipose tissue and intestine with inflammatory T cells. A limitation of our study is that, similar to other studies of obesity, our studies were limited to male mice to maintain genetic uniformity and to obtain epididymal adipose tissue for analysis. Further, while obese microbiotas, in comparison to lean microbiotas, examined in this study reproduced this phenotype, we are cognizant that the contribution of the microbiota to obesity and the metabolic syndrome likely varies from individual to individual, with some having less or potentially no contribution from the microbiota. Indeed, we observed that some microbiotas from obese individuals were more or less effective at inducing systemic inflammation, yet were able to induce weight gain. Deciphering which microbiotas and microbes drive the various facets of these phenotypes independent of genetics and diet and in the setting of a normally developed immune system is beyond the scope of this study, but will provide a fruitful area for future investigations.
Previous studies have demonstrated that the gut microbiota and immune system contribute to obesity, and that imbalance of intestinal immune homeostasis is associated with obesity associated metabolic diseases.Citation7 However, these studies used models of diet-induced obesity, which has been shown to drive gut microbial dysbiosis, increase barrier leak, and drive inflammation.Citation14,Citation16,Citation27 Here, we provide evidence that independent of an obesogenic diet, fecal microbes can promote obesity and inflammation in mice on a genetically identical background. Interestingly our model did not display increased gut permeability, despite having low level systemic inflammation, suggesting that the obesogenic diet may be a larger contributor to gut barrier leak.
Many, if not the majority, of previous studies of fecal microbial transplant have focused on changes occurring in the colon as this is the site in the gastrointestinal tract with the highest density of microbes. Interestingly, we did not observe an expansion of inflammatory T cells in the colon but did observe this in the small intestine when comparing mice colonized with microbiotas from obese and lean individuals. Complementing this our RNA-seq studies demonstrated an enrichment in pathways associated with lipid uptake and metabolism in the small intestine of mice colonized with microbiotas from obese individuals, which is consistent with the role of the small intestine in nutrient and caloric uptake, and the phenotype of increased weight gain. Unexpectedly, RNA-seq studies from mice colonized with lean microbiotas demonstrated enrichment in pathways associated with mucosal immune responses and immune responses to microbes, despite having lower small intestinal epithelial cell production of IL-1β when compared to mice colonized with microbiotas from obese individuals. IL-1β production can be driven by bacteria that adhere to the intestinal epithelium. Further, we observed that microbiota from lean individuals induced catabolic pathways when compared to mice not receiving FMT. Together, these observations could suggest that gut microbiotas from lean individuals are more effective at inducing catabolism and eliciting mucosal immune responses that limit microbe adherence to the epithelium and that epithelial adherence may be one component driving obesity and low grade systemic inflammation. Prior work has demonstrated that IL-1β can inhibit GAPs in the small intestine and that when small intestine GAPs are inhibited the tone of the intestinal immune response deviates away from tolerance, manifest by a loss of T regulatory cells and a loss of tolerogenic imprinting of intestinal antigen presenting cells,Citation21,Citation23 suggesting this may be one contributor to intestinal inflammation induced by some obese microbiotas.
The role of intestinal immune cells in obesity is not well understood. Some reports indicate mice on high fat diet for 10-weeks show a reduction in number of Th17 cells and accumulation of Th1 cells in their small intestine,Citation7 while others have found no change in Th17 cell numbers upon 12–16 weeks long high fat diet exposure.Citation28 We observed an increase in Th17 cells in the intestine of mice colonized with microbiotas from obese individual. What accounts for these discrepancies is not clear but could be due to differences in the models of obesity. Indeed, it is possible that microbes from obese human donors may drive aspects of these phenotypes that are different than those arising due high fat diet consumption alone.
In summation, here we demonstrate that gut microbiota from obese individuals is sufficient to induce weight gain, low grade systemic inflammation, increased inflammatory cell infiltration in the gut and adipose tissue, and enhanced expression of genes in pathways of caloric harvest in the absence of an obesogenic diet, genetic alterations, and in the setting of a normally developed immune system. While it is likely that all human gut microbes will not colonize mice and may less efficiently colonize antibiotic treated SPF housed mice in comparison to germ-free mice, these gut microbiotas colonized sufficiently to reproduce, to some extent, the phenotypes of their donors. Undoubtedly not all microbiotas from obese individuals will have the same effects and recapitulate all aspects of the obese and metabolic syndrome phenotype(s). However, this model is of a shorter duration when compared to diet-induced obesity models and overcomes limitations of an immature immune system in the setting of disorders with increasingly appreciated contributions by the immune system, and might be leveraged to dissect contributions of different microbiotas and microbes to these disorders.
Methods
Mice
All mice were on C57BL/6 background, purchased from The Jackson Laboratory and were bred in house. Mice were housed in a specific pathogen-free facility and fed a routine chow diet, the PicoLab Rodent Diet 20 (5053; Purina Farms) formulated with 20% protein and 4.5% fat. Male mice were used in this study. The age of the mice ranged between 5 and 6 weeks at the time of antibiotic treatment comprising 500 µg ampicillin, metronidazole, neomycin, and 250 µg vancomycin on alternate days for 2 weeks by oral gavage. Mice received five doses of antibiotic treatment, and 3-d after the last antibiotic gavage, mice were randomly assigned to the experimental groups and cohorts consisting of mice receiving obese or lean microbiotas by oral gavage, or a cohort receiving obese microbiota by oral gavage or no microbiota which were the antibiotics only group. Mice were monitored for weight change with weekly weights. All animal procedures and protocols were performed in accordance with the Institutional Animal Care and Use Committee at the Washington University School of Medicine.
Donor stool collection, preparation, and administration
Stool samples were obtained prior to preparation for screening colonoscopy from Lean (BMI < 25) or Obese (BMI > 30) donors subjects. Patient identification, consent, stool collection, and stool processing was performed by the Washington University Digestive Diseases Research Center Core BioBank (supported by NIH grant P30 DK DK052574). Collected stool samples were stored at −80°C until use. Before inoculation, stool samples weighted out and diluted with phosphate-buffered saline. Diluted stool samples then were passed through a 100-μm cell strainer and orally inoculated (100 μL per mouse) into C57BL/6 mice pretreated with antibiotics.
Lamina propria (LP) lymphocyte isolation
LP lymphocyte isolation and intracellular cytokine and transcription factor staining were performed as described previously.Citation23
Adipose tissue immune cell isolation
Both flaps of epididymal fat were dissected and cut into pieces. The sample was digested for 45 min at 37 degrees Celsius with collagenase type VIII (10,000 U/ml) (Sigma-C2139) and dispase (50 U/ml) (Fisher CB-40235) in RPMI.
Cytokine measurements
Serum was obtained at five-weeks post colonization. To assay cytokine levels in mouse serum, we used multianalyte assay (LEGENDplex Mouse Inflammation Panel; #740446, BioLegend, San Diego, CA) according to the provided protocol. To assess barrier leak via circulating CD14 levels, we performed Mouse CD14 Quantikine Elisa (# MC140, R&D Systems, USA). To assess IL-1β levels in the gut, a 5-cm portion of jejunum was opened longitudinally and washed with PBS. The epithelial cell layer was scraped from the submucosa with a glass slide, weighted and cells were homogenized in 1 ml PBS. Cells were centrifuged, and an ELISA for IL-1β (eBioscience) performed on supernatants per the manufacturer’s protocol.
Intestinal permeability assay
To assess intestinal permeability, FITC-Dextran gut-to-serum absorption was measured as previously described.Citation23 Briefly, a baseline blood sample (150–250 uL) was taken from each mouse via facial vein puncture. After 1 hour of fasting, the mice were orally gavaged with 200 μL of 40 mg/ml FITC-Dextran (4 kDa; Sigma Aldrich) in sterile PBS. Food and water were then withheld for an additional 45 minutes. After 3 hours mice were sacrificed and blood was collected by facial vein puncture. Serum was separated from blood samples using serum separator tubes according to manufacturer’s instructions (BD microtainer). Fluorescence of pre- and post-gavage serum were measured (at a 5-fold dilution in PBS) using an excitation wavelength of 485 nm and an emission wavelength of 528 nm. The pre-gavage serum values were subtracted from post-gavage serum values and a standard curve was used to determine the concentration.
Antibodies and flow cytometry
Fluorescently conjugated antibodies were purchased from BioLegend, Becton Dickinson and Invitrogen (eBioscience). Samples were analyzed using an Attune (Thermo Scientific), and data were processed with FlowJo.
Measurement for goblet cells and GAPs
Assessment of intestinal goblet cells and GAPs was done accordingly to previously published protocol.Citation22,Citation29 In short, lysine fixable TRITC conjugated 10kDa dextran was administered into the SI or proximal colon of ketamine/xylazine anesthetized mice. After 30 minutes, mice were sacrificed, intestinal tissues were dissected and washed with cold PBS before fixation in 10% formalin buffered solution, followed by incubation in 30% sucrose solution. Tissues were embedded in optimal cutting temperature compound (OCT) and 6 μm sections were prepared. Tissue sections were stained with fluorescein conjugated WGA (Vector Laboratories, Burlingame, CA) or fluorescein conjugated UEA1 (Vector Laboratories, Burlingame, CA) to identify GCs in the SI and colon, respectively, and stained with DAPI (Sigma-Aldrich, St Louis, MO) to identify the nucleus. Sections were imaged using an Axioscope 2 microscope (Carl Zeiss Microscopy, Thornwood, NY). GAPs were identified as TRITC-dextran filled WGA+ (SI)/epithelial cells measuring approximately 20 μm (height) Å~ 5 μm (diameter) traversing the epithelium and containing a nucleus and were enumerated as GAPs per villus/crypt cross section in the SI, and GAPs per crypt cross section in the colon.
Extraction of fecal genomic DNA and profiling the fecal microbiota
Luminal contents were collected and processed for DNA isolation using the Power Fecal DNA Kit (Qiagen). The V4 region of 16S rRNA gene was PCR-amplified using barcoded primer described previously and sequenced using the Illumina Miseq Platform (2 × 250-bp paired-end reads). Quality filtering and amplicon sequence variants (ASVs) were identified using DADA2.Citation30 For taxonomic assignment, ASVs were compared to SILVA v 138 database with 100% identity cutoff for species level assignment. Alpha diversity metrics were assessed with the package breakaway and DivNet.Citation31,Citation32 Differentially abundant ASVs were determined with the package corncob.Citation33 Samples with less than 500 reads were excluded prior to beta-diversity analysis with qiime2 with deicode for robust Aitchinson PCACitation34 and permanova.
RNA isolation and RNA-seq data analysis
RNA was isolated from small intestinal tissue (5 cm in length) using the Zymogen RNA isolation kit as per manufacturer instructions. Library preparation and paired end 150 bp sequencing was performed by Genewiz. Alignment of RNA sequencing reads on mouse reference genome mm10 was performed using Partek® Flow® software, version 8.0 (Partek Inc., St. Louis, MO). All gene counts were then imported into the R/Bioconductor package EdgeR and TMM normalization size factors were calculated to adjust for samples for differences in library size. Ribosomal genes and genes not expressed in the smallest group size minus one sample greater than one count-per-million were excluded from further analysis. The TMM size factors and the matrix of counts were then imported into the R/Bioconductor package Limma. Weighted likelihoods based on the observed mean–variance relationship of every gene and sample were then calculated for all samples with the voomWithQualityWeights. The performance of all genes was assessed with plots of the residual standard deviation of every gene to their average log-count with a robustly fitted trend line of the residuals. Differential expression analysis was then performed to analyze for differences between conditions and the results were filtered for only those genes with Benjamini–Hochberg false-discovery rate adjusted p-values less than or equal to 0.05. GO-Term Enrichment Analysis
Differentially expressed genes were separated by the direction of logFC (positive/negative) and then input into the Enrichr web application (www.enrichr.com) to determine enrichment. We applied an adjusted p-value of less than 0.05, as a cutoff to determine significance.
Immunoblotting
For western blot analysis, intestinal specimens were snap-frozen in liquid nitrogen. Protein obtained from small intestinal tissue were measured using BioRad Protein Assay Kit, diluted in 1:5 in PBS. Laemmlie sample buffer (1610747, Bio-Rad, Hercules, CA) was added to each sample and boiled for 5 min at 100°C in a heat block for complete denaturation of protein. Immunoblotting was done as previously described using primary ApoE antibodyCitation35 and secondary anti-rabbit antibody. The ApoE antibody has been previously reported in refCitation35 and secondary anti-rabbit antibody (Cell Signalling Technology; 1:3000). Expression of target protein was normalized to beta-Actin (mouse monoclonal IgG1, sc47778, Santa Cruz Biotechnology, USA; 1:2000) housekeeping protein.
Quantitative RT-PCR
mRNA extraction was performed using a RNeasy Plus Mini Kit (Qiagen, Germantown, MD), and complementary DNA (cDNA) synthesis was performed using the High-Capacity cDNA reverse transcription kit (Thermo Fisher Scientific) according to the manufacturer’s recommendations. Each cDNA sample was diluted by fivefold after cDNA synthesis, and real-time PCR of each gene was carried out in duplicate on a QuantStudio 3 (Thermo Fisher Scientific) using SYBR Green (Power SYBR Green, Applied Biosystems). Ct values were read and exported from the QuantoStudio software, and the commonly used 2(-method was used to calculate relative gene expression using Gapdh or Hprt1 as the housekeeping gene. Primer sets utilized for real-time PCR are listed below:
Study approval
Animal procedures and protocols were performed in accordance with the IACUC at Washington University School of Medicine. Protocols used for recruitment of human participants, obtaining informed consent, collecting and deidentifying stool samples, and acquiring and deidentifying clinical metadata were approved by the Human Research Protection Office of Washington University School of Medicine. Stools specimens used for this study were collected from patients prior to bowel preparation for routine colonoscopy by the Washington University Digestive Disease Research Center Cores BioBank.
Statistical analysis and data availability
Data are presented as scatterplots showing individual data points, and dispersion is shown by means ± SD. Unpaired t test was used for comparing two groups, assuming equal variance, and ordinary one-way analysis of variance (ANOVA) test with multiple comparisons testing was used for more than two groups. A P value of <0.05 was considered significant. Prism v9.3.0 (GraphPad, San Diego, CA) was used for statistical analysis.
The microbiota 16D rRNA sequencing data will be submitted to European Nucleotide Archive, which will be publicly available. The RNA-seq dataset is deposited BioProject database ID PRJNA1010777. Data will become publicly available at publication.
Author contributions
DHK performed fecal transfers, immune cell phenotyping, and data analysis. DHK, AF, EJ, HK, RM, and KT performed animal models. AF and EJ performed immunofluorescence. BR and DK did and analyzed the 16S rRNA analysis. DHK and DA analyzed RNAseq analysis. LG and HSK did the immunoblotting. DHK and RDN designed the experiments, analyzed and interpreted the data, and wrote the manuscript.
Acknowledgments
We thank Drs. Elizabeth Newberry and Nicholas Davidson for sharing critical resources such as antibodies and primers. The Washington University Digestive Diseases Research Center Core, supported by NIH grant P30 DK DK052574, provided the fecal samples from the BioBank.
Disclosure statement
RDN and KGM are inventors on US patent11,241,480 B2 unrelated to this work.
Additional information
Funding
References
- Feve B, Bastard JP. The role of interleukins in insulin resistance and type 2 diabetes mellitus. Nat Rev Endocrinol. 2009;5(6):305–14. doi:10.1038/nrendo.2009.62.
- Jonas MI, Kurylowicz A, Bartoszewicz Z, Lisik W, Jonas M, Wierzbicki Z, Chmura A, Pruszczyk P, Puzianowska-Kuznicka M. Interleukins 6 and 15 levels are higher in subcutaneous adipose tissue, but obesity is associated with their increased content in visceral fat depots. Int J Mol Sci. 2015;16(10):25817–25830. doi:10.3390/ijms161025817.
- McLaughlin T, Liu LF, Lamendola C, Shen L, Morton J, Rivas H, Winer D, Tolentino L, Choi O, Zhang H, et al. T-cell profile in adipose tissue is associated with insulin resistance and systemic inflammation in humans. Arterioscler Thromb Vasc Biol. 2014;34(12):2637–2643. doi:10.1161/ATVBAHA.114.304636.
- Zheng C, Yang Q, Xu C, Shou P, Cao J, Jiang M, Chen Q, Cao G, Han Y, Li F, et al. CD11b regulates obesity-induced insulin resistance via limiting alternative activation and proliferation of adipose tissue macrophages. Proc Natl Acad Sci U S A. 2015;112(52):E7239–48. doi:10.1073/pnas.1500396113.
- Dalmas E, Venteclef N, Caer C, Poitou C, Cremer I, Aron-Wisnewsky J, Lacroix-Desmazes S, Bayry J, Kaveri SV, Clément K, et al. T cell–derived IL-22 amplifies IL-1β–driven inflammation in human adipose tissue: relevance to obesity and type 2 Diabetes. Diabetes. 2014;63(6):1966–1977. doi:10.2337/db13-1511.
- Fabbrini E, Cella M, Mccartney SA, Fuchs A, Abumrad NA, Pietka TA, Chen Z, Finck BN, Han DH, Magkos F, et al. Association between specific adipose tissue CD4+ T-cell populations and insulin resistance in obese individuals. Gastroenterol. 2013;145(2):366–374.e3. doi:10.1053/j.gastro.2013.04.010.
- Hong CP, Park A, Yang BG, Yun CH, Kwak MJ, Lee GW, Kim JH, Jang MS, Lee EJ, Jeun EJ, et al. Gut-specific delivery of T-Helper 17 cells reduces obesity and insulin resistance in mice. Gastroenterol. 2017;152(8):1998–2010. doi:10.1053/j.gastro.2017.02.016.
- Garidou L, Pomié C, Klopp P, Waget A, Charpentier J, Aloulou M, Giry A, Serino M, Stenman L, Lahtinen S, et al. The gut microbiota regulates intestinal CD4 T cells expressing RORγt and controls metabolic disease. Cell Metab. 2015;22(1):100–112. doi:10.1016/j.cmet.2015.06.001.
- Winer DA, Luck H, Tsai S, Winer S. The intestinal immune system in obesity and insulin resistance. Cell Metab. 2016;23(3):413–426. doi:10.1016/j.cmet.2016.01.003.
- Vijay-Kumar M, Aitken JD, Carvalho FA, Cullender TC, Mwangi S, Srinivasan S, Sitaraman SV, Knight R, Ley RE, Gewirtz AT. Metabolic syndrome and altered gut microbiota in mice lacking toll-like receptor 5. Sci. 2010;328(5975):228–231. doi:10.1126/science.1179721.
- Turnbaugh PJ, Gordon JI. The core gut microbiome, energy balance and obesity. J Physiol. 2009;587(Pt 17):4153–4158. doi:10.1113/jphysiol.2009.174136.
- Turnbaugh PJ, Hamady M, Yatsunenko T, Cantarel BL, Duncan A, Ley RE, Sogin ML, Jones WJ, Roe BA, Affourtit JP, et al. A core gut microbiome in obese and lean twins. Nature. 2009;457(7228):480–484. doi:10.1038/nature07540.
- Ridaura VK, Faith JJ, Rey FE, Cheng J, Duncan AE, Kau AL, Griffin NW, Lombard V, Henrissat B, Bain JR, et al. Gut microbiota from twins discordant for obesity modulate metabolism in mice. Sci. 2013;341(6150):1241214. doi:10.1126/science.1241214.
- Daniel H, Gholami AM, Berry D, Desmarchelier C, Hahne H, Loh G, Mondot S, Lepage P, Rothballer M, Walker A, et al. High-fat diet alters gut microbiota physiology in mice. ISME J. 2014;8(2):295–308. doi:10.1038/ismej.2013.155.
- Ley RE, Bäckhed F, Turnbaugh P, Lozupone CA, Knight RD, Gordon JI. Obesity alters gut microbial ecology. Proc Natl Acad Sci U S A. 2005;102(31):11070–11075. doi:10.1073/pnas.0504978102.
- Johnson AM, Costanzo A, Gareau MG, Armando AM, Quehenberger O, Jameson JM, Olefsky JM. High fat diet causes depletion of intestinal eosinophils associated with intestinal permeability. PLoS ONE. 2015;10(4):e0122195. doi:10.1371/journal.pone.0122195.
- Birchenough GM, Johansson ME, Gustafsson JK, Bergström JH, Hansson GC. New developments in goblet cell mucus secretion and function. Mucosal Immunol. 2015;8(4):712–719. doi:10.1038/mi.2015.32.
- Johansson ME, Phillipson M, Petersson J, Velcich A, Holm L, Hansson GC. The inner of the two Muc2 mucin-dependent mucus layers in colon is devoid of bacteria. Proc Natl Acad Sci U S A. 2008;105(39):15064–15069. doi:10.1073/pnas.0803124105.
- Wu WJH, Kim M, Chang LC, Assie A, Saldana-Morales FB, Zegarra-Ruiz DF, Norwood K, Samuel BS, Diehl GE. Interleukin-1β secretion induced by mucosa-associated gut commensal bacteria promotes intestinal barrier repair. Gut Microbes. 2022;14(1):2014772. doi:10.1080/19490976.2021.2014772.
- Atarashi K, Tanoue T, Ando M, Kamada N, Nagano Y, Narushima S, Suda W, Imaoka A, Setoyama H, Nagamori T, et al. Th17 cell induction by adhesion of microbes to intestinal epithelial cells. Cell. 2015;163(2):367–380. doi:10.1016/j.cell.2015.08.058.
- Kulkarni DH, McDonald KG, Knoop KA, Gustafsson JK, Kozlowski KM, Hunstad DA, Miller MJ, Newberry RD. Goblet cell associated antigen passages are inhibited during Salmonella typhimurium infection to prevent pathogen dissemination and limit responses to dietary antigens. Mucosal Immunol. 2018;11(4):1103–1113. doi:10.1038/s41385-018-0007-6.
- McDole JR, Wheeler LW, McDonald KG, Wang B, Konjufca V, Knoop KA, Newberry RD, Miller MJ. Goblet cells deliver luminal antigen to CD103+ dendritic cells in the small intestine. Nature. 2012;483(7389):345–349. doi:10.1038/nature10863.
- Kulkarni DH, Gustafsson JK, Knoop KA, McDonald KG, Bidani SS, Davis JE, Floyd AN, Hogan SP, Hsieh CS, Newberry RD. Goblet cell associated antigen passages support the induction and maintenance of oral tolerance. Mucosal Immunol 2020 Mar;13(2):271–282. doi:10.1038/s41385-019-0240-7.
- Knoop KA, McDonald KG, Kulkarni DH, Newberry RD. Antibiotics promote inflammation through the translocation of native commensal colonic bacteria. Gut. 2016;65(7):1100–1109. doi:10.1136/gutjnl-2014-309059.
- Knoop KA, McDonald KG, McCrate S, McDole JR, Newberry RD. Microbial sensing by goblet cells controls immune surveillance of luminal antigens in the colon. Mucosal Immunol. 2015;8(1):198–210. doi:10.1038/mi.2014.58.
- Round JL, Mazmanian SK. The gut microbiota shapes intestinal immune responses during health and disease. Nat Rev Immunol. 2009;9(5):313–323. doi:10.1038/nri2515.
- Enriquez JR, McCauley HA, Zhang KX, Sanchez JG, Kalin GT, Lang RA, Wells JM. A dietary change to a high-fat diet initiates a rapid adaptation of the intestine. Cell Rep. 2022;41(7):111641. doi:10.1016/j.celrep.2022.111641.
- Luck H, Tsai S, Chung J, Clemente-Casares X, Ghazarian M, Revelo X, Lei H, Luk C, Shi S, Surendra A, et al. Regulation of obesity-related insulin resistance with gut anti-inflammatory agents. Cell Metab. 2015;21(4):527–542. doi:10.1016/j.cmet.2015.03.001.
- Knoop KA, Kulkarni DH, McDonald KG, Gustafsson JK, Davis JE, Floyd AN, Newberry RD. In vivo labeling of epithelial cell–associated antigen passages in the murine intestine. Lab Anim (NY). 2020;49(3):79–88. doi:10.1038/s41684-019-0438-z.
- Callahan BJ, McMurdie PJ, Rosen MJ, Han AW, Johnson AJA, Holmes SP. DADA2: High-resolution sample inference from Illumina amplicon data. Nat Methods. 2016;13(7):581–583. doi:10.1038/nmeth.3869.
- Willis A, Bunge J. Estimating diversity via frequency ratios. Biometric. 2015;71(4):1042–1049. doi:10.1111/biom.12332.
- Willis AD, Martin BD. Estimating diversity in networked ecological communities. Biostatis. 2022;23(1):207–222. doi:10.1093/biostatistics/kxaa015.
- Martin BD, Witten D, Willis AD. Modeling microbial abundances and dysbiosis with beta-binomial regression. Ann Appl Stat. 2020;14(1):94–115. doi:10.1214/19-AOAS1283.
- Martino C, Morton JT, Marotz CA, Thompson LR, Tripathi A, Knight R, Zengler K. A novel sparse compositional technique reveals microbial perturbations. mSystems. 2019;4(1):4. doi:10.1128/mSystems.00016-19.
- Xie Y, Newberry EP, Young SG, Robine S, Hamilton RL, Wong JS, Luo J, Kennedy S, Davidson NO. Compensatory increase in hepatic lipogenesis in mice with conditional intestine-specific mttp deficiency. J Biol Chem. 2006;281(7):4075–4086. doi:10.1074/jbc.M510622200.