
ABSTRACT
Inflammatory bowel disease (IBD) is a persistent inflammatory condition that affects the gastrointestinal tract and presents significant challenges in its management and treatment. Despite the knowledge that within-host bacterial evolution occurs in the intestine, the disease has rarely been studied from an evolutionary perspective. In this study, we aimed to investigate the evolution of resident bacteria during intestinal inflammation and whether- and how disease-related bacterial genetic changes may present trade-offs with potential therapeutic importance. Here, we perform an in vivo evolution experiment of E. coli in a gnotobiotic mouse model of IBD, followed by multiomic analyses to identify disease-specific genetic and phenotypic changes in bacteria that evolved in an inflamed versus a non-inflamed control environment. Our results demonstrate distinct evolutionary changes in E. coli specific to inflammation, including a single nucleotide variant that independently reached high frequency in all inflamed mice. Using ex vivo fitness assays, we find that these changes are associated with a higher fitness in an inflamed environment compared to isolates derived from non-inflamed mice. Further, using large-scale phenotypic assays, we show that bacterial adaptation to inflammation results in clinically relevant phenotypes, which intriguingly include collateral sensitivity to antibiotics. Bacterial evolution in an inflamed gut yields specific genetic and phenotypic signatures. These results may serve as a basis for developing novel evolution-informed treatment approaches for patients with intestinal inflammation.
Introduction
Dysbiosis of the intestinal microbial community, characterized by alterations in bacterial composition and function, is a hallmark of inflammatory bowel disease (IBD). The nature of these microbial imbalances has been described extensively and at numerous complementary levels, including diversity parameters, taxonomic- and functional genomic changes, and at the level of gene expression.Citation1–6 This important body of work accounts for changes observed at the ecological level, while the latter also considers the potential contribution of phenotypic plasticity of gut microbes to disease susceptibility. Moreover, numerous studies have highlighted the association of dysbiotic microbial signatures with distinct clinical IBD subtypes, including Crohn’s disease (CD) and ulcerative colitis (UC), further emphasizing the intricate relationship between the gut microbiota and disease pathogenesis.Citation3,Citation4,Citation7
While research has focused extensively on the altered ecology of the gut microbiota in IBD, its potential for evolutionary change during disease pathogenesis has received comparatively limited attention. However, numerous recent studies have revealed the capacity of bacteria to undergo adaptive evolution within the host environment, including the gut [reviewed in Citation8]. This phenomenon is evident in both mouse modelsCitation9–11 and human subjects,Citation12 even in the absence of overt disease. Importantly, recent studies indicate that evolutionary changes also occur in the context of host inflammation. Elhenawy et al. focused on CD-related adherent-invasive E. coli (AIEC) using a murine model of chronic colonization, and revealed the evolution of lineages displaying enhanced invasive and metabolic capabilities.Citation13 Notably, they found that the fitness benefits conferred by increased motility were specific to the host environment, suggesting an evolutionary trade-off. In a second study exploring bacterial evolution in aging mice, significant differences in E. coli evolution between old and young mice were revealed.Citation14 The aged mouse environment exhibited increased inflammation, leading to the specific targeting of stress-related functions in E. coli.
These findings emphasize the importance of including evolutionary perspectives when studying dysbiosis of the gut microbiome. In particular, documenting bacterial evolution within the inflamed gut has the potential to reveal the timing of disease-specific signatures, i.e., it may help disentangle the classical “chicken or egg” dilemma in microbiome research,Citation15 as well as to shed light on potential trade-offs resulting from adaptive changes. Evolutionary trade-offs occur when an increase in fitness in one environment is accompanied by a decrease in fitness in another.Citation16,Citation17 These trade-offs can have significant therapeutic implications and are observed in various related fields, including antibiotic resistanceCitation18–21 and cancer treatment.Citation22–25 Thus, elucidating trade-offs associated with bacterial adaptations in the inflamed gut may offer insight into potential collateral effects on bacterial fitness and prove useful for developing novel treatment strategies based on evolutionary principles.
In this study, we investigated the evolutionary dynamics of resident gut bacteria during intestinal inflammation using an established gnotobiotic mouse model of IBD.Citation26 Through the monocolonization of both Interleukin 10-knockout and wildtype mice with a single E. coli strain (NC101), this setup allowed us to track genetic and phenotypic changes over the course of intestinal inflammation and to evaluate their potential clinical relevance. By employing multiomic analysis and high-throughput phenotypic screening, we identify genetic changes in bacteria, alterations in the metabolome, and differences in numerous phenotypic traits among bacterial populations that are specifically associated with the evolution in inflamed Il10-knockout mice. Remarkably, among the phenotypic changes observed in inflammation-adapted bacteria are sensitivities to antibiotics with a known therapeutic value in IBD. These results further confirm the importance of understanding bacterial adaptation to inflammation and suggest its more widespread study of patients as a means to develop novel treatment approaches.
Results
Gnotobiotic model of intestinal inflammation
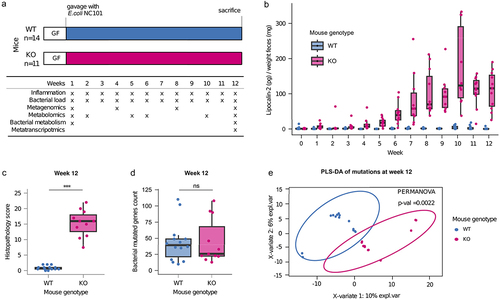
In order to capture the evolutionary dynamics of bacteria evolving in the context of intestinal inflammation, we implemented a previously established gnotobiotic model, for which inflammation develops upon colonization with the E. coli NC101 strain in IL10-deficient (Il10−/−; herein “KO”), but not wild type (WT) mice.Citation26 We performed two independent in vivo experiments (see Methods), in which WT (total N = 14) and KO (total N = 11) mice were monocolonized and monitored over a period of 12 weeks, with longitudinal sampling of feces for downstream multiomic analyses (; Table S1, see Methods). Inflammation was monitored via levels of lipocalin-2 in feces, which steadily and significantly increased in KO mice, but not in WT mice, already at one week post-inoculation (, Tables S2 and S3, Wilcoxon signed-rank test Benjamini-Hochberg-corrected P < .05). Histopathological assessment of colonic tissue at the endpoint reveals significantly higher pathology scores in KO mice than in WT mice (, Kruskal-Wallis H test Benjamini-Hochberg-corrected P < .05), further confirming that inflammation was specific to KO mice. The bacterial load in the fecal samples was stable throughout the experiment, as measured by CFU counts normalized by wet feces weight (Fig S1, Tables S4 and S5).
Figure 1. Application of a mouse model of IBD to test the effect of gut inflammation on the evolution of NC101.
Bacterial populations show genetic diversification in healthy and inflamed mice
To assess the genetic diversification of the bacterial populations during the evolution experiment, we performed shotgun sequencing on each single inoculum and all bacterial populations at weeks 1, 4, 8, and 12 and identified de-novo mutations (i.e., mutations that were not present in an inoculum; see Methods) by comparison with the genome of the ancestral strain. No statistically significant difference was observed in the number of mutations in the bacteria from KO and WT mice at any point in the experiment, suggesting that differences in the intestinal environment in which the populations evolved did not exert a measurable effect on the number of mutations (Figure S2, Table S6). One week after gavage, the bacterial populations showed a median number of 87 de-novo mutations, with a subsequent reduction at the following timepoints, although the differences are not significant (median at week 4 = 34, at week 8 = 45 and at week 12 = 36, Figure S2, Table S7 Wilcoxon signed rank test, corrected P > .05). Comparison of the evolved populations at week 12 with the ancestral strain reveals a median number of 39 mutations per mouse in WT and 26 in KO mice (). This indicates that the evolved bacterial populations in both groups of mice genetically differ from the ancestral strain. Although the unphased shotgun data do not enable us to directly analyze the role of genetic hitchhiking, Table S8 indicates the number of mutations at week 12 already present at each earlier time point. Interestingly, there remains a substantial (on average approx. 60% in each mouse genotype) proportion of de-novo mutations that arose between week 8 and 12, which suggests that a large proportion of the mutations cannot be explained by hitchhiking from standing genetic variation at earlier time points.
To test for overall differences in the de-novo mutations that accumulated in the bacterial populations that evolved in the WT and KO mice, we performed a partial least-squares discriminant analysis (PLS-DA) on all mutated loci (genes or intergenic regions differing in their nucleotide sequence compared to the inocula). We find a clear and significant distinction between the populations that evolved in the two mouse genotypes (, PERMANOVA P = .0022). The same result was observed when comparing single de-novo mutated genomic positions between evolved bacterial populations from WT and KO mice (Figure S3, PERMANOVA P = .0016).
Single nucleotide polymorphism differentiates evolved bacteria of all inflamed mice from evolved bacteria of healthy mice
To identify candidates for genetic changes that may be specifically selected in an inflamed environment, we focused on parallel mutations (i.e., genes or intergenic regions mutated in at least two mice that were gavaged with an independent inoculum; see Methods) and their associated functions. Analysis of the KEGG pathways encompassed by these loci reveals seven pathways unique to the bacterial populations from inflamed mice (). These pathways include those involved in amino acid metabolism, pyruvate metabolis, all of which have been associated with IBD in clinical settings.Citation27,Citation28 In addition to the pathways affected only in bacterial populations from the inflamed mice, 18 pathways are affected only in populations from healthy mice, and 18 other pathways are mutated in populations from both healthy and inflamed mice ().
Figure 2. Parallel evolution of E. coli in inflamed mice revealed a disease-specific genetic signature.
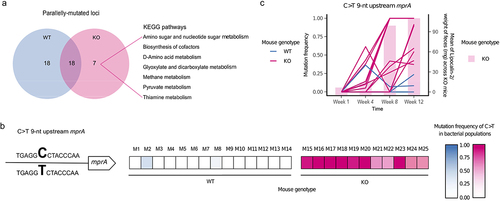
Univariate analysis reveals that only one particular locus is mutated at significantly higher frequencies in evolved bacterial populations from inflamed than healthy mice (Wilcoxon signed-rank test, corrected P = .001, Table S9), which is a single nucleotide polymorphism (SNP) (C>T) nine nucleotides upstream of the gene mprA (position 3,009,211) (). It is found in 11/11 KO mice at the endpoint with a frequency between 0.373 and 1, compared to 2/14 WT mice with a frequency between 0.085 and 0.239. Two other mutations are detected in the same intergenic region, although in a few populations only. The bacteria from one WT mouse harbors a C>A mutation at the same position (position 3,009,211) with a frequency of 0.052, whereas those from one inflamed mouse harbors a G>T SNP at a nearby position (position 3,009,194) with a frequency of 0.611.
To further investigate the most frequent C>T mutation, we analyzed its frequency over the course of the experiment (weeks 1, 4, 8, and 12). At week 1 the mutation is not present or below the detection threshold (minimum frequency of 0.05; see Methods), while at week 4, it is observed in 7/11 KO mice with a maximum frequency of 0.616, in comparison to 1/14 WT mice with a frequency of 0.364 (). After a steady increase in frequency at weeks 8 and 12, the mutation reaches fixation or near fixation in 7/11 KO mice and is also present at intermediate frequencies in the remaining 4/11 KO mice (). Importantly, the increase in frequency of the C>T mutation strongly coincides with the increase in inflammation as measured by lipocalin-2 levels, both in KO mice alone and when including all mice (, Figure S4; Spearman’s rank correlation rho P = .00005 for KO mice alone and P = 3.005e-11 for all mice).
Interestingly, closer inspection of the intergenic region between the hypothetical protein_02879 and the gene mprA reveals that this genomic region is a mutational hotspot, with six others positions in this region having mutated over the course of the in vivo experiment (Figure S5).
Taken together, we identify a C>T change at position 3,009,211 in the E. coli genome, which is a parallel mutation significantly associated with intestinal inflammation. This mutation is located upstream of mprA (also known as emrR), a transcriptional repressor of several genes, including those encoding the efflux pump EmrAB and AcrAB, and a putative outer membrane porin OmpC (also known as NmpC).Citation29–31
Bacterial populations show significantly different expression profiles in healthy and inflamed mice
To quantify the expression of genes that are part of the mprA regulon (mprA, emrAB, acrAB, and ompC),Citation29–31 as well as gain an overall view on differences in gene expression in WT- compared to KO-evolved bacterial populations, we perform metatranscriptomic sequencing of all week 12 bacterial populations. To test for overall differences in the gene expression, we perform a partial least-squares discriminant analysis (PLS-DA) on all genes, using RPKM (Reads per Kilobase per million Mapped Reads) as a proxy for gene expression. We find a clear and significant difference in overall gene expression between populations according to mouse genotype (Figure S6A, PERMANOVA P < .00005). Differential expression analysis performed with Deseq2 reveals 2,219 genes that are up- or down-regulated in one of the two conditions (1,022 upregulated for the populations from the healthy gut and 1,197 for the population from the inflamed gut; Benjamini-Hochberg corrected P < .05, Table S10). Analysis of the KEGG pathways encompassed by these upregulated genes reveals 25 pathways unique to the bacterial populations from inflamed mice (Figure S6B). These pathways include Ribosome, Aminoacyl-tRNA biosynthesis, Glutathione metabolism, RNA degradation, Folate biosynthesis, Sulfur relay system, Arginine biosynthesis, Protein export, Pantothenate and CoA biosynthesis, and Homologous recombination, among others (Table S11). Interestingly, mprA and ompC, which can be putatively regulated by mprA,Citation30 are significantly more expressed in the populations that evolved in the inflamed gut (Table S10; Figure S6C).
Increase in fitness of evolved bacteria in an inflammatory environment
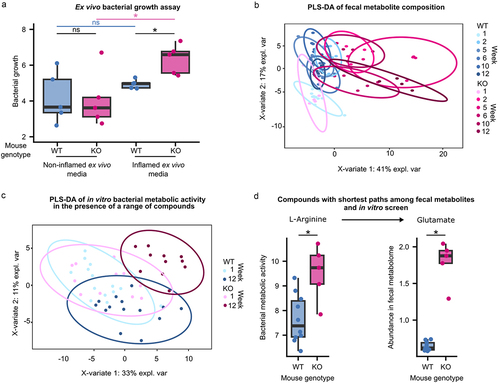
As parallel mutations are a strong indication of adaptation by natural selection, we hypothesized that the evolved bacterial populations may have a fitness advantage in the environment in which they evolved, and thus next focused on the phenotypes present in the evolved bacterial populations. To test whether evolution in the inflamed mouse gut confers a fitness advantage to E. coli, we performed “reciprocal transplant” experiments based on ex vivo assays using filtered cecal content from inflamed versus non-inflamed mice, collected after sacrifice (referred to subsequently as “ex vivo media”). Populations of E. coli from fecal samples collected at week 12 from a subset of mice (N = 5 KO mice and N = 5 WT mice) were cultured in ex vivo media derived from both inflamed and non-inflamed mice. While no significant difference is observed between bacteria from WT and KO mice when grown in non-inflamed ex vivo media (Kruskal-Wallis test P = .9168; ), bacteria from KO mice grow significantly better than those from WT mice in the inflamed ex vivo media (Kruskal-Wallis test P = .009023). Notably, bacteria from KO mice grow significantly better in the inflamed ex vivo media than in the non-inflamed ex vivo media (Kruskal-Wallis test P = .0472), while bacteria from WT mice show no difference in growth in the two media (Kruskal-Wallis test P = .4647). Thus, bacteria that evolved in the inflamed gut possess a fitness advantage in the inflamed gut environment, suggesting that evolution in the inflamed gut results in specific adaptation to that environment.
Figure 3. Phenotypic characterization of evolved E. coli and the inflammatory environment in which they were selected.
Inflamed gut environment displays an altered metabolomic profile
To gain a better understanding of the environment to which these bacteria are adapted, we performed metabolomic analysis of fecal samples spanning the experimental time course (weeks 1, 2, 5, 6, 10, and 12) using 1 H-NMR in mice from one of the two experiments. While WT and KO mice initially display very similar fecal metabolomes (PERMANOVA P = .754), with time, the fecal metabolic composition begins to vary concurrently with the onset of inflammation and the frequency of the C>T SNP upstream of mprA (). By week 12 of the evolution experiment, WT and KO mice exhibit notable differences in their fecal metabolomes, as revealed by PLS-DA (PERMANOVA P = .001; , Figure S7). Among the 77 metabolite features initially found in the samples from week 1, none show significantly different abundances between the WT and KO mice (Table S12). In contrast, in the week 12 samples, 59 of the 77 detected features exhibit significant differences in abundance between WT and KO mice (Benjamini-Hochberg corrected P < .05; Table S13). Notably, 42 are significantly more abundant in KO mice than in WT mice, including all detected amino acids that were significantly enriched in KO mice based on KEGG pathway analysis of parallelly mutated loci. Among the 17 enriched features in the WT mice, most are putatively annotated as (poly-)saccharides (Figure S8). Notably, variations in fecal metabolic composition at week 12 could arise from changes in both the host, linked to inflammation-related changes, and the bacterial population, associated with bacterial adaptation to inflammation.
Phenotypic profiling of evolved bacteria compared to ancestor
Having established that the environment in which the bacteria evolved significantly differs according to the mouse genotype, we next focused on specific bacterial traits that may have changed as a consequence of adaptation. Accordingly, we tested the metabolic activity of the E. coli populations using the Biolog GENIII test panel, which comprises 94 unique biochemical tests, including a range of compounds (e.g., sugars, amino acids, and short-chain fatty acids), conditions (e.g., different pH and salt concentrations), and chemical sensitivities (e.g., antibiotics; see Methods). Similar to the pattern observed for the fecal metabolome, the overall bacterial metabolic activity across all tested conditions is similar among populations derived from the WT and KO mice at week 1 of the experiment (PERMANOVA, P = .519; Figure S9), as also evidenced by the overlapping of the groups in the PLS-DA based on the overall metabolic activity observed in the BIOLOG GENIII tests (). However, by week 12, the overall pattern of metabolic activity across all tested conditions significantly differs between the bacteria from KO and WT mice (PERMANOVA, P = .005, Figure S9). These results suggest that adaptation to the inflamed intestine results in significantly altered bacterial metabolism and the ability to grow in the presence of different inhibitors. Among the compounds included in this screen, bacteria from WT and KO mice from week 1 showed significantly different metabolic activity in only one compound (Table S14). In contrast, bacteria from WT and KO mice at week 12 display significantly different metabolic activities in the presence of 31 compounds (Wilcoxon signed-rank test, corrected P < .05; Table S15, Figure S10).
To determine whether the differences in growth observed among the 31 compounds at week 12 may be related to the altered metabolomic environment of inflamed mice, we compared our BIOLOG GENIII results to the compounds found to be enriched in the fecal metabolome of the KO mice. Interestingly, metabolomics analysis revealed a significant enrichment of the amino acid histidine in the feces of KO mice compared to that of WT mice (Fig S8). In our in vitro metabolic assay, we found that bacteria adapted to the inflamed intestine had a significantly higher ability to metabolize histidine than bacteria adapted to the healthy intestine (Fig S10). Thus, adaptation to an environment enriched in histidine may have conferred a higher metabolic activity in the presence of this amino acid.
To further explore how the results of our in vitro phenotypic analyses may relate to the fecal metabolomic profile observed in vivo, we performed a shortest path analysis on the metabolic network of the genome-scale metabolic model of E. coli NC101Citation32 using metabolomic data and data from the in vitro metabolic activity screen (BIOLOG GENIII plates; see Methods). Pairs of compounds from the two datasets that are converted easily to each other by means of pathway length include glutamate and L-arginine (, Table S16). Glutamate is significantly more abundant in the feces of the inflamed mice (Figure S8), whereas bacteria adapted to the inflamed intestine are capable of significantly higher metabolism in the presence of L-arginine (Figure S10). This result suggests that the bacteria may be converting arginine to glutamate, resulting in the enrichment of glutamate in KO mice (, Table S16). A second pair of compounds showing the same pattern are taurine and L-arginine. However, analysis of the potential pathways between these compounds through flux variability analysis revealed that taurine cannot be produced by E. coli NC101 under any of the tested conditions (Figure S11). Additionally, taurine abundance increased steadily over time only in KO mice (Figure S12). Thus, taurine is most likely to be produced by the host.
Finally, we examined 31 significant differences in metabolic activity observed between bacteria from WT and KO mice at week 12, in light of their potential clinical value. A first compound of interest is N-acetyl beta-D mannosamine (NADM), which is a precursor to sialic acid and has been shown to promote E. coli colonization of inflamed gut.Citation33 Our E. coli populations show higher levels of metabolic activity in the presence of NADM after adaptation to the inflamed mouse gut. In contrast, E. coli evolved in the non-inflamed mouse gut show no such change (). These findings suggest that increased virulence may occur in the context of adaptation to an inflamed environment.
Figure 4. E. coli adapted to the inflamed gut show phenotypes with clinical relevance.
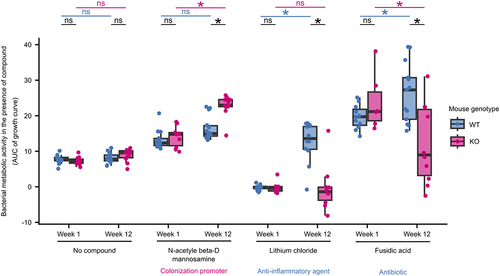
Another interesting candidate is lithium chloride, which is known to have anti-inflammatory effects via the inhibition of a key host regulator of inflammation, glycogen synthase kinase-3 betaCitation34. In our experiment, bacterial populations evolved in WT mice display improved metabolic capacity in the presence of lithium chloride compared to the ancestor, while no such change is observed among those evolved in the KO mice. Thus, our results suggest that an inflamed intestinal environment may prevent the acquisition of this phenotype in E. coli.
A final promising category of candidates are antibiotics, including fusidic acid, vancomycin, and lincomycin. When considering the loading plot of the PLS-DA of our Biolog GENIII data (Figure S13; reporting which compounds contribute the most to the separation between groups), all three of these antibiotics contributed to the overall significant difference in the metabolic activity of the bacteria from WT and KO mice (, Figure S13). Furthermore, fusidic acid is also significantly different between bacteria from the two mouse genotypes in the univariate analysis (Wilcoxon signed-rank test, corrected P < .05). Fusidic acid is an antibiotic that targets gram-positive bacteria, and is commonly used to treat skin infections.Citation35 Interestingly, it was also shown to be effective in reducing disease activity in a small number of patients with Crohn’s disease, which is thought to be due to its immunosuppressive properties.Citation36,Citation37 We observe E. coli to display decreased metabolic activity in the presence of fusidic acid after adaptation to the inflamed intestine but increased metabolic activity after adaptation to the healthy intestine. These results suggest a potential trade-off between adaptation to inflammation and resistance to fusidic acid, where E. coli adapted to inflammation also show lower resistance to fusidic acid.
In summary, we observe widespread phenotypic differences among the bacterial populations that evolved in the inflamed intestines of KO mice compared to non-inflamed WT mice. These results relate to differences in the metabolome between these two intestinal environments and include phenotypes that carry the potential for exploitation in a clinical setting.
Discussion
In this study, we describe the findings of an in vivo bacterial evolution experiment using a gnotobiotic mouse model of IBD. We find that E. coli evolved in the inflamed mouse gut accumulated specific genetic changes and that these changes confer a fitness advantage in the inflamed intestinal environment, which significantly differs in its metabolome. Furthermore, we show that E. coli populations in the gut of healthy and inflamed mice have a distinct metatranscriptomic profile. Finally, we showed that adaptation to the inflamed intestine resulted in several phenotypic differences that may be clinically relevant, such as differential tolerance to antibiotics.
Recent studies have highlighted how strain-level changes in members of the gut microbiome can play a crucial role in the adaptation of the gut microbiome to novel conditions.Citation14,Citation38,Citation39 However, the effects of inflammation on the evolution of gut commensals remain largely unexplored. Barreto et al. (2020) followed the adaptation of E. coli in mice of different ages in vivo.Citation14 They showed that the aged mouse gut, which also showed high levels of inflammation, was a more stressful environment for E. coli, resulting in a higher number of mutations and more severe selective pressure on commensals, particularly in bacterial loci associated with stress-related functions. Notably, we find no difference in the number of mutations acquired by E. coli in inflamed mice, suggesting that other factors associated with aging may contribute to the increased bacterial mutation rate observed by Barreto et al. (2020).Citation14
More recently, Tawk et al. (2023) conducted a study of mice monocolonized with Bacteroides thetaiotaomicron that were subsequently infected with Citrobacter rodentium and developed inflammation. In this setting, a single-nucleotide variant of B. thetaiotaomicron, which had a higher tolerance to oxidative stress than the ancestral variant, underwent selective sweeps and dominated the intestinal community.Citation39 Although the experimental setup and duration of inflammation differ between this study and the current study, our candidate mutation is also known to be associated with oxidative stress.Citation40 This is consistent with the observations of Barreto et al. (2020) and Tawk et al. (2023)Citation14,Citation39 suggesting that oxidative stress is a key selective pressure in an inflamed environment. Moreover, oxidative stress plays a major role in the pathophysiology of IBD.Citation41 Interestingly, this is also confirmed by our metatranscriptomic analysis. In particular, 14 of the genes upregulated in KO mice belong to the pathway of glutathione metabolism (eco00480), and previous studies demonstrated that glutathione metabolism is involved in protection against oxidative stress.Citation42,Citation43 In addition, Sakamoto et al. reported mprA to be involved in resistance to oxidative stress, together with the activity of gshA (glutathione synthase), which is also upregulated in our populationsCitation40. Additionally, our metatranscriptomic data confirm the findings of Tawk et al., suggesting a role for vitamin B6 metabolism.Citation39 We observe not only the upregulation of nine genes belonging to the vitamin B6 metabolism (eco00750), but also a significantly higher concentration of aspartate, a substrate of vitamin B6-dependent enzymes, in the feces of the inflamed mice.Citation39
Importantly, many of our findings are consistent with the observations made in clinical IBD settings. First, the KEGG pathways affected by parallel mutations specific to the inflamed mice () include D-amino acid-, pyruvate-, and thiamine metabolism. This is in line with previous reports that the basic metabolism is reduced in IBD.Citation27,Citation44
Second, the metabolomic profiling of the fecal samples reveals that KO mice have significantly higher levels of many amino acids, which was also reported in IBD patients.Citation45 Furthermore, the results of our shortest path analysis suggest that bacterial production of glutamate from arginine may underlie the enrichment of glutamate in the inflamed gut. Although taurine-arginine was also one of the shortest paths we found, taurine could not be produced by E. coli according to the flux variability analysis. Thus, taurine is most likely to be produced by the host. Taurine is known to be a promoter of colonization resistance, and infection has been shown to prime the microbiota against subsequent infections by inducing host production of taurine.Citation46 Indeed, taurine was also reported to ameliorate inflammation in rat models of inflammation.Citation47 Furthermore, taurine is a substrate for the microbiota-driven production of hydrogen sulfideCitation48 and arginine is a precursor to polyamines that can protect against reactive species such as hydrogen sulfide.Citation49 Thus, bacterial adaptation for improved metabolic activity in the presence of arginine may be a response to the host-induced inflammatory changes in the intestine.
Third, E. coli adapted to the inflamed mouse gut also showed some clinically relevant phenotypes (). N-acetyl beta-D mannosamine (NADM) is a precursor of polysialic acid, a pathogenic determinant, and studies have shown that it can promote colonization of the inflamed intestine by pathogenic E. coli.Citation33,Citation50 As NADM is a crucial player in mediating pathogenic activity in the inflamed intestine, the improved metabolic activity of inflammation-adapted E. coli observed in the presence of NADM may be a phenotype associated with virulence. This is consistent with reports of virulence-associated phenotypes, such as hypermotility, selected during the evolution of an adherent-invasive E. coli in the inflamed mouse gut.Citation13 Furthermore, lithium chloride is known to inhibit the activity of glycogen synthase kinase 3-β, a master regulator of host chronic intestinal inflammation mediated by toll-like receptors, and has been used as a treatment in a mouse model of IBD.Citation34,Citation51 However, the effect of lithium on the microbiome has not yet been elucidated. E. coli tolerance to lithium ions is regulated through antiporters, and proline has been shown to induce the uptake of lithium ions by E. coli.Citation52,Citation53 Our finding that adaptation to the healthy mouse intestine confers improved metabolic capacity in the presence of lithium chloride, while adaptation to the inflamed intestine does not (), implies that lithium may affect both the host and microbiome. This may also imply that adaptation to the healthy intestine affects the antiporter-dependent detoxification system of E. coli, resulting in improved ion tolerance.
Lastly, we found that bacterial adaptation to the inflamed gut decreases metabolic activity in the presence of fusidic acid, while adaptation to the healthy mouse gut improved metabolic activity in the presence of fusidic acid (). Fusidic acid is an antibiotic with T cell-specific immunosuppressive effects that also stimulate gastric mucus secretion. Furthermore, it was successfully applied to alleviate inflammation in rats, as well as to treat selected patients with Crohn’s disease for whom conventional treatment was ineffective.Citation36,Citation37 However, the effect of fusidic acid on the gut microbiome in IBD has not yet been studied. Our results imply that bacterial adaptation to the inflamed gut can result in a trade-off for resistance to fusidic acid. Importantly, such trade-offs are a fundamental concept in evolutionary medicine, where increased fitness in one context results in a consequent decrease in fitness in another context, and are proposed as possible potent therapeutic strategies against antibiotic resistance and cancer.Citation18,Citation54 Thus, the therapeutic effect of fusidic acid observed in patients with CD is due to trade-offs in microbiome adaptation to the inflamed gut and/or its immunosuppressive effects on the host. Interestingly, it is known that lipocalin-2 plays a role in iron-sequestration, which has been reported to have a role in antibiotic resistance and sensitivity.Citation55 It is thus worth noting that there is no enrichment of genes involved in iron metabolism among the mutated genes in the populations evolved in the inflamed gut, as well as among the upregulated genes in these populations.
Current treatment options for IBD are largely limited to the treatment of inflammation with a chronic risk of relapse. Corticosteroids, aminosalicylates, and immunosuppressive agents are the conventional drugs of choice, but the safety and efficacy of novel emerging strategies remain unclear (reviewed in Citation56). Given that disease-specific aspects of the microbiome have been shown to remain stable over long periods in IBD patients despite treatment,Citation57 a persistent microbial influence on the intestinal environment may be a key risk factor for relapse. Thus, our results highlight new avenues of research involving evolution-informed therapeutic strategies that exploit trade-offs to either prevent adaptation to inflammation and/or help restore desirable ancestral traits in the microbiome.
While our results provide valuable insights into the potential role of evolution-informed therapeutic strategies, it is important to acknowledge that it remains unknown whether the same or similar genotypic and phenotypic changes would be observed in the context of a complex microbial community as present in the human gut microbiome. Future work should therefore include similar in vivo evolution experiments using a complex or synthetic microbial community.
Methods
Bacterial strains
E. coli NC101 strain was obtained from Balfour Sartor, University of North Carolina, Chapel Hill, NC, USA.Citation58 Escherichia coli NC101 is a mouse strain isolated from the intestine of a WT 129S6/SvEv mouse raised under specific-pathogen-free (SPF) conditions.Citation58 The strain was cultured at 37°C in Luria Bertani (LB) medium with continuous shaking. The ancestor strain for the in vivo experiment was obtained by plating the overnight culture on LB agar and picking single colonies to be used as inocula for the in vivo evolution experiment.
Mouse model
Two independent experiments were conducted to study E. coli adaptation to the inflamed gut (Table S1). In the first experiment, “Exp1”, a single inoculum was used for all mice. In order to ensure that mutations present in a common inoculum could not be falsely identified as “parallel” mutations, the second experiment, “Exp2” was performed with independent inocula for each mouse. Accordingly, our definition of a parallel mutated gene requires it to be mutated in at least two mice that were gavaged with a different inoculum. Germ-free (GF) C57BL/6NTac (WT) and C57BL/6NTac-Il10em8Tac (KO) male mice were purchased from Taconic Biosciences (Silkeborg, Denmark) and housed in the Germ-Free Animal Facility at the Max Planck Institute for Evolutionary Biology (Ploen, Germany). GF mice were maintained in sterile isolators (MB-10, Quip Laboratories, Delaware, USA) and fed sterilized 50 kGy V1124–927 Sniff (Soest, Deutschland). The animals were allocated to independent cages with a maximum of four mice per isolator until they reached an age of 12 weeks. Detailed information regarding the mice used in this study is presented in Table S1. Initially, 19 WT and 15 KO mice were mono-colonized with the E. coli NC101 strain. Only mice that survived the duration of the experiment (12 weeks; N = 14 WT mice and N = 11 KO mice) were included in the study. The study was performed in accordance with the approved animal protocols and institutional guidelines of the Max Planck Institute for Evolutionary Biology, Plön. Mice were maintained, and experiments were performed in accordance with FELASA guidelines and German animal welfare law (Tierschutzgesetz § 11; permits from Veterinäramt Kreis Plön: PLÖ-0004697 and Ministerium für Landwirtschaft, ländliche Räume, Europa und Verbraucherschutz: 107-11/18).
The strains used as inocula were diluted in sterile PBS, and 200 μl (equivalent to 1 × 10^8 bacteria) were gavaged using a sterile gavage needle (Reusable Feeding Needles 18 G, Fine Science Tools, Heidelberg, Deutschland). Fecal pellets were collected in a sterile manner twice a week to study the evolution of E. coli for a total of 24 samples collected per mouse and once a week for metabolomic investigation. An overview of the sampling plan is presented in .
Histopathological evaluation
Mice were sacrificed at week 12, and colon tissue was collected and arranged to form a Swiss-roll.Citation59 Hematoxylin and eosin-stained sections of colonic tissue Swiss rolls were scored by two independent researchers in a blinded manner using the scoring system described by Adolph et al. (2013).Citation60 The score is composed of five sub-scores: mononuclear cell infiltrate, crypt hyperplasia, epithelial injury or erosion, polymorphonuclear cell infiltrates, and transmural inflammation. Each of the first four sub scores was awarded a score from 0 to 3, whereas transmural inflammation was scored from 0 to 4, with a higher score indicating a more severe level of inflammatory activity. The sum of the sub scores was then multiplied by a factor based on the percentage of affected bowel length (1= < 10%; 2 = 10–25%; 3 = 25–50%; 4 = >50%).
Feces processing
Feces weight and consistency were recorded. Feces were homogenized in 1.5 ml sterile PBS on a horizontal vortexer (Vortex Mixer Model Vortex-Genie® 2, Scientific Industries, Bohemia, NY, USA) at maximum speed for 30 min, then separated in three aliquots of 500 μl. Each aliquot was centrifuged at 10,000 rpm for 5 min. The supernatants were transferred to a new tube and stored at −20°C for subsequent lipocalin-2 concentration measurement. One pellet aliquot was resuspended in 500 μl of PBS and used to prepare a 12-point 1/10 dilution series in a 96-well plate. Ten μl were plated onto an LB agar plate. Plates were incubated overnight at 37°C and colonies were counted to estimate the bacterial load. The bacterial load in the fecal samples was calculated by normalizing CFU counts by wet feces weight. The second pellet aliquot was resuspended in 1 ml RNAlater and stored at + 4°C for 24 h, after which the tube was centrifuged at 10,000 rpm for 5 min to remove the RNAlater, and the pellet was stored at −20°C for subsequent nucleic acid extraction and sequencing. The final pellet aliquot was resuspended in 500 μl of LB containing 20% glycerol and stored at −70°C for further phenotypic investigation.
Lipocalin-2 quantification
Lipocalin-2 concentration in the supernatants was measured using the commercial kit Mouse Lipocalin-2/NGAL DuoSet ELISA (R&D Systems, Minneapolis, MN, USA) for mouse Lipocalin-2 (DY1857). Testing was performed according to the manufacturer’s instructions. The samples were diluted 1:10 and added to the plate. The optical density of each well was determined using a plate reader (SPARK, Tecan, Tecan, Männedorf, Switzerland) at 450 and 540 nm. Lipocalin-2 concentrations were normalized to the weight of feces for each sample.
Shotgun sequencing
Total DNA and RNA were extracted using the ZymoBIOMICS DNA/RNA Mini Kit (Zymo Research, Freiburg, Germany), following the manufacturer’s instructions from fecal pellets collected at weeks 1, 4, 8, and 12, as well as from the E. coli NC101 cultures that served as inocula. Shotgun metagenomic sequencing was performed on four Illumina Nextseq (HighOutput 300 cycles) sequencing runs at the Max Planck Institute for Evolutionary Biology (Plön, Germany).
Raw reads were filtered and trimmed to ensure good quality using Cutadapt (version 3.2).Citation61 First, any pair containing Ns, homopolymers (10 nucleotides or more), or those longer than 151 bp were discarded. Sequences were trimmed with a quality cutoff of 25 at both ends for both reads, Illumina adapters were removed, and sequences shorter than 50 bp were discarded. Good quality sequences were then filtered to exclude mouse sequences (mouse_C57BL) using KneadData.Citation62 A final filter was applied to remove any adapter leftovers using TrimmomaticCitation63 and sequences shorter than 105 bp were discarded. Mutations were identified using BreseqCitation64 by comparing the obtained metagenomes with the reference genome of E. coli NC101 (PRJNA596436) using default options (i.e. mutations identified by a threshold frequency > 0.05) and by subtracting the mutations that were detected in the respective inoculum. Gdtools was used to compare mutations in the samples.
Metatranscriptomics
Depletion of rRNA from extracted RNA was performed using QIAseq FastSelect−5S/16S/23S (Qiagen). Samples were incubated at 89°C for 8 minutes. Libraries for metatranscriptomics were prepared using the Illumina TruSeq® Stranded mRNA Library Prep Kit (Illumina) according to the manufacturer’s instructions. Shotgun metatranscriptomic sequencing of week 12 fecal samples was performed on an Illumina NextSeq 500/550 using the HighOutput Kit v2.5 (75 cycles).
Quality control and trimming were performed as described above for shotgun sequencing. Gene expression in the evolved population was calculated in Geneious (v 2022.2.1; https://www.geneious.com) by mapping reads to the reference genome of E. coli NC101 (PRJNA596436). Differential expression was calculated using DeSeq2Citation65 as implemented in Geneious, using the parametric model and by assigning the conditions to “WT-” or “KO-evolved”.
Measurement of the metabolic activity of bacteria
Biolog GENIII MicroPlates (Biolog, Hayward, CA, USA) was used to investigate the metabolism of evolved populations. Evolved populations stored in glycerol were inoculated onto the Inoculation Fluid-A (IF-A) provided by the manufacturer such that the OD600 was between 0.02–0.05. After adjusting the OD600, the inoculated IF-A was shaken well and distributed into a Biolog GENIII MicroPlate (100 μl in each well). The plate was then covered with a sterile Breathe-Easy membrane (Sigma-Aldrich, St. Louis, MO) and placed in a plate reader (SPARK, Tecan, Männedorf, Switzerland) at a preset temperature of 37°C. The plate reader was then run with the following parameters: temperature: 37°C, shaking: 250 rpm, OD590 measurement: every 15 min, total running time: 36 h. From the OD590 measures, area under the curve (AUC) was used as a proxy for metabolic activity. The Biolog assay was repeated for populations from fecal samples collected at weeks 1 and 12 from all 25 mice, with two replicates each.
Ex vivo assay
The cecal content was collected from each mouse during dissection at the end of the second experiment. The amount of cecal content from each mouse was different based on the amount in the cecum at the time of dissection. Sterile PBS was added to the cecal content, and the volume was adjusted based on the amount of cecal content collected from each mouse (20 mg/ml). The protocol was adapted from Kitamoto et al. (2020).Citation66 The PBS-cecal content mixture was centrifuged twice (once at 500g for 5 min and again at 10,000g for 5 min) and then filter-sterilized through a 0.2 μm filter. The ex vivo medium from each mouse was mixed well and 100 μl was spread onto an LB agar plate to ensure that they were sterile. Ex vivo media from all healthy mice were pooled, as were the ex vivo media from all inflamed mice, resulting in two ex vivo media. Populations from fecal samples collected at week 12 from a subset of mice (N = 5 KO and N = 5 WT mice) were inoculated into the ex vivo media and incubated in the TECAN Spark plate reader at a preset temperature of 37°C. The plate reader was then run with the following parameters: temperature: 37°C, shaking: 250 rpm, OD600 measurement: every 15 min, total running time: 36 h. From the OD600 measures, area under the curve (AUC) was used as a proxy for growth.
Metabolomic evaluation of the fecal pellets
During the second experiment, samples for metabolomic investigation were collected once a week and snap-frozen in liquid nitrogen. Samples were stored at −70°C and delivered at Helmholtz Center Munich for metabolomic investigation. A non-targeted metabolomics approach of mouse fecal samples was undertaken using NMR spectroscopy. To extract the aqueous metabolites, we homogenized 2–3 fecal pellets in 1 ml water using ceramic beads (NucleoSpin, Macherey – Nagel, Dueren, Germany) and a TissueLyser (Qiagen, Hilden, Germany), mixing the sample for 3 × 30 s at 4,500 rpm with a 10 s cooling break (<0°C). Subsequently, the homogenate was centrifuged (13,000 rpm for 10 min at 4°C), the supernatant evaporated using a SpeedVac, and the dried extract reconstituted in 200 µl NMR buffer (10% D2O, 100 mM phosphate buffer with 0.1% trimethylsilyl-tetradeuteropropionic acid (TSP), pH 7.4). Samples were transferred to 3 mm NMR tubes, and immediate NMR analysis was performed in a randomized order with a Bruker 800 MHz spectrometer operating at 800.35 MHz equipped with a Bruker SampleJet for sample cooling (283 K) and a QCI-cryogenic probe. A standard one-dimensional pulse sequence (noesygppr1d) provides an overview of all molecules. The acquisition parameters were as follows: water suppression irradiation during recycle delay (2 s), mixing time of 200 ms, 90 °pulse of 12.5 µs. We collected 512 scans of 64 K data points with a spectral width of 12 ppm. The software TopSpin 3.6 (Bruker BioSpin, Ettlingen, Germany) was used for processing, i.e., Fourier transformation, manual phasing, baseline correction, and calibration to TSP (δ 0.00). Data were imported into Matlab software R2011b (Mathworks, Natick, MA, USA) and further processed, i.e., the water region was removed, baseline adjustedCitation67 and spectra normalized.Citation68 Relative quantification of metabolites was performed using the peak heights of selected peaks and compounds identified as described in our published workflow.Citation69
Shortest path analysis
For the shortest path analysis, we used the metabolic model reconstructed using the AGORA2 resource for the human microbiome.Citation32 The model was translated into a graph with metabolites as nodes, and the reactions converting metabolites into one another as edges. The shortest path analysis was performed using the Dijkstra algorithm implemented in the igraph package (1.3.5) of R (4.2.2).Citation70,Citation71 To avoid shortcuts through the network using cofactors as intermediate compounds, the edges were weighted by the sum of degree of the nodes it connected, as suggested by Faust et al.Citation72 For each compound from the in vitro screen, we calculated the set of shortest paths to all other metabolites in the model. Each value in the set was the average shortest path of the five shortest paths between two metabolites, which was performed to account for uncertainties in pathway calculation based only on the network properties. For our analysis, we only considered pathways between compounds from the two datasets, which were among the shortest 5% of pathways in a pathway set.
Prediction of possible conversions between metabolites
We wanted to understand whether the altered metabolic capabilities observed in the Biolog plates or the changed environmental conditions observed in the metabolomic data, together with the metabolism of E. coli could contribute to the observed changes in the metabolomic data between KO and WT mice. To this end, we performed flux variable analysis (FVA) on the metabolic model for E. coli NC101 (retrieved from AGORA2).Citation32 We defined every significantly detected metabolite in the Biolog GENIII experiment or the metabolomic data set as a possible source metabolites, while the metabolites from the metabolomic data set were defined as target metabolites. Metabolites found in the metabolomics are those known to be present in vivo. Compounds found to be significantly differentially metabolized in the Biolog GENIII assay are those that we know the evolved bacteria are capable of metabolizing. By using the sum of these as the source and the detected metabolites as the target, we aimed to capture as many of the possible conversions as possible to help explain the composition of the in vivo environment and the role of bacterial metabolism in shaping it. For the simulation background, we employed a minimal medium (Table S17), removed D-Glucose, and adjusted the oxygen level according to the conditions tested (anoxic = 0 mmol h− 1 gDW− 1, microaerobic = 1 mmol h− 1 gDW− 1, aerobic = 10 mmol h− 1 gDW− 1). For the simulation, we added each source metabolite individually to the growth medium (100 mmol h− 1 gDW− 1) and calculated the maximum production rates of the target metabolites, assuming that at least 50% of maximum growth rates were achieved. We considered a maximum flux of > 1e− 6 as the possible production of the target metabolite from the source metabolite. FVA was performed in cobrapyCitation73 and analyses were performed using the data.table and ggplot2 packages for R.
Statistical investigation
Statistical analyses were performed using packages in RStudio 2023.03.0 + 386. For PERMANOVA analyses, adonis was usedCitation74 on Bray-Curtis distances of the dataCitation75 and mixomics was used for PLS-DA.Citation76 AUCs were calculated using desctools.Citation77
Author contributions
MV, DU, and JB conceptualized the study; RU, NAA, MV, SH, MAG, OV, SK and DU performed experiments; RU, NAA, MV, SH, FT, JH, and PR analyzed the data; JT and CK performed the metabolic modeling; RU, NAA, and AD performed the statistical analyses.
RU, NAA, DU, and JB wrote the first draft of the manuscript. All coauthors revised the manuscript and agreed to its publication.
Supplementary_tables_GutMicrobes_rev1.xlsx
Download MS Excel (2.6 MB)Supplementary_figures_GutMicrobes_rev1 clean.docx
Download MS Word (2.5 MB)Acknowledgments
We are grateful to Balfour Sartor for providing the NC101 E. coli strain, the MPI-Plön mouse team for support with animal experiments, Britt Marie Hermes for support in manuscript preparation, and Wael Elhenawy and Isabel Gordo for their helpful and constructive discussions. The authors acknowledge the use of ChatGPT for the purpose of supporting the drafting of material for the introduction section.
Disclosure statement
No potential conflict of interest was reported by the author(s).
Data availability statement
Escherichia coli NC101 reference genome is available under Bioproject number PRJNA596436. Shotgun metagenomic sequencing of the inocula and evolved populations and metatranscriptomic of the populations at week 12 are available with Bioproject number PRJNA1012288.
Supplementary material
Supplemental data for this article can be accessed online at https://doi.org/10.1080/19490976.2023.2286675
Additional information
Funding
References
- Ott SJ, et al. Reduction in diversity of the colonic mucosa associated bacterial microflora in patients with active inflammatory bowel disease. Gut. 2004;53(5):685–18. doi:10.1136/gut.2003.025403.
- Gevers D, Kugathasan S, Denson L, Vázquez-Baeza Y, Van Treuren W, Ren B, Schwager E, Knights D, Song S, Yassour M, et al. The treatment-naive microbiome in New-Onset Crohn’s disease. Cell Host & Microbe. 2014;15(3):382–392. doi:10.1016/j.chom.2014.02.005.
- Rehman A, Rausch P, Wang J, Skieceviciene J, Kiudelis G, Bhagalia K, Amarapurkar D, Kupcinskas L, Schreiber S, Rosenstiel P, et al. Geographical patterns of the standing and active human gut microbiome in health and IBD. Gut. 2016;65(2):238–248. doi:10.1136/gutjnl-2014-308341.
- Halfvarson J, Brislawn CJ, Lamendella R, Vázquez-Baeza Y, Walters WA, Bramer LM, D’Amato M, Bonfiglio F, McDonald D, Gonzalez A, et al. Dynamics of the human gut microbiome in inflammatory bowel disease. Nat microbiol. 2017;2(5):17004. doi:10.1038/nmicrobiol.2017.4.
- Schirmer M, Franzosa EA, Lloyd-Price J, McIver LJ, Schwager R, Poon TW, Ananthakrishnan AN, Andrews E, Barron G, Lake K, et al. Dynamics of metatranscription in the inflammatory bowel disease gut microbiome. Nat microbiol. 2018;3(3):337–346. doi:10.1038/s41564-017-0089-z.
- Schirmer M, Garner A, Vlamakis H, Xavier RJ. Microbial genes and pathways in inflammatory bowel disease. Nat Rev Microbiol. 2019;17(8):497–511. doi:10.1038/s41579-019-0213-6.
- Willing BP, Dicksved J, Halfvarson J, Andersson AF, Lucio M, Zheng Z, Järnerot G, Tysk C, Jansson JK, Engstrand L, et al. A pyrosequencing study in twins shows that gastrointestinal microbial profiles vary with inflammatory bowel disease phenotypes. Gastroenterology. 2010;139(6):1844–1854.e1. doi:10.1053/j.gastro.2010.08.049.
- Barreto HC, Gordo I. Intrahost evolution of the gut microbiota. Nat Rev Microbiol. 2023;21(9):590–603. doi:10.1038/s41579-023-00890-6.
- Giraud A, Matic I, Tenaillon O, Clara A, Radman M, Fons M, Taddei F. Costs and benefits of high mutation rates: adaptive evolution of bacteria in the mouse gut. Sci. 2001;291(5513):2606–2608. doi:10.1126/science.1056421.
- Paepe MD, Gaboriau-Routhiau V, Rainteau D, Rakotobe S, Taddei F, Cerf-Bensussan N. Trade-off between bile resistance and nutritional competence drives Escherichia coli diversification in the mouse gut. PLoS Genet. 2011;7(6):e1002107. doi:10.1371/journal.pgen.1002107.
- Barroso-Batista J, Sousa A, Lourenço M, Bergman M-L, Sobral D, Demengeot J, Xavier KB, Gordo I. The first steps of adaptation of Escherichia coli to the gut are dominated by soft sweeps. PLoS Genet. 2014;10(3):e1004182. doi:10.1371/journal.pgen.1004182.
- Zhao S, Lieberman TD, Poyet M, Kauffman KM, Gibbons SM, Groussin M, Xavier RJ, Alm EJ. Adaptive evolution within gut microbiomes of healthy people. Cell Host & Microbe. 2019;25(5):656–667.e8. doi:10.1016/j.chom.2019.03.007.
- Elhenawy W, Tsai CN, Coombes BK. Host-specific adaptive diversification of Crohn’s disease-associated adherent-invasive Escherichia coli. Cell Host & Microbe. 2019;25(2):301–312.e5. doi:10.1016/j.chom.2018.12.010.
- Barreto HC, Sousa A, Gordo I. The landscape of adaptive evolution of a gut commensal bacteria in aging mice. Curr Biol. 2020;30(6):1102–1109.e5. doi:10.1016/j.cub.2020.01.037.
- Daniel H. Diet and gut microbiome and the “chicken or egg” problem. Front Nutr. 2022;8:828630. doi:10.3389/fnut.2021.828630.
- Garland T, Downs CJ, Ives AR. Trade-offs (and constraints) in Organismal Biology. Physiol Biochem Zool PBZ. 2022;95(1):82–112. doi:10.1086/717897.
- Nesse RM, Ganten D, Gregory TR, Omenn GS. Evolutionary molecular medicine. J Mol Med Berl Ger. 2012;90(5):509–522. doi:10.1007/s00109-012-0889-9.
- Merker M, Tueffers L, Vallier M, Groth EE, Sonnenkalb L, Unterweger D, Baines JF, Niemann S, Schulenburg H. Evolutionary approaches to combat antibiotic resistance: opportunities and challenges for precision Medicine. Front Immunol. 2020;11. doi:10.3389/fimmu.2020.01938.
- Roemhild R, Schulenburg H. Evolutionary ecology meets the antibiotic crisis: can we control pathogen adaptation through sequential therapy? Evol Med Public Health. 2019;2019(1):37–45. doi:10.1093/emph/eoz008.
- Andersson DI, Balaban NQ, Baquero F, Courvalin P, Glaser P, Gophna U, Kishony R, Molin S, Tønjum T. Antibiotic resistance: turning evolutionary principles into clinical reality. FEMS Microbiol Rev. 2020;44(2):171–188. doi:10.1093/femsre/fuaa001.
- Melnikov SV, Stevens DL, Fu X, Kwok HS, Zhang J-T, Shen Y, Sabina J, Lee K, Lee H, Söll D, et al. Exploiting evolutionary trade-offs for posttreatment management of drug-resistant populations. Proc Natl Acad Sci U S A. 2020;117(30):17924–17931. doi:10.1073/pnas.2003132117.
- Hausser J, Szekely P, Bar N, Zimmer A, Sheftel H, Caldas C, Alon U. Tumor diversity and the trade-off between universal cancer tasks. Nat Commun. 2019;10(1):5423. doi:10.1038/s41467-019-13195-1.
- Zhang J, Cunningham JJ, Brown JS, Gatenby RA. Integrating evolutionary dynamics into treatment of metastatic castrate-resistant prostate cancer. Nat Commun. 2017;8(1):1816. doi:10.1038/s41467-017-01968-5.
- Jacqueline C, Biro PA, Beckmann C, Moller AP, Renaud F, Sorci G, Tasiemski A, Ujvari B, Thomas F. Cancer: a disease at the crossroads of trade‐offs. Evol Appl. 2016;10(3):215–225. doi:10.1111/eva.12444.
- Cunningham JJ, Gatenby RA, Brown JS. Evolutionary dynamics in cancer therapy. Mol Pharm. 2011;8(6):2094–2100. doi:10.1021/mp2002279.
- Kim SC, Tonkonogy SL, Karrasch T, Jobin C, Sartor RB. Dual-association of gnotobiotic il-10−/− mice with 2 nonpathogenic commensal bacteria induces aggressive pancolitis. Inflamm Bowel Dis. 2007;13(12):1457–1466. doi:10.1002/ibd.20246.
- Morgan XC, Tickle TL, Sokol H, Gevers D, Devaney KL, Ward DV, Reyes JA, Shah SA, LeLeiko N, Snapper SB, et al. Dysfunction of the intestinal microbiome in inflammatory bowel disease and treatment. Genome Biol. 2012;13(9):R79. doi:10.1186/gb-2012-13-9-r79.
- Davenport M, Poles J, Leung JM, Wolff MJ, Abidi WM, Ullman T, Mayer L, Cho I, Loke P. Metabolic alterations to the mucosal microbiota in inflammatory bowel disease. Inflamm Bowel Dis. 2014;20(4):723–731. doi:10.1097/MIB.0000000000000011.
- Brooun A, Tomashek JJ, Lewis K. Purification and Ligand binding of EmrR, a regulator of a multidrug transporter. J Bacteriol. 1999;181(16):5131–5133. doi:10.1128/JB.181.16.5131-5133.1999.
- Coll JL, Heyde M, Portalier R. Expression of the nmpC gene of Escherichia coli K‐12 is modulated by external pH. Identification of cis ‐acting regulatory sequences involved in this regulation. Mol Microbiol. 1994;12(1):83–93. doi:10.1111/j.1365-2958.1994.tb00997.x.
- Hirakawa H, Takumi-Kobayashi A, Theisen U, Hirata T, Nishino K, Yamaguchi A. AcrS/EnvR Represses Expression of the acrAB Multidrug Efflux Genes in Escherichia coli. J Bacteriol. 2008;190(18):6276–6279. doi:10.1128/JB.00190-08.
- Heinken A, Hertel J, Acharya G, Ravcheev DA, Nyga M, Okpala OE, Hogan M, Magnúsdóttir S, Martinelli F, Nap B, et al. Genome-scale metabolic reconstruction of 7,302 human microorganisms for personalized medicine. Nat Biotechnol. 2023;41(9):1320–1331. doi:10.1038/s41587-022-01628-0.
- Huang Y-L, Chassard C, Hausmann M, von Itzstein M, Hennet T. Sialic acid catabolism drives intestinal inflammation and microbial dysbiosis in mice. Nat Commun. 2015;6(1):8141. doi:10.1038/ncomms9141.
- Hofmann C, Dunger N, Schölmerich J, Falk W, Obermeier F. Glycogen synthase kinase 3-β: a master regulator of toll-like receptor-mediated chronic intestinal inflammation. Inflamm Bowel Dis. 2010;16(11):1850–1858. doi:10.1002/ibd.21294.
- Fernandes P. Fusidic acid: a bacterial elongation factor inhibitor for the oral treatment of acute and chronic staphylococcal infections. Cold Spring Harb Perspect Med. 2016;6(1):a025437. doi:10.1101/cshperspect.a025437.
- Langholz E, Brynskov J, Bendtzen K, Vilien M, Binder V. Treatment of Crohn’s disease with fusidic acid: an antibiotic with immunosuppressive properties similar to cyclosporin. Aliment Pharmacol Ther. 2007;6(4):495–502. doi:10.1111/j.1365-2036.1992.tb00563.x.
- Kilic FS, Erol K, Batu Ö, Yildirim E, Usluer G. The effects of fusidic acid on the inflammatory response in rats. Pharmacol Res. 2002;45(4):265–267. doi:10.1006/phrs.2001.0946.
- Dapa T, Ramiro RS, Pedro MF, Gordo I, Xavier KB. Diet leaves a genetic signature in a keystone member of the gut microbiota. Cell Host & Microbe. 2022;30(2):183–199.e10. doi:10.1016/j.chom.2022.01.002.
- Tawk C, Lim B, Bencivenga-Barry NA, Lees HJ, Ramos RJF, Cross J, Goodman AL. Infection leaves a genetic and functional mark on the gut population of a commensal bacterium. Cell Host & Microbe. 2023;31(5):811–826.e6. doi:10.1016/j.chom.2023.04.005.
- Sakamoto A, Terui Y, Yoshida T, Yamamoto T, Suzuki H, Yamamoto K, Ishihama A, Igarashi K, Kashiwagi K. Three members of polyamine modulon under oxidative stress conditions: two transcription factors (SoxR and EmrR) and a Glutathione Synthetic Enzyme (GshA). PLoS ONE. 2015;10(4):e0124883. doi:10.1371/journal.pone.0124883.
- Tian T, Wang Z, Zhang J. Pathomechanisms of oxidative stress in inflammatory bowel disease and potential antioxidant therapies. Oxid Med Cell Longev. 2017;2017:4535194. doi:10.1155/2017/4535194.
- Carmel-Harel O, Storz G. Roles of the glutathione- and thioredoxin-dependent reduction Systems in the Escherichia Coli and Saccharomyces Cerevisiae responses to oxidative stress. Annu Rev Microbiol. 2000;54(1):439–461. doi:10.1146/annurev.micro.54.1.439.
- Łyżeń R, Gawron G, Kadziński L, Banecki B. GSH protects the Escherichia coli cells from high concentrations of thymoquinone. Molecules. 2022;27(8):2546. doi:10.3390/molecules27082546.
- Pasternak BA, Dʼmello S, Jurickova II, Han X, Willson T, Flick L, Petiniot L, Uozumi N, Divanovic S, Traurnicht A, et al. Lipopolysaccharide exposure is linked to activation of the acute phase response and growth failure in pediatric Crohnʼs disease and murine colitis. Inflamm Bowel Dis. 2010;16(5):856–869. doi:10.1002/ibd.21132.
- Jagt JZ, Struys EA, Ayada I, Bakkali A, Jansen EEW, Claesen J, van Limbergen JE, Benninga MA, de Boer NKH, de Meij TGJ, et al. Fecal amino acid analysis in newly diagnosed pediatric inflammatory bowel disease: a multicenter case-control study. Inflamm Bowel Dis. 2022;28(5):755–763. doi:10.1093/ibd/izab256.
- Stacy A, Andrade-Oliveira V, McCulloch JA, Hild B, Oh JH, Perez-Chaparro PJ, Sim CK, Lim AI, Link VM, Enamorado M, et al. Infection trains the host for microbiota-enhanced resistance to pathogens. Cell. 2021;184(3):615–627.e17. doi:10.1016/j.cell.2020.12.011.
- Son M, Ko JI, Kim WB, Kang HK, Kim BK. Taurine can ameliorate inflammatory bowel disease in rats. Adv Exp Med Biol. 1998;442:291–298.
- Buret AG, Allain T, Motta J-P, Wallace JL. Effects of hydrogen sulfide on the microbiome: from toxicity to therapy. Antioxid Redox Signal. 2022;36(4–6):211–219. doi:10.1089/ars.2021.0004.
- Maeda T, Wakasawa T, Shima Y, Tsuboi I, Aizawa S, Tamai I. Role of polyamines derived from arginine in differentiation and proliferation of human blood cells. Biol Pharm Bull. 2006;29(2):234–239. doi:10.1248/bpb.29.234.
- Revilla-Nuin B, Reglero Á, Martı́nez-Blanco H, Bravo IG, Ferrero MA, Rodrı́guez-Aparicio LB. Transport of N-acetyl-D-mannosamine and N-acetyl-D-glucosamine in Escherichia coli K1: effect on capsular polysialic acid production. FEBS Lett. 2002;511(1–3):97–101. doi:10.1016/S0014-5793(01)03318-X.
- Freland L, Beaulieu J-M. Inhibition of GSK3 by lithium, from single molecules to signaling networks. Front Mol Neurosci. 2012;5:14. doi:10.3389/fnmol.2012.00014.
- Inaba K, Kuroda T, Shimamoto T, Kayahara T, Tsuda M, Tsuchiya T. Lithium toxicity and Na+(Li+)/H+ antiporter in Escherichia coli. Biol Pharm Bull. 1994;17(3):395–398. doi:10.1248/bpb.17.395.
- Chen CC, Tsuchiya T, Yamane Y, Wood JM, Wilson TH. Na+ (li+)-proline cotransport in Escherichia coli. J Membr Biol. 1985;84(2):157–164. doi:10.1007/BF01872213.
- Gatenby RA, Brown JS. Integrating evolutionary dynamics into cancer therapy. Nat Rev Clin Oncol. 2020;17(11):675–686. doi:10.1038/s41571-020-0411-1.
- Ezraty B, Barras F, Mignot T. The ‘liaisons dangereuses’ between iron and antibiotics. FEMS Microbiol Rev. 2016;40(3):418–435. doi:10.1093/femsre/fuw004.
- Cai Z, Wang S, Li J. Treatment of inflammatory bowel disease: a comprehensive review. Front Med. 2021;8:765474. doi:10.3389/fmed.2021.765474.
- Öhman L, Lasson A, Strömbeck A, Isaksson S, Hesselmar M, Simrén M, Strid H, Magnusson MK. Fecal microbiota dynamics during disease activity and remission in newly diagnosed and established ulcerative colitis. Sci Rep. 2021;11(1):8641. doi:10.1038/s41598-021-87973-7.
- Kim SC, Tonkonogy SL, Albright CA, Tsang J, Balish EJ, Braun J, Huycke MM, Sartor RB. Variable phenotypes of enterocolitis in interleukin 10-deficient mice monoassociated with two different commensal bacteria. Gastroenterology. 2005;128(4):891–906. doi:10.1053/j.gastro.2005.02.009.
- Moolenbeek C, Ruitenberg EJ. The ‘Swiss roll’: a simple technique for histological studies of the rodent intestine. Lab Anim. 1981;15(1):57–60. doi:10.1258/002367781780958577.
- Adolph TE, Tomczak MF, Niederreiter L, Ko H-J, Böck J, Martinez-Naves E, Glickman JN, Tschurtschenthaler M, Hartwig J, Hosomi S, et al. Paneth cells as a site of origin for intestinal inflammation. Nature. 2013;503(7475):272–276. doi:10.1038/nature12599.
- Martin M. Cutadapt removes adapter sequences from high-throughput sequencing reads. EMBnet J. 2011;17(1):10. doi:10.14806/ej.17.1.200.
- KneadData – The Huttenhower Lab. https://huttenhower.sph.harvard.edu/kneaddata/.
- Bolger AM, Lohse M, Usadel B. Trimmomatic: a flexible trimmer for Illumina sequence data. Bioinformatics. 2014;30(15):2114–2120. doi:10.1093/bioinformatics/btu170.
- Deatherage DE, Barrick JE. Identification of mutations in laboratory-evolved microbes from next-generation sequencing data using breseq. In: Sun L, and Shou W, editors. Engineering and analyzing multicellular systems. Vol. 1151. Springer New York: Humana Press; 2014. pp. 165–188.
- Love MI, Huber W, Anders S. Moderated estimation of fold change and dispersion for RNA-seq data with DESeq2. Genome Biol. 2014;15(12):550. doi:10.1186/s13059-014-0550-8.
- Kitamoto S, Alteri CJ, Rodrigues M, Nagao-Kitamoto H, Sugihara K, Himpsl SD, Bazzi M, Miyoshi M, Nishioka T, Hayashi A, et al. Dietary L-serine confers a competitive fitness advantage to Enterobacteriaceae in the inflamed gut. Nat microbiol. 2020;5(1):116–125. doi:10.1038/s41564-019-0591-6.
- Haslauer KE, Schmitt-Kopplin P, Heinzmann SS. Data processing Optimization in untargeted metabolomics of urine using voigt lineshape model non-linear regression analysis. Metabolites. 2021;11(5):285. doi:10.3390/metabo11050285.
- Dieterle F, Ross A, Schlotterbeck G, Senn H. Probabilistic quotient normalization as robust method to account for dilution of complex biological mixtures. Application in 1H NMR metabonomics. Anal Chem. 2006;78(13):4281–4290. doi:10.1021/ac051632c.
- Heinzmann SS, Waldenberger M, Peters A, Schmitt-Kopplin P. Cluster analysis Statistical spectroscopy for the Identification of metabolites in 1H NMR metabolomics. Metabolites. 2022;12(10):992. doi:10.3390/metabo12100992.
- Csárdi G, Nepusz T. The igraph software package for complex network research. 2006.
- R: A Language and Environment for Statistical Computing | BibSonomy. https://www.bibsonomy.org/bibtex/7469ffee3b07f9167cf47e7555041ee7.
- Faust K, Croes D, van Helden J. Metabolic pathfinding using RPAIR annotation. J Mol Biol. 2009;388(2):390–414. doi:10.1016/j.jmb.2009.03.006.
- Ebrahim A, Lerman JA, Palsson BO, Hyduke DR. Cobrapy: COnstraints-based reconstruction and analysis for python. BMC Syst Biol. 2013;7(1):74. doi:10.1186/1752-0509-7-74.
- Anderson MJ. A new method for non-parametric multivariate analysis of variance. null. 2001;26(1):32–46. doi:10.1046/j.1442-9993.2001.01070.x.
- Bray JR, Curtis JT. An ordination of the upland forest communities of Southern Wisconsin. Ecol Monogr. 1957;27(4):325–349. doi:10.2307/1942268.
- Rohart F, Gautier B, Singh A, Cao K-AL, Schneidman D. mixOmics: an R package for ‘omics feature selection and multiple data integration. PLoS Comput Biol. 2017;13(11):e1005752. doi:https://doi.org/10.1371/journal.pcbi.1005752.
- Signorell A . DescTools: Tools for Descriptive Statistics. 2023.