
ABSTRACT
Gut microbiota has been implicated in various clinical conditions, yet the substantial heterogeneity in gut microbiota research results necessitates a more sophisticated approach than merely identifying statistically different microbial taxa between healthy and unhealthy individuals. Our study seeks to not only select microbial taxa but also explore their synergy with phenotypic host variables to develop novel predictive models for specific clinical conditions. Design: We assessed 50 healthy and 152 unhealthy individuals for phenotypic variables (PV) and gut microbiota (GM) composition by 16S rRNA gene sequencing. The entire modeling process was conducted in the R environment using the Random Forest algorithm. Model performance was assessed through ROC curve construction. Results: We evaluated 52 bacterial taxa and pre-selected PV (p < 0.05) for their contribution to the final models. Across all diseases, the models achieved their best performance when GM and PV data were integrated. Notably, the integrated predictive models demonstrated exceptional performance for rheumatoid arthritis (AUC = 88.03%), type 2 diabetes (AUC = 96.96%), systemic lupus erythematosus (AUC = 98.4%), and type 1 diabetes (AUC = 86.19%). Conclusion: Our findings underscore that the selection of bacterial taxa based solely on differences in relative abundance between groups is insufficient to serve as clinical markers. Machine learning techniques are essential for mitigating the considerable variability observed within gut microbiota. In our study, the use of microbial taxa alone exhibited limited predictive power for health outcomes, while the integration of phenotypic variables into predictive models substantially enhanced their predictive capabilities.
Significance of this study
What is Already Known on this Subject?
While the gut microbiota has been implicated as potential signatures or biomarkers for various clinical conditions, the establishment of causality in humans remains largely elusive.
The role of the gut microbiota in maintaining the host organism’s proper physiological function is well-established, yet data regarding the composition of the gut microbiota in disease states often suffer from poor reproducibility.
What Are the New Findings?
Our study demonstrates that relying solely on differences in the relative abundance of bacterial taxa between groups falls short as a means of identifying clinical markers.
We advocate the use of robust statistical tools, such as bootstrapping, to mitigate the substantial variability observed in gut microbiota studies, thereby enhancing the reproducibility of research findings.
Our findings underscore the limited predictive power of microbial taxa in isolation for health outcomes.
The integration of phenotypic variables into predictive models with gut microbiota significantly augments the ability to predict health outcomes.
How This Study Might Advance Research
Despite the growing enthusiasm for using gut microbiota as biomarkers for various clinical conditions, the lack of standardization throughout the research process impedes progress in this field.
Our study emphasizes the necessity of rigorously testing predictions of clinical conditions based on gut microbiota using bootstrapping techniques, promoting greater reproducibility in research findings.
Introduction
The human microbiome represents a vast and intricate consortium of microorganisms that colonize the human body. Comprising archaea, bacteria, fungi, and viruses, these diverse inhabitants reside in various anatomical niches. Of particular focus in contemporary research, the gut microbiota (GM) has garnered significant attention for its extensive study.Citation1
The qualitative and quantitative composition of the gut microbiota (GM) has frequently been proposed as a promising indicator of both health and disease states.Citation2 However, the intricate web of intra- and inter-individual diversities within the human gut microbiota complicates the direct utilization of intestinal bacteria as exclusive markers for the prediction of health and disease states.Citation3
Numerous studies have identified bacteria with varying relative abundances between control and diseased groups as potential markers for disease states such as inflammatory bowel disease,Citation4,Citation5 systemic lupus erythematosus,Citation6 type 1Citation7 and type 2 diabetes.Citation8 However, these findings often lack consensus and reproducibility among different studies, making the practical application of these bacteria as reliable markers challenging.Citation9,Citation10 Some authors have sought to create indices based exclusively on bacterial taxa for predicting health outcomes,Citation2 while others emphasize the importance of associating host information to enhance predictive capacity.Citation11
Recent studies employing robust machine learning techniques have also shed light on this issue. They suggest that the gut microbiota, in isolation, exhibits limited discriminatory power in distinguishing between individuals in good health and those facing health challenges.Citation12
In the past two decades, extensive research has delved into the multifaceted physiological functions of the gut microbiota. However, despite this growing body of work, our comprehensive understanding of how the gut microbiota contributes to predicting multifactorial diseases remains a persistent challenge. It is important to emphasize that an effective biomarker should translate biological observations into clinically relevant outcomes. Good biomarkers are characterized by low variability and reliable responsiveness to changes in the assessed condition..Citation13 While the identification of microbial taxa with differing relative abundances is a starting point, it may not necessarily represent a biomarkerCitation14. These taxa can be considered as candidates and require rigorous evaluation through robust predictive models that account for specificity and sensitivity.Citation9
The primary aim of this study is to develop predictive models that integrate phenotypic variables with gut microbiota taxa to accurately distinguish between individuals in good health and those facing health challenges. Subsequently, we will rigorously evaluate the performance of these integrated predictive models.
Methods
Study design and participants
We conducted a single-center cross-sectional case-control study, enrolling a total of 202 participants. This study was a subset of a larger research initiative, VALIDYS (CAAE: 01713018.0.0000.0068 - CAPPesq 3,008,966), which recruited participants between December 2018 and February 2020. Prior to their participation, all individuals provided written informed consent in accordance with the Declaration of Helsinki guidelines.
Inclusion and exclusion criteria
The recruitment of study participants occurred for convenience and followed specific inclusion and exclusion criteria, ensuring that the selected individuals met the predefined parameters.
Inclusion criteria of control group (CG)
Self-reported healthy and asymptomatic adults.
No continuous use of medication (except oral contraceptives for women).
Age: 18 to 80 years.
BMI (Body Mass Index): 18.5 to 24.99 kg/m2.
No complaints of any infection or disease.
Inclusion criteria for disease group
Age: 18 to 80 years.
Confirmed diagnosis of one of the following conditions, being in follow-up care at the respective units of the Hospital das Clinicas of the University of São Paulo (HCFMUSP): Type 2 Diabetes (T2D), Type 1 Diabetes (T1D), Plaque Psoriasis (PP), Systemic Lupus Erythematosus (SLE) in clinical remission, Rheumatoid Arthritis (RA), Inflammatory Bowel Diseases (IBD) – Crohn’s Disease (CD) or Ulcerative Colitis (UC) in clinical remission, being in follow-up care at the Division of Gastroenterology and Hepatology and the Division of Coloproctology of HCFMUSP.
Exclusion criteria for both groups
Pregnant individuals.
Subjects with pacemakers and stents.
Subjects currently undergoing therapeutic treatment with antineoplastics and antibiotics.
Use of antibiotics within the last 3 months.
Presence of chronic diseases, including HIV, Chronic Kidney Disease (CKD), Cirrhosis, Acromegaly, and hyperthyroidism.
A history of cancer and anticancer treatment within the last 10 years.
Data anonymization
To safeguard the privacy and personal data of the participants and adhere to data protection laws, all participant data were declassified and anonymized.
Data collection
Phenotypic and clinical data collection
Clinical anamnesis was conducted by our research team to obtain a comprehensive dataset from the patients. The information collected encompassed the following aspects:
Demographic Information: Date of birth, ethnicity, sex, marital status, education, profession/occupation.
Medical History: History of current and previous illnesses.
Lifestyle Factors: Smoking, alcohol consumption.
Allergies and Food Intolerance: Presence of allergies or food intolerances.
Physical Activity: Information on physical activity levels.
Dietary Habits: Usual food consumption, including fruits, vegetables, greens, processed foods, and consumption of sugars/sweeteners.
Bowel Habits: Assessment of bowel habits, including the frequency of bowel movements and adherence to the Bristol stool scale.
Nutritional Supplements and Medications: Details on the use of nutritional supplements and medications, including type, frequency, and dosage.
Nutrient habitual consumption assessment:
Food intake data were meticulously collected using a 24-hour dietary recall (24 HR), administered on three separate occasions before and after stool sample collections. The food items reported in each of the 24 HR were initially recorded in cooking units, such as tablespoons. Subsequently, our research team standardized and converted these units to grams or milliliters for consistency.
The energy intake, macronutrients, and total dietary fiber were quantified using the Easydiet software, which incorporates the Brazilian Table of Food Composition (TACO)(Brazilian food composition table (TACO) n.d.)and the Table of Food Composition: Support to Nutritional Decision (Table for evaluating food consumption in culinary measurements 2004). To estimate the usual energy and nutrient intakes, the Multiple Source Method (MSM) was employed. This method was applied through the online platform available at https://msm.dife.de/.
Fecal sample collection
To ensure uniformity in the collection process, all participants were provided with a standardized kit for fecal sample collection. Detailed instructions were given for the proper procedure:
Participants used a sterile swab to transfer a small fecal sample into 2 ml plastic microtubes pre-filled with a DNA preservation buffer solution.
Participants were advised to collect the stool sample no more than 24 hours before delivering it to the research team.
The collected fecal samples were to be stored at a controlled temperature (refrigeration) until the moment of delivery to the research team.
Fecal sample processing and DNA extraction
DNA extraction from fecal samples was conducted utilizing the QIAamp® PowerFecal® DNA Kit by QUIAGEN® in accordance with a standardized protocol (Illumina. 16S Metagenomic sequencing library preparation. n.d.).
Extraction procedure
Averaging at 0.25 grams of sample, the fecal samples were homogenized in 2 ml tubes containing metallic microspheres. This procedure facilitated cell lysis of both host and microbial cells. Complementing this, the addition of appropriate chemical reagents ensured the efficient extraction of bacterial DNA.
The DNA extraction kit employed Inhibitor Removal Technology (TRI) specifically tailored for stool samples. This technology effectively eliminated inhibitory substances commonly found in fecal material, such as polysaccharides, heme, and bile salts, which can interfere with subsequent polymerase chain reaction (PCR) processes.
Following successful DNA extraction, the total genomic DNA was captured on a silica membrane within a column format. Subsequent washing and elution processes were carried out, resulting in the isolation of DNA with high purity, ready for genetic sequencing of the microbiota.
Library preparation and 16S rRNA sequencing
The library preparation involved the application of unique identifiers to each DNA sample. These identifiers allowed for the simultaneous processing of all samples, streamlining the sequencing process. In this step, specific primer sequences were added, following the Illumina® protocol, which included variable regions V3 and V4. The primer sequences used were as follows:
16S amplicon PCR forward primer
5’TCGTCGGCAGCGTCAGATGTGTATAAGAGACAGCCTACGGGNGGCWGCAG 3’
16S amplicon PCR reverse primer
5’GTCTCGTGGGCTCGGAGATGTGTATAAGAGACAGGACTACHVGGGTATCTAATCC 3’
The protocol also incorporated overhang adapter sequences, which were appended to the primer pair sequences to ensure compatibility with the Illumina index and sequencing adapters.
Sequencing preparation
Subsequently, the prepared samples were pooled, and the libraries were quantified through PCR, employing Quant-iT and Qubit DNA quantitation assay kits (PICOGREEN®, Quant-iT™), as well as Kapa Hifi Hotstart (Roche®). These quantification steps ensured precise sample measurement before introducing them into the sequencer.
Gut microbiota data processing
The raw sequence reads of the 16S rRNA gene underwent thorough processing, trimming, and assembly, leading to the generation of amplicon sequence variants (ASVs). This process was accomplished using DADA2.Citation15 During the processing, the primers used in amplification were systematically removed, and sequences with more than two expected errors were eliminated, ensuring data integrity. The remaining sequences were employed to create an error identification and correction model, enhancing data accuracy. The forward and reverse readings, already corrected, were concatenated to form the ASVs. This concatenated data was used to eliminate chimeric sequences and to quantify the ASVs accurately.
Each ASV received a taxonomic classification via the TAG.ME package.Citation16 This classification was based on the SILVA database as a reference, utilizing the specific model tailored for the amplicon corresponding to the 341F-805 R region.
Gut microbiota analysis
The Beta diversity was evaluated by calculating the Bray-Curtis dissimilarity. The results were visualized in a Principal Coordinate Analysis (PCoA). Additionally, PCoA was constructed using Jensen-Shannon divergence and Weighted UniFrac distance. These techniques provided insights into the dissimilarity between microbiota samples. A Permanova test was employed to identify distinctive microbial patterns associated with each disease under study.
To identify differentially abundant bacterial taxa within each clinical group (each unhealthy group compared to the healthy group), the Wald test from the DESeq2 package (Version 1.30.1)Citation17 was utilized. During this analysis, candidates were selected based on adjusted p-values for multiple tests using the Benjamini-Hochberg method (p-adjusted p < 0.05).
Statistical analysis
The Continuous variables were presented as mean and standard deviation or median and interquartile range, while categorical variables were expressed as absolute and relative frequencies. The Shapiro-Wilk test was used to assess the normality of continuous variables.
For continuous variables that did not follow a normal distribution, a non-parametric Mann-Whitney U test was employed when comparing two groups.
Analyses involving three or more groups with non-normally distributed variables were performed using the Kruskal-Wallis test. Subsequently, in cases where the Kruskal-Wallis test indicated significance (p < 0.05), the Dunnett posthoc test was applied to compare each specific disease group with the healthy group.
The categorical variables were evaluated using the chi-square test.
A significance level of 0.05 was adopted for all tests, with two-tailed hypotheses considered.
The statistical analyses were conducted using JASP Team software (Version 0.14.1) and R version 4.0.5.
Creation of predictive models to discriminate between healthy and unhealthy individuals using isolated phenotypic or gut microbiota characteristics
Predictive models were constructed a priori for each set of data, including quantitative, qualitative, and abundance of genera of the microbiota. The entire modeling process was conducted in the R environment using the “caret” packageCitation18 with the Random Forest algorithm. The selection of the Random Forest algorithm was made following a comparative evaluation of four distinct classification algorithms, which included Generalized Linear Models (GLM), Boosted Logistic Regression (BLR), and Logistic Model Trees (LMT). To assess their overall performance, the Area Under the Curve (AUC) was used as a key metric, with predictions based on microbial abundance to determine disease state. The results of this assessment are presented in Supplementary Table S1. The Random Forest algorithm utilized in this study consisted of 100 trees with cross-validation repeated 20 times.
The evaluation of the predictive performance of the models for each disease involved four stages: 1) Utilizing bacterial taxa data exclusively to determine the isolated ability of microbial information to detect one of the diseases under investigation; 2) Assessing the capacity of qualitative phenotypic characteristics to detect one of the diseases; 3) Examining the quantitative phenotypic characteristics’ ability to detect one of the assessed diseases; and 4) Integrating steps 1, 2, and 3 to detect one of the diseases evaluated in this study.
The dataset was randomly divided, with half of the healthy and unhealthy patients used for model building, and the remaining patients employed to test the model and evaluate its performance.
Model performance was evaluated by measuring predictive ability, specifically Sensitivity and Specificity, using the test dataset. Additional performance metrics such as Recall, and Precision were also calculated.
The importance of each variable was assessed using the “Mean Decrease Gini” indexCitation19, representing the percentage of predictions that the model fails to hit when removing that variable. Additionally, to ensure the robustness and reproducibility of these measurements, SHAP (SHapley Additive exPlanations) values were calculated for each variable. These SHAP values provide valuable insights into the influence of each variable on the model’s predictions. Furthermore, the Pearson correlation between the SHAP values and the “Mean Decrease Gini” index was calculated. This correlation analysis served as an additional validation step, confirming the consistency of variable importance measurements across different approaches.
The entire procedure described above was repeated 50 times, each time involving a random selection of 50 different datasets for training and test data. During each iteration, data on the importance of the variables were recorded, and the top 10 most important variables were identified. The performance of each model was used to construct the Receiver Operating Characteristic (ROC) curve.
Creation of an integrative predictive model
The integrative predictive model aimed to effectively discriminate between healthy and unhealthy individuals by considering both phenotypic characteristics and gut microbiota. To construct this model, variables that appeared among the top 10 most important in at least half − 25 times – of the models for at least one of the diseases were selected. These variables were consistently present in each dataset, encompassing quantitative, qualitative, and microbiota data. The final integrative model was generated through a consensus approach, combining information from 50 bootstrap resamplings. This approach ensured robustness and reliability. The importance of each variable was meticulously stored, and the model’s performance was assessed by constructing a Receiver Operating Characteristic (ROC) curve. The Area Under the Curve (AUC) was calculated as a measure of the model’s separability capacity. A higher AUC value indicates better discrimination between patients with the disease and healthy controls. The use of Random Forest (RF) modeling provided AUC-ROC values that spanned from random discrimination (AUC = 0.5 or 50%) to perfect discrimination (AUC = 1.0 or 100%).
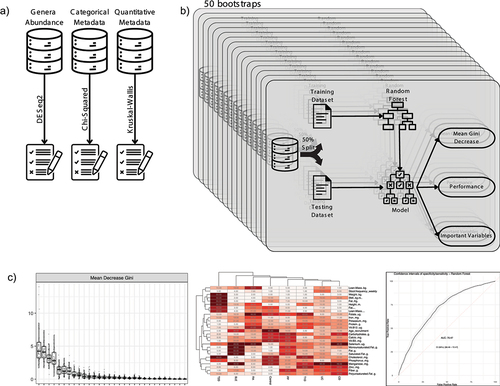
provides an overview of the workflow, starting from the initial data selection and progressing through multiple bootstraps. The final stage involves the selection of variables for the integrative model.
Figure 1. Workflow overview and variable selection process: A) initial datasets and the process of selecting candidate variables using statistical tests: DESeq2, chi-squared and Kruskal-Wallis. B) the bootstrap process repeat 50 times the creation of a random forest model used to variable selection and performance evaluation. C) visualization of three key performance metrics: mean Gini Decrease used to identify the most important variables, variable importance frequency heatmap, and a receiver operating characteristic (ROC) curve representing final model performance.
Results
Characteristics of sample
The study population consisted of a total of 202 individuals, comprising 50 healthy controls and 152 individuals with various diseases. Each specific disease group represented approximately 15% of the total diseased sample, with the exception of the Inflammatory Bowel Diseases (IBD) group, which included two subtypes, contributing to 30% of the diseased sample. In terms of age, the control group (CT) had a median age of 32 years, which exhibited significant differences when compared to other disease groups, including Plaque Psoriasis (PP) with a median age of 55 years, Rheumatoid Arthritis (RA) with a median age of 59.5 years, and Type 2 Diabetes (T2D) with a median age of 52.5 years. Gender distribution revealed a higher prevalence of females in all disease categories, while the control group displayed a balanced distribution of individuals of both sexes. A more detailed breakdown of phenotypic characteristics can be found in .
Table 1. Phenotypic characteristics of the study participants.
Phenotypic characteristics and nutritional habits are detailed in Supplementary Tables S2 and S3, respectively. Food intake was categorized into healthy food consumption, less healthy food consumption, and alcohol consumption. All statistically significant differences were preselected for model construction.
Additionally, the habitual nutrient intake values were calculated based on the results obtained using the MSM residues method, which involved three 24-hour dietary recall (24 HR) for each individual within each evaluated group. The averages for each group can be found in Supplementary Table S4. Notably, when comparing with the control group, certain nutrients, including carbohydrates, polyunsaturated fat, fiber, sodium, zinc, vitamin A, and vitamin D, showed no significant differences in their habitual intake.
Values are presented as median (minimum-maximum). Differences between both groups were analyzed using the Mann-Whitney U test* or chi-squared test#. Values are significant when P < 0.05. Abbreviations: CT: control group; IBD: inflammatory bowel disease; PP plaque psoriasis; RA rheumatoid arthritis; SLE: Systemic lupus erythematosus; T1D: type 1 diabetes; T2D: type 2 diabetes; BMI: Body mass index.
Microbial community structure and clinical status
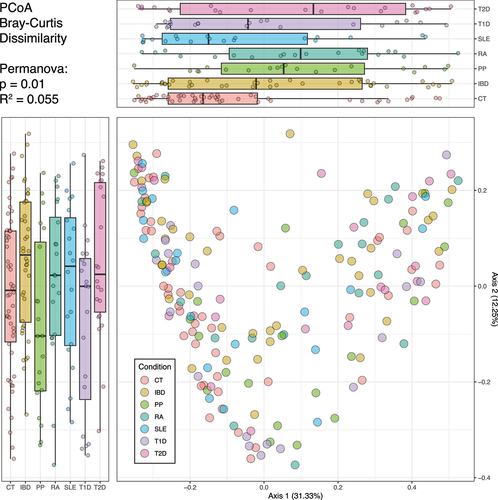
The analysis of the gut microbiota’s macrostructure among different groups involved the comparison of β diversity metrics (). Using principal coordinates analysis (PCoA) based on Bray-Curtis dissimilarity, we found that Axis 1 represented 31.33% of the variance, while Axis 2 accounted for 12.55% of the variance. Notably, the figure highlights the substantial overlap of points among all health and disease conditions in both axes, suggesting that the gut microbiota’s beta diversity does not distinctly separate individuals based on their health or disease status. This visualization underscores the complex and multifactorial nature of the microbial community structure in relation to clinical conditions. Additionally, despite the Permanova test yielding a p-value of 0.01, the R2 value indicated that disease status could only explain approximately 5.5% of the inter-individual variation. The same overlapping pattern could be identified in the PCoA using two other different distance metrics – the Jensen-Shannon divergence and the Weighted UniFrac distance – and are shown in Supplementary Figure S1.
Figure 2. Beta diversity representation of gut microbiota in health and clinical conditions. the scatter plot displays the distribution of individuals, with axis 1 on the X-axis and axis 2 on the Y-axis. Each point on the scatter plot is color-coded to indicate the individual’s health or disease status. Boxplots are presented alongside the scatter plot for each health or disease condition. These boxplots depict the spread and central tendency of individuals across both axis 1 and axis 2.
Selection of candidate variables
The pre-selected variables, which included microbial taxa identified as differentially abundant between disease and healthy subjects, as well as phenotypic variables identified through statistical tests, were used as candidates for model construction. These pre-selected variables are presented in Supplementary Figure S2.
Subsequent to the pre-selection of the aforementioned phenotypic and microbial variables, a Random Forest filtering process was employed to finalize the variable selection. This procedure involved 50 repetitions, where 50 datasets were randomly generated for training and test data. The variables that consistently emerged among the 10 most important variables, as assessed by Mean Gini Decrease, were further examined for their frequency across distinct subpopulations.
To enhance the reproducibility of the results and gain deeper insights into variable importance, we also employed the SHAP (SHapley Additive exPlanations) analysis. Mean SHAP values were calculated for each variable and subsequently correlated with the Mean Gini Decrease values across the 50 bootstrap rounds. The high correlation index (Rho) observed when correlating the same variables indicated that the variable maintained its order of importance, regardless of the measurement method used. Conversely, comparing different variables yielded Rho values approaching zero, signifying distinct importance rankings. The values of Mean Gini Decrease, Mean Absolute SHAP values, and the distribution of correlation values can be found in Supplementary Figure S3. This comprehensive approach further strengthened the reproducibility of our results while providing valuable insights into variable significance.
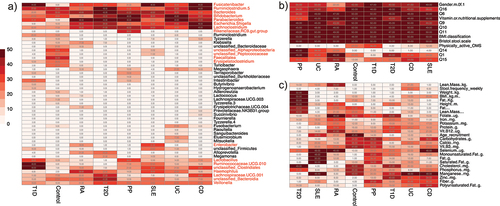
Several genera, including Fusicatenibacter, Ruminoclostridium 5, Bacteroides, Bifidobacterium, Parabacteroides, Escherichia-Shigella, and Lachnoclostridium, were frequently observed among the selected variables, indicating their potential as markers for various disease states. Within the quantitative variables, we observed a sporadic distribution of frequencies, with notable signatures linked to variables such as adipose composition and BMI-related metrics (weight and height) associated with Type 2 Diabetes. In contrast, most of the qualitative variables exhibited higher frequencies, primarily due to the limited number of variables tested. The findings are visually presented in , which features a heatmap illustrating the frequency of each tested variable among the 10 most important variables in each of the 50 bootstraps. Variables that recurred in at least half of the simulations, a total of 25 times, were selected for the construction of the final predictive model.
Figure 3. Heatmaps of variables frequency among important markers. A) frequency of the bacterial taxa among the selected variables. Taxa denoted in red met the inclusion criteria for the final model by appearing in at least 25 bootstraps for at least one health or disease state. B) frequency of qualitative phenotypic variables. All variables within this category were chosen for the final model. C) frequency of quantitative phenotypic variable. All variables in this category were selected as they met the selection criteria for at least one disease state.
Ability of isolated gut microbiota to differentiate disease states and the control group
The selected taxa that met the criteria of being relevant for prediction in at least 25 subpopulations were utilized to construct a refined model. The predictive potential of the gut microbiota varied among different diseases, with some autoimmune-related conditions showing weaker performance, including Rheumatoid Arthritis (RA) with an AUC of 54.19, Ulcerative Colitis (UC) with an AUC of 52.34, and Systemic Lupus Erythematosus (SLE) with an AUC of 49.08. In contrast, Crohn’s Disease and Plaque Psoriasis exhibited slightly better predictive performance, achieving AUC values of 69.54 and 65.95, respectively. Notably, the gut microbial composition demonstrated greater accuracy in predicting diabetes, with an AUC of 72.65 for Type 2 Diabetes and 78.91 for Type 1 Diabetes.
Intriguingly, the sensitivity for Ulcerative Colitis was unexpectedly low at 27%, although this was offset by a high specificity of 82%. A similar trade-off between recall and precision was observed in the case of Rheumatoid Arthritis, with a sensitivity of 86% and precision of 11%. Detailed performance metrics for all disease states are provided in Supplementary Table S5.
Enhanced model accuracy through phenotypic variable integration
The inclusion of phenotypic variables in the predictive model significantly enhanced the model’s accuracy for all diseases. Notably, we observed a substantial improvement in the Systemic Lupus Erythematosus (SLE) model, which initially achieved an AUC of 49.08 when relying solely on microbial variables. However, with the integration of phenotypic variables, the SLE model’s performance remarkably increased to 98.4. This improvement was particularly prominent in the case of nutritional variables, which played a pivotal role in the model, accounting for the six most decisive variables.
The significance of anthropometric variables was particularly evident in the Type 2 Diabetes model, where relying solely on microbial information yielded an AUC of 72.65. However, the incorporation of anthropometric variables substantially increased the AUC to 96.96, underlining their crucial role in enhancing model performance.
While the integration of phenotypic variables proved pivotal, the microbial community’s importance remained evident. In the case of the Plaque Psoriasis model, the initial AUC of 65.95 improved to 76.02 with the integration of additional variables, yet it retained three microbial taxa as the most influential variables.
The provides a comprehensive comparison of the isolated AUC and integrated AUC for each disease and details on the ten most important variables in each integrated model.
Table 2. Comparison of performance of disease predictive models using isolated and integrated gut microbiota and phenotypic variables.
In summation, our findings underscore the potential of integrating both phenotypic information and microbial characteristics as a comprehensive approach to enhance the prediction of health conditions. This holistic perspective offers valuable insights for advancing predictive modeling in the context of multifactorial diseases.
Discussion
In our study, we set out to explore the potential of gut microbiota, both in isolation and in conjunction with phenotypic information, for identifying individuals with various clinical conditions through machine learning. This approach represents a shift away from the conventional evaluation of “dysbiosis,” which typically focuses on differences in relative bacterial abundance between control and specific disease groups.Citation21–23
Our study encompassed a total of 202 individuals, with approximately 20 participants in each subgroup for every specific disease under investigation. It is worth noting that the sample size in studies involving the gut microbiota exhibits substantial variability. This variability often arises due to factors such as accessibility to clinical populations, budget constraints, and the nature of the research question. In this context, our study stands out as it operates within the context of a larger sample, allowing for an in-depth examination of multiple diseases, each with a sizable representation. These variations in the sample size afford our investigation a broader spectrum of subjects, enhancing the generalizability of our findings.
One unique aspect of our study is the considerable variability in the phenotypic profiles of our participant cohort. While many studies often employ strict filtering criteria based on factors such as age, gender, ethnicity, BMI, and dietary habits to reduce potential impacts on the gut microbiota, our work embraced this diversity. We view this diversity as an advantage, as it enabled us to select phenotypic variables that ultimately contributed to our predictive models. These differences within our dataset allowed us to identify what is most pertinent for predicting health outcomes, aligning with the perspective outlined in a review on “experimental and computational considerations to support the reproducibility of studies involving microbiomes.”Citation10
Our study unveiled an intriguing phenomenon in the context of gut microbiota macrostructure, specifically in terms of beta diversity. illustrates a considerable overlap among individuals in different disease groups, challenging the notion of clear-cut distinctions between these conditions. However, a Permanova analysis revealed that, despite the lack of significant explanatory relevance, the only factor displaying a significant association with the gut microbiota macrostructure was the health or disease status.
Advancements in genome sequencing and bioinformatics have undoubtedly expanded our understanding of the intricate host-microbiome relationships. Nevertheless, since the initial publications highlighting differences in the intestinal microbiome across various clinical conditionsCitation6,Citation24–26, the field has grappled with considerable heterogeneity in findings regarding bacterial composition in these diseases. The absence of a distinct “healthy” gut microbiota profile further complicates the overarching comprehension of these intricate relationships.Citation27
Understanding the microbial profile alone provides limited insight into the intricate landscape of autoimmune and metabolic diseases, which predominantly manifest as multifactorial conditions. In this context, it becomes increasingly imperative to complement microbial data with information about phenotypic characteristics, particularly those associated with diet, lifestyle, and body composition.Citation28 Wilkinson and colleagues emphasized the substantial potential in studying the human microbiota on a population scale in a recent review. They underscored the significant implications for public health, particularly in the realm of identifying novel biomarkers, therapeutic approaches, or molecular mechanisms. This exploration begins with observational studies involving human subjects and proceeds to more detailed characterization in experimental settings.Citation29
Machine learning, often denoted as Machine Learning (ML), plays a pivotal role in microbiome data analysis, contributing to enhanced work reproducibility, the development of predictive models with potential diagnostic applications, and serving as a foundation for clinical interventions related to microorganisms or their modulation.Citation30–33
Predictive models have emerged as valuable tools in the realm of gut microbiota research, primarily aimed at evaluating their efficacy in diagnosing conditions and predicting responses to treatments. Decision tree algorithms are commonly employed for such purposes, given their capacity to deduce the outcome variable from the provided data used for model training. These decision trees serve as a fundamental framework for implementing other machine learning techniques, including the random forest.
Random forest (RF) stands out as a prominent bootstrap aggregation algorithm that has found utility in various studies involving the gut microbiota. One example is in the classification of pediatric patients with Crohn’s disease (CD), wherein RF algorithms were employed to discern disease status and treatment response based on alpha diversity and genetic risk scores.Citation34 Surprisingly, 16S rRNA datasets outperformed shotgun metagenomics, demonstrating the robust classification capabilities of RF in microbiome research.Citation35,Citation36
An insightful study conducted by Ananthakrishnan and colleaguesCitation37 offers valuable parallels to our own investigation. They explored the potential of gut microbiome characteristics in predicting the response to biologic therapy with vedolizumab among patients afflicted with Crohn’s disease and ulcerative colitis. The methodology adopted in their research shares similarities with our approach. Initially, they developed a model using clinical data in isolation, which yielded modest performance in predicting expected outcomes, with an AUC of 62% (representing a regular capacity).
In contrast, when microbial taxa were integrated into their model, a notable improvement was observed, resulting in an AUC of 72%, indicative of good predictive capability. However, the most impressive performance was achieved when the model was holistically integrated, combining clinical data with the gut microbiota’s taxonomic information. This synergistic approach yielded the best performance with an AUC of 78%, demonstrating a good predictive capacity. This compelling outcome underscores the power of combining clinical and microbiome data to enhance predictive models and their clinical applications.
Despite the differing primary objectives of the study by Ananthakrishnan and colleagues,Citation37 it is noteworthy that our research shares some intriguing parallels. Notably, in both studies, the integration of clinical and gut microbiota data outperformed the utilization of these datasets in isolation. In our cohort, utilizing microbial information in isolation resulted in a regular predictive performance, with an AUC of 69.54%. However, when we integrated phenotypic and microbiota data into a single model, we achieved a markedly improved performance, with an AUC of 75.25%, mirroring the performance attained by Ananthakrishnan and his team.
On the other hand, in the case of predictive models for ulcerative colitis (UC) within our cohort, we observed performance levels close to random chance, characterized by limited performance both in isolation and through an integrated approach (AUC = 52.34% and AUC = 60.42%, respectively). This outcome suggests that, for the specific profile of individuals in our cohort previously described by Rocha et al.,Citation38 the gut microbiota may not be the most reliable marker for distinguishing healthy individuals from those with UC or the other diseases under consideration. These findings emphasize the intricate and context-dependent nature of the host-microbiome interplay in different clinical conditions, underscoring the necessity of considering the specific disease context in microbiome-related research.
Wu et al.Citation39 conducted a comprehensive study involving Chinese subjects to assess the predictive potential of gut microbiota in distinguishing between four distinct conditions: rheumatoid arthritis, type 2 diabetes, liver cirrhosis, and a healthy control group. Their analysis, which incorporated metagenomic data of the microbiota, yielded promising results with an AUC of 81% for type 2 diabetes, an impressive AUC of 94% for rheumatoid arthritis, and a strong AUC of 83% for liver cirrhosis.
In the context of lupus (systemic lupus erythematosus, or SLE), recent investigations have also explored the utility of microbial information in predicting disease status. Wei et al.Citation40 delved into this area and constructed a predictive model utilizing bacterial genera as potential biomarkers for SLE. Their model, comprising nine genera, exhibited robust discriminatory power with an AUC of 74% for distinguishing SLE patients from healthy controls. In contrast, our research, focusing on gut microbiota as an isolated variable, produced performance levels akin to random chance, with an AUC of 49.08%. Furthermore, the bacterial taxa that emerged as important variables in our model differed from those identified in the studies conducted by Wei et al. and others.
These divergent outcomes underscore the disease-specific nature of the relationship between gut microbiota and clinical conditions. Variations in population, genetic factors, and environmental influences may contribute to these differences, emphasizing the need for tailored approaches to microbiome research in distinct disease contexts.Citation28
Li et al.Citation41 conducted a study to distinguish between systemic lupus erythematosus (SLE) patients and both healthy controls and rheumatoid arthritis (RA) patients based on the genus and species composition of gut bacteria. Their predictive model, considering bacterial taxa such as Lactobacillus mucosae, Megasphaera, and Streptococcus enriched in SLE, along with reduced Faecalibacterium in healthy controls, achieved a performance with an AUC of 79%, a result quite comparable to Wei’s findings.Citation40
It’s plausible that the more modest differences observed in our study compared to LiCitation41 and WeiCitation40 could be attributed to the specific characteristics of our study population. Our cohort of SLE patients was previously described by Balmant et. alCitation42 and consisted of clinical remission individuals, all of whom had a SLEDAI score of 0, and comprised entirely of female participants. It’s noteworthy that SLE generally exhibits a milder disease severity in women compared to men, which may explain the discrepancies in the microbial profiles and their associations with disease status.
These insights highlight the importance of accounting for the heterogeneity of disease characteristics within study populations, as this variability can significantly impact the relationship between gut microbiota and clinical conditions, ultimately affecting predictive modeling outcomes.
The literature regarding the association between gut microbiota (GM) and Type 1 Diabetes (T1D) in adults is relatively limited, with only a handful of studies addressing this topic. One of the most recent investigations by Shilo et al.Citation7 delved into the predictive role of GM in T1D in adults. In their study, they found that adults with T1D exhibited a distinct microbial profile that allowed for the development of a high-capacity predictive model, with an impressive AUC of 0.89. They identified elevated levels of specific bacteria, including Prevotella copri and Eubacterium siraeum, alongside reduced Faecalibacterium prausnitzii in these individuals.
In our own study, when we considered microbial variables in isolation, the predictive model for T1D yielded a good performance (AUC = 78.91%). However, we observed a substantial improvement in predictive accuracy (AUC = 86.19%) when we incorporated information about nutrient consumption, particularly regarding folate, cholesterol, zinc, manganese, and protein. These nutrients are known to exert a significant impact on glycemic control and can also influence the systemic inflammatory profile of the individual.Citation43 The interplay between these factors underscores their importance in the management of T1D and offers a plausible explanation for the enhanced performance of our predictive model when this nutritional information was integrated into the dataset.
These findings emphasize the complex interrelationships among GM, dietary factors, and metabolic conditions, particularly in the context of T1D. They also highlight the potential utility of an integrated approach, where both microbial and nutritional data are considered in tandem to enhance the accuracy of predictive models for T1D.
Type 2 Diabetes (T2D) remains a focal point in the field of gut microbiota research, and numerous studiesCitation24,Citation44,Citation45 have strived to uncover a distinct microbial profile in individuals affected by the condition. However, these efforts have thus far failed to yield a unified microbial signature associated with T2D. In our current study, when evaluating the performance of a predictive model for T2D using solely gut microbiota data, we observed a performance with an AUC of 72.65%.
In contrast, our integrated model, which combined phenotypic characteristics with microbial markers, exhibited exceptional performance, achieving an impressive AUC of 96.96%. This substantial improvement in predictive accuracy underscores the significance of considering both phenotypic data and the gut microbiota when aiming to identify T2D. It also reinforces the idea that T2D is a multifaceted condition influenced by a wide array of factors, both microbial and phenotypic, which collectively contribute to its complex etiology.
The challenges encountered in pinpointing a consistent microbial profile for T2D across various studies highlight the intricate nature of this disease and its potential heterogeneity among affected individuals. The success of our integrated model highlights the importance of adopting a comprehensive approach that integrates diverse data sources, offering a promising path toward improving T2D prediction and enhancing our understanding of the condition’s multifactorial underpinnings.
The recent study by Gou et al.Citation46 adds to the growing body of research on Type 2 Diabetes (T2D) and its association with the gut microbiota. In their investigation, Gou and colleagues assessed the predictive accuracy of various factors, including microbiome characteristics, host genetic information, and additional phenotypic features such as cardiovascular risk scores, lifestyle factors, and dietary habits. Their findings revealed that utilizing microbiome data outperformed the other factors in predicting T2D.
Specifically, Gou et al.Citation46 observed that a predictive model based solely on phenotypic characteristics achieved an AUC of 63%. However, when microbiota data were integrated into the model, the AUC significantly improved to 73%. This outcome aligns with our own study, reinforcing the notion that incorporating microbiome information alongside lifestyle characteristics can substantially enhance the predictive capability of machine learning models.
These findings collectively emphasize the significance of adopting a holistic approach that integrates microbiome data and various aspects of an individual’s lifestyle to bolster the accuracy of T2D prediction models. The ability of the gut microbiota to contribute substantially to predictive accuracy underscores its relevance in understanding and managing the multifaceted nature of T2D and other complex metabolic conditions.
The identification of microbial biomarkers for predicting various diseases and conditions has become a significant area of interest within the scientific community. In several instances, such as the enrichment of Fusobacterium nucleatum in patients with colorectal cancer (CRC),Citation47–49 existing research findings have demonstrated remarkable convergence. This consensus exists irrespective of geographic regions, lifestyle variations, age disparities, and other potentially confounding factors. These instances of agreement across studies reinforce the reliability of certain microbial biomarkers as valuable indicators of specific health conditions.
However, it is essential to acknowledge that for other health conditions, the path to identifying robust microbial biomarkers is more complex. In these cases, despite notable advancements through the integration of omics-based techniques and computational methodologies, the reproducibility of potential microbial biomarkers often remains a challenge. The variability in findings across different studies can lead to concerns regarding the reliability and generalizability of these biomarkers for diagnostic and predictive purposes.
As the field of microbiome research continues to evolve, researchers must address these complexities and work toward enhancing the consistency and reproducibility of microbial biomarker discovery. Additionally, as highlighted in our study and corroborated by others, integrating microbial data with phenotypic characteristics, lifestyle factors, and dietary habits can significantly enhance the predictive performance of machine learning models. This holistic approach may represent a promising direction for improving the accuracy and reliability of microbial biomarkers in diverse health conditions.
The mounting evidence supporting the role of the microbiome in human health is substantial. However, the rush for expedited findings within the field of integrative microbiomics, often lacking standardized protocols for sample collection, handling, extraction, sequencing, and analytical methodologies, as well as the incorporation of essential clinical data, presents significant obstacles. These challenges impede the establishment of robust scientific conclusions and contribute to the propagation of less reproducible results.Citation10,Citation29,Citation33
As a constructive recommendation to mitigate bias in future studies within this field, our research underscores the significance of employing variable filtering, both phenotypic and microbial, through resampling techniques such as bootstrapping. This approach can help mitigate the impact of substantial variability that’s often observed in gut microbiota studies and promote the reproducibility of results obtained.Citation10
Microbial taxa, therefore, should be considered as candidates for predicting specific conditions and rigorously tested for their reproducibility and discriminatory capacity through predictive models, as exemplified in this study.
Conclusions
While certain microbial taxa (genera and species) do exhibit varying relative abundance between groups, they do not, in isolation, possess predictive marker potential. The evaluation of beta diversity fails to reveal a distinct pattern within the microbiota macrostructure that can effectively discriminate between health status and disease states.
Collectively, our findings emphasize that relying solely on microbial markers for predicting health outcomes is limited in its effectiveness. However, integrating phenotypic characteristics with gut microbiota data yields an enhanced predictive model that improves the predictability of health outcomes.
Author contributions statement
GRF, DLW and DCF conceived of the presented idea. DCF, LC, BDB, IMGR, APAP participated in data collection. GRF performed the computations and verified the analytical methods. GRF, DLW and DCF writing – original draft preparation. DCF, GRF, APAP, JTMA and RSMMT discussed the results of the manuscript. D.L.W and GRF Supervision. DLW, GRF and DCF project administration. DLW and GRF funding acquisition. All authors have read and agreed to the published version of the manuscript.
Informed consent statement
Informed consent was obtained from all subjects involved in the study.
Institutional review board statement
The study was conducted in accordance with the Declaration of Helsinki, approved by the ethics committee of Hospital das Clínicas HCFMUSP, Faculdade de Medicina, Universidade de São Paulo, São Paulo, SP, BR (this specific study was approved by the local ethics committee (CaPPesq: 4.019.807) and was part of the original protocol (CAAE: 01713018.0.0000.0068 – CAPPesq 3.008.966) VALIDYS.
Supp_Fig_4.eps
Download EPS Image (15.6 MB)Supp_Table_4.xlsx
Download MS Excel (11.3 KB)Supp_Table_5.xlsx
Download MS Excel (11.8 KB)Supp_Fig_2.eps
Download EPS Image (8.1 MB)Supp_Table_2.xlsx
Download MS Excel (11.7 KB)Supp_Table_3.xlsx
Download MS Excel (11.1 KB)Supp_Fig_1.eps
Download EPS Image (6.5 MB)Supp_Fig_3.eps
Download EPS Image (16.3 MB)Supp_Table_1.xlsx
Download MS Excel (9.8 KB)Disclosure statement
No potential conflict of interest was reported by the author(s).
Data availability statement
Nucleotide sequence data used for this study are deposited in The European Nucleotide Archive (ENA) accession number PRJEB59338.
Supplementary material
Supplemental data for this article can be accessed online at https://doi.org/10.1080/19490976.2023.2297815
Additional information
Funding
References
- Dekaboruah E, Suryavanshi MV, Chettri D, Verma AK. Human microbiome: an academic update on human body site specific surveillance and its possible role. Arch Microbiol. 2020;202(8):2147–18. doi: 10.1007/s00203-020-01931-x.
- Gupta VK, Kim M, Bakshi U, Cunningham KY, Davis JM, Lazaridis KN, Nelson H, Chia N, Sung J. A predictive index for health status using species-level gut microbiome profiling. Nat Commun. 2020;11(1). doi: 10.1038/s41467-020-18476-8.
- Bielka W, Przezak A, Pawlik A. The role of the gut microbiota in the pathogenesis of diabetes. Int J Mol Sci. 2022;23(1):480. doi: 10.3390/ijms23010480.
- Pascal V, Pozuelo M, Borruel N, Casellas F, Campos D, Santiago A, Martinez X, Varela E, Sarrabayrouse G, Machiels K, et al. A microbial signature for Crohn's disease. Gut. 2017;66(5):813–822. doi: 10.1136/gutjnl-2016-313235.
- Sankarasubramanian J, Ahmad R, Avuthu N, Singh AB, Guda C. Gut microbiota and metabolic specificity in ulcerative colitis and crohn’s disease. Front Med. 2020;7. doi:10.3389/fmed.2020.606298.
- He Z, Shao T, Li H, Xie Z, Wen C. Alterations of the gut microbiome in Chinese patients with systemic lupus erythematosus. Gut Pathog. 2016;8(1). doi: 10.1186/s13099-016-0146-9.
- Shilo S, Godneva A, Rachmiel M, Korem T, Bussi Y, Kolobkov D, Karady T, Bar N, Wolf BC, Glantz-Gashai Y, et al. The gut microbiome of adults with type 1 diabetes and its association with the host glycemic control. Diab Care. 2022;45(3):555–563. doi: 10.2337/dc21-1656.
- Doumatey AP, Adeyemo A, Zhou J, Lei L, Adebamowo SN, Adebamowo C, Rotimi CN. Gut microbiome profiles are associated with type 2 diabetes in urban Africans. Front Cell Infect Microbiol. 2020;10:10. doi:10.3389/fcimb.2020.00063.
- Metwaly A, Reitmeier S, Haller D. Microbiome risk profiles as biomarkers for inflammatory and metabolic disorders. Nature Reviews Gastroenterol Mathsemicol Hepatol. 2022;19(6):383–397. doi: 10.1038/s41575-022-00581-2.
- Poussin C, Sierro N, Boué S, Battey J, Scotti E, Belcastro V, Peitsch MC, Ivanov NV, Hoeng J. Interrogating the microbiome: experimental and computational considerations in support of study reproducibility. Drug Discov Today. 2018;23(9):1644–1657. doi: 10.1016/j.drudis.2018.06.005.
- Vila AV, Imhann F, Collij V, Jankipersadsing SA, Gurry T, Mujagic Z, Kurilshikov A, Bonder MJ, Jiang X, Tigchelaar EF, et al. Gut microbiota composition and functional changes in inflammatory bowel disease and irritable bowel syndrome. Sci Transl Med. 2018;10(472). doi: 10.1126/scitranslmed.aap8914.
- Marcos-Zambrano LJ, Karaduzovic-Hadziabdic K, Turukalo TL, Przymus P, Trajkovik V, Aasmets O, Berland M, Gruca A, Hasic J, Hron K, et al. Applications of machine learning in human microbiome studies: a review on feature selection, biomarker identification, disease prediction and treatment. Front Microbiol. 2021;12:12. doi:10.3389/fmicb.2021.634511.
- Aronson JK, Ferner RE. Biomarkers—a general review. CP Pharmacol. 2017;76(1). doi: 10.1002/cpph.19.
- Yang L, Chen J. A comprehensive evaluation of microbial differential abundance analysis methods: current status and potential solutions. Microbiome. 2022;10(1). doi: 10.1186/s40168-022-01320-0.
- Callahan BJ, McMurdie PJ, Rosen MJ, Han AW, Johnson AJA, Holmes SP. DADA2: high-resolution sample inference from Illumina amplicon data. Nat Methods. 2016;13(7):581–583. doi: 10.1038/nmeth.3869.
- Pires DEV, Oliveira FS, Correa FB, Morais DK, Fernandes GR. TAG.ME: taxonomic assignment of genetic markers for ecology bioRxiv 263293. 2018. doi:10.1101/263293.
- Love MI, Huber W, Anders S. Moderated estimation of fold change and dispersion for RNA-seq data with DESeq2. Genome Biol. 2014;15(12). doi: 10.1186/s13059-014-0550-8.
- Kuhn M. Building predictive models in R using the caret package. J Stat Soft. 2008;28(5). doi: 10.18637/jss.v028.i05.
- Han H, Guo X, Yu H. Variable selection using mean decrease accuracy and mean decrease gini based on random forest. In: 2016 7th IEEE International Conference on Software Engineering and Service Science (ICSESS); Beijing,China. IEEE; 2016.
- Hosmer DW, Lemesbow S. Goodness of fit tests for the multiple logistic regression model. Communicat Statist Theory Meth. 1980;9(10):1043–1069. doi: 10.1080/03610928008827941.
- Ghannam RB, Techtmann SM. Machine learning applications in microbial ecology human microbiome studies, and environmental monitoring. Comput Struct Biotechnol J. 2021;19:1092–1107. doi:10.1016/j.csbj.2021.01.028.
- Kohli A, Holzwanger EA, Levy AN. Emerging use of artificial intelligence in inflammatory bowel disease. World J Gastroentero. 2020;26(44):6923–6928. doi: 10.3748/wjg.v26.i44.6923.
- Olesen SW, Alm EJ. Dysbiosis is not an answer. Nat Microbiol. 2016;1(12). doi: 10.1038/nmicrobiol.2016.228.
- Ahmad A, Yang W, Chen G, Shafiq M, Javed S, Zaidi SSA, Shahid R, Liu C, Bokhari H, Jacobs J. Analysis of gut microbiota of obese individuals with type 2 diabetes and healthy individuals. PLoS ONE. 2019;14(12):e0226372. doi: 10.1371/journal.pone.0226372.
- Ley RE, Turnbaugh PJ, Klein S, Gordon JI. Human gut microbes associated with obesity. Nature. 2006;444(7122):1022–1023. doi: 10.1038/4441022a.
- Scher JU, Ubeda C, Artacho A, Attur M, Isaac S, Reddy SM, Marmon S, Neimann A, Brusca S, Patel T, et al. Decreased bacterial diversity characterizes the altered gut microbiota in patients with psoriatic arthritis, resembling dysbiosis in inflammatory bowel disease. Arthritis Rheumatol. 2014;67(1):128–139. doi: 10.1002/art.38892.
- Rinninella E, Raoul P, Cintoni M, Franceschi F, Miggiano G, Gasbarrini A, Mele M. What is the healthy gut microbiota composition? A changing ecosystem across age environment, diet, and diseases. Microorgan. 2019;7(1):14. doi: 10.3390/microorganisms7010014.
- Vujkovic-Cvijin I, Sklar J, Jiang L, Natarajan L, Knight R, Belkaid Y. Host variables confound gut microbiota studies of human disease. Nature. 2020;587(7834):448–454. doi: 10.1038/s41586-020-2881-9.
- Wilkinson JE, Franzosa EA, Everett C, Li C, Bae S, Berzansky I, Bhosle A, Bjørnevik K, Brennan CA, Cao YG, et al. A framework for microbiome science in public health. Nat Med. 2021;27(5):766–774. doi:10.1038/s41591-021-01258-0.
- Kurilshikov A, Medina-Gomez C, Bacigalupe R, Radjabzadeh D, Wang J, Demirkan A, Roy CIL, Garay JAR, Finnicum CT, Liu X, et al. Large-scale association analyses identify host factors influencing human gut microbiome composition. Nat Genet. 2021;53(2):156–165. doi: 10.1038/s41588-020-00763-1.
- Li P, Luo H, Ji B, Nielsen J. Machine learning for data integration in human gut microbiome. Microb Cell Fact. 2022;21(1). doi: 10.1186/s12934-022-01973-4.
- Salim F, Mizutani S, Zolfo M, Yamada T. Recent advances of machine learning applications in human gut microbiota study: from observational analysis toward causal inference and clinical intervention. Curr Opin Biotechnol. 2023;79:102884. doi:10.1016/j.copbio.2022.102884.
- Schloss PD, Ravel J. Identifying and overcoming threats to reproducibility, replicability, robustness, and generalizability in microbiome research. mBio. 2018;9(3). doi: 10.1128/mBio.00525-18.
- Douglas GM, Hansen R, Jones CMA, Dunn KA, Comeau AM, Bielawski JP, Tayler R, El-Omar EM, Russell RK, Hold GL, et al. Multi-omics differentially classify disease state and treatment outcome in pediatric Crohn’s disease. Microbiome. 2018;6(1). doi: 10.1186/s40168-018-0398-3.
- Dhaliwal J, Erdman L, Drysdale E, Rinawi F, Muir J, Walters TD, Siddiqui I, Griffiths AM, Church PC. Accurate classification of pediatric colonic inflammatory bowel disease subtype using a random forest machine learning classifier. J Pediatr Gastroenterol Nutr. 2021;72(2):262–269. doi: 10.1097/MPG.0000000000002956.
- Zuo W, Wang B, Bai X, Luan Y, Fan Y, Michail S, Sun F. 16S rRNA and metagenomic shotgun sequencing data revealed consistent patterns of gut microbiome signature in pediatric ulcerative colitis. Sci Rep. 2022;12(1). doi: 10.1038/s41598-022-07995-7.
- Ananthakrishnan AN, Luo C, Yajnik V, Khalili H, Garber JJ, Stevens BW, Cleland T, Xavier RJ. Gut microbiome function predicts response to anti-integrin biologic therapy in inflammatory bowel diseases. Cell Host & Microbe. 2017;21(5):603–610.e3. doi: 10.1016/j.chom.2017.04.010.
- da Rocha IMG, Torrinhas R, Fonseca D, de Oliveira Lyra C, de Sousa Alves Neri JL, Balmant BD, Callado L, Charlton K, Queiroz N, Waitzberg DL. Pro-inflammatory diet is correlated with high veillonella rogosae gut inflammation and clinical relapse of inflammatory bowel disease. Nutrients. 2023;15(19):4148. doi: 10.3390/nu15194148.
- Wu H, Cai L, Li D, Wang X, Zhao S, Zou F, Zhou K. Metagenomics biomarkers selected for prediction of three different diseases in Chinese population. Biomed Res Int. 2018;2018:1–7. doi:10.1155/2018/2936257.
- Wei F, Xu H, Yan C, Rong C, Liu B, Zhou H, Zhou XJ. Changes of intestinal flora in patients with systemic lupus erythematosus in northeast China. PLoS ONE. 2019;14(3):e0213063. doi: 10.1371/journal.pone.0213063.
- Li Y, Wang HF, Li X, Li HX, Zhang Q, Zhou HW, He Y, Li P, Fu C, Zhang XH, et al. Disordered intestinal microbes are associated with the activity of systemic lupus erythematosus. Clin Sci. 2019;133(7):821–838. doi:10.1042/CS20180841.
- Balmant BD, Fonseca DC, Prudêncio APA, Rocha IM, Callado L, Alves JTM, de Miranda Torrinhas RSM, Borba EF, Waitzberg DL. Megamonas funiformis plasma zonulin, and sodium intake affect C3 complement levels in inactive systemic lupus erythematosus. Nutri. 2023;15(8):1999. doi: 10.3390/nu15081999.
- Smart CEM, Evans M, O’Connell SM, McElduff P, Lopez PE, Jones TW, Davis EA, King BR. Both dietary protein and fat increase postprandial glucose excursions in children with type 1 diabetes and the effect is additive. Diab Care. 2013;36(12):3897–3902. doi: 10.2337/dc13-1195.
- Chávez-Carbajal A, Pizano-Zárate ML, Hernández-Quiroz F, Ortiz-Luna GF, Morales-Hernández RM, Sales-Millán AD, Hernández-Trejo M, García-Vite A, Beltrán-Lagunes L, Hoyo-Vadillo C, et al. Characterization of the gut microbiota of individuals at different T2D stages reveals a complex relationship with the host. Microorgan. 2020;8(1):94. doi: 10.3390/microorganisms8010094.
- Li Q, Chang Y, Zhang K, Chen H, Tao S, Zhang Z. Implication of the gut microbiome composition of type 2 diabetic patients from northern China. Sci Rep. 2020;10(1). doi: 10.1038/s41598-020-62224-3.
- Gou W, Ling CW, He Y, Jiang Z, Fu Y, Xu F, Miao Z, Sun TY, Lin JS, Zhu HL, et al. Interpretable machine learning framework reveals robust gut microbiome features associated with type 2 diabetes. Diab Care. 2020;44(2):358–366. doi: 10.2337/dc20-1536.
- Castellarin M, Warren RL, Freeman JD, Dreolini L, Krzywinski M, Strauss J, Barnes R, Watson P, Allen-Vercoe E, Moore RA, et al. Fusobacterium nucleatum infection is prevalent in human colorectal carcinoma. Genome Res. 2011;22(2):299–306. doi: 10.1101/gr.126516.111.
- Osman MA, Neoh HM, Mutalib NSA, Chin SF, Mazlan L, Ali RAR, Zakaria AD, Ngiu CS, Ang MY, Jamal R. Parvimonas micra, Peptostreptococcus stomatis, Fusobacterium nucleatum and Akkermansia muciniphila as a four-bacteria biomarker panel of colorectal cancer. Sci Rep. 2021;11(1). doi: 10.1038/s41598-021-82465-0.
- Shariati A, Razavi S, Ghaznavi-Rad E, Jahanbin B, Akbari A, Norzaee S, Darban-Sarokhalil D. Association between colorectal cancer and Fusobacterium nucleatum and bacteroides fragilis bacteria in Iranian patients: a preliminary study. Infect Agent Cancer. 2021;16(1). doi: 10.1186/s13027-021-00381-4.