
ABSTRACT
Human colorectal cancers (CRCs) are readily colonized by colibactin-producing E. coli (CoPEC). CoPEC induces DNA double-strand breaks, DNA mutations, genomic instability, and cellular senescence. Infected cells produce a senescence-associated secretory phenotype (SASP), which is involved in the increase in tumorigenesis observed in CRC mouse models infected with CoPEC. This study investigated whether CoPEC, and the SASP derived from CoPEC-infected cells, impacted chemotherapeutic resistance. Human intestinal epithelial cells were infected with the CoPEC clinical 11G5 strain or with its isogenic mutant, which is unable to produce colibactin. Chemotherapeutic resistance was assessed in vitro and in a xenograft mouse model. Expressions of cancer stem cell (CSC) markers in infected cells were investigated. Data were validated using a CRC mouse model and human clinical samples. Both 11G5-infected cells, and uninfected cells incubated with the SASP produced by 11G5-infected cells exhibited an increased resistance to chemotherapeutic drugs in vitro and in vivo. This finding correlated with the induction of the epithelial to mesenchymal transition (EMT), which led to the emergence of cells exhibiting CSC features. They grew on ultra-low attachment plates, formed colonies in soft agar, and overexpressed several CSC markers (e.g. CD133, OCT-3/4, and NANOG). In agreement with these results, murine and human CRC biopsies colonized with CoPEC exhibited higher expression levels of OCT-3/4 and NANOG than biopsies devoid of CoPEC. Conclusion: CoPEC might aggravate CRCs by inducing the emergence of cancer stem cells that are highly resistant to chemotherapy.
Introduction
In recent years, significant advances have been reported in the treatment of many tumor types, including colorectal cancer (CRC).Citation1 Despite substantial progress, resistance to therapy remains a major challenge and the leading cause of treatment failure, due to cancer cells’ resistance to drug treatment resulting in tumor recurrence and metastasis. Cancer stem cells (CSCs) – subpopulations of cancer cells thought to drive tumor growth – are a major cause of cancer therapy failure.Citation2,Citation3 CSCs share similar characteristics with normal stem cells, such as quiescence, self-renewal ability, and multi-lineage differentiation, which result from a balance between the quiescence, symmetric division, and asymmetric division of CSCs.Citation2,Citation3
Causing a loss of the epithelial cell phenotype and a gain of mobility,Citation4–6 epithelial to mesenchymal transition (EMT) has been initially investigated for its enhancing effect on cell migration. EMT is also thought now to be involved in carcinoma cells’ acquisition of stem-like propertiesCitation7–10 and resistance to anti-cancer drugs.Citation11–15 As a transient and reversible cellular process, EMT could allow interconversions of CSCs and non-CSCs, by decreasing (e.g., E-cadherin) and increasing the expressions of EMT factors (e.g., vimentin, N-cadherin, ZEB, SNAIL, and TWIST).Citation2,Citation16 Among the EMT factors, transcription factors (e.g., TWIST, ZEB, and SNAIL) are particularly important for EMT initiation,Citation17 stemness acquisition,Citation7,Citation9,Citation10,Citation16 and resistance to chemotherapy.Citation18
Recent experimental studies regarding colorectal tumors have revealed the impact of microbiota composition on optimal responses to cancer therapiesCitation19–22 and immunotherapy.Citation23,Citation24 The identification of key microbiota members responsible for anti-cancer drug resistance has only been sparsely investigated, with the exception of Fusobacterium nucleatum, which mediates CRC chemoresistance against small drug chemotherapeutics via the autophagy pathway.Citation25–29
Escherichia coli, a versatile subdominant member of the gut microbiota responsible for intestinal and extra-intestinal infections,Citation30,Citation31 is frequently isolated in biopsies of colorectal tumors,Citation32–35 suggesting interactions between CRC and E. coli. Importantly, at least 50% of colorectal cancer (CRC) biopsies are colonized by E. coli strains harboring the pks genomic island,Citation34,Citation36,Citation37 which is responsible for the synthesis of the toxin colibactin. Colibactin-producing E. coli (CoPEC) increases tumors in CRC mouse modelsCitation36,Citation38–40 and induces DNA interstrand crosslinks,Citation41 DNA double-strand breaks,Citation36,Citation42 genomic instability,Citation43 cell cycle arrest,Citation42 and cellular senescence.Citation38,Citation39 Senescent cells produce a senescence-associated secretory phenotype (SASP) that, in turn, produces proinflammatory and growth factors, which are involved in the growth of tumor xenografts in mice transiently infected with CoPEC. Furthermore, senescence as well as SASP stigmas have been observed in human CRC biopsies colonized by CoPEC.Citation38 In addition, a recent study showed that CoPEC induces a specific DNA mutation pattern that can be found in human CRC biopsies, demonstrating for the first time that bacteria could play a driving role in CRC pathogenesis.Citation44
In this work, we investigated the fate of human colon cancer cells after infection with CoPEC and their consequent susceptibility to anticancer chemotherapy. We found that CoPEC promoted chemoresistance in colon cancer cells by promoting stemness and EMT features.
Results
Tumors colonized by CoPEC exhibited high expression levels of NANOG and OCT-3/4
The intracellular proteins NANOG (nanog homeobox) and OCT-3/4 (octamer-binding transcription factor) are key stem cell and prognostic markers.Citation45–47 We therefore investigated the expression of these markers in colonic tumors collected from the AOM/DSS CRC mouse model and from human biopsies colonized by E. coli. The AOM/DSS-treated mice were colonized by clinical colibactin-producing E. coli (CoPEC) reference strain 11G5 or its isogenic mutant 11G5Δpks, which is unable to produce colibactin (the clbQ gene of the pks island has been deleted).Citation38 Expressions of NANOG and OCT-3/4 were greatly increased in colonic tumors collected from mice colonized by 11G5 compared to mice harboring colonic tumor colonized by 11G5Δpks (). Similar investigations were performed using human colonic mucosa and human colonic tumors, which did not significantly differ in their tumor node metastasis stage, neoplastic grade, inflammatory score, or quantity of associated E. coli. Citation39 We found that colonic mucosa isolated from patients colonized with CoPEC harbored higher mRNA levels of OCT-3/4 and NANOG compared to those colonized by E. coli devoid of pks (). Protein expression levels of OCT-3/4 were also significantly increased in tumors colonized by CoPEC (). However, the NANOG protein was undetectable by Western blot (data not shown). These results suggested that CoPEC fosters the emergence of CSCs in vivo and therefore might enhance chemoresistance.
Figure 1. In vivo overexpression of CSC markers in response to CoPEC infection. (a) Western blot analysis of NANOG and OCT-3/4 expression in tumors collected from AOM/DDS-treated mice infected with the 11G5 strain or the 11G5Δpks strain. Bar graphs on the right represent quantification of bands density using ImageJ software. Values represent means ± SEM; *p < .05. (b) OCT-3/4 and NANOG mRNA levels in the human non-tumoral colonic mucosa colonized by CoPEC (pks+) (N = 30), or by E. coli that did not carry the pks island (pks-) (N = 39), were quantified using qRT-PCR. Medians are represented on the graph; *p < .05. (c) Expression of OCT-3/4 in colonic tumors colonized by CoPEC (pks+) (N = 6), or by E. coli that did not carry the pks island (pks-) (N = 9), was analysed using Western blot. The graph represents the quantification of band intensity using the Image Lab Software from Bio-Rad; *p < .05.
CoPEC promoted resistance to anti-cancer chemotherapy in vitro and in vivo
Human colon carcinoma HT-29 cells were infected in vitro with the 11G5 strain or the isogenic mutant 11G5Δpks.Citation38 Five days post-infection, all the cells infected with 11G5, unlike the cells infected with 11G5Δpks, exhibited megalocytosis – an expected morphological change relating to the cellular senescence induced by CoPEC—, as previously published.Citation38 The senescent cells were maintained in culture, and their morphology was monitored using a transmitted light microscope twice weekly. Between 2- and 3-weeks post-infection, we recurrently observed a rebound in the growth of 11G5-infected cells, which formed 3D spheroid cellular clusters (), while 11G5Δpks-infected cells, like uninfected cells, grew as monolayers requiring frequent trypsinization. The susceptibility of infected cells to chemotherapeutic drugs was next assessed at 3 weeks post-infection. As shown in , 115G5-infected cells were more resistant to the first- (5-fluorouracil or 5-FU) and second-generation (irinotecan and oxaliplatin) chemotherapy used for CRC treatment compared to 11G5Δpks-infected cells. To validate the results obtained in vitro, the susceptibility of CoPEC-infected cells to anti-cancer chemotherapy was analyzed in a xenograft mouse model. Three weeks post-infection, cells were engrafted into nude mice, and the mice received administration of 5-FU as described in Materials and Methods. According to the results obtained in vitro, tumors derived from 11G5-infected cells were significantly more resistant to 5-FU than those from 11G5Δpks-infected cells ().
Figure 2. Human colon cancer cells made senescent by 11G5 growth at 3 weeks post-infection and are more resistant to chemotherapeutic drugs both in vitro and in a xenograft mouse model. (a-c) HT-29 cells were infected with the 11G5 strain or the 11G5Δpks strain, and 3-week post-infection cells were used. (a) Representative pictures of 11G5-infected cells at 3 weeks post-infection. (b) Cells were trypsinized, seeded on 96-well plates, and exposed to various doses of chemotherapeutic drugs for 1 week. Cellular viability was assessed by MTT assay. Untreated cells were used to represent 100% viability. Data are means ± SEM of eight replicates and are representative of three independent experiments. *p < .05; **p < .005; ***p < .001. (c) Three weeks post-infection, 10Citation6 cells were subcutaneously injected into the dorsal flaps of 5-week-old nude mice. Seven days post-engraftment, mice received 30 mg/kg of 5-FU twice weekly for 3 weeks. Tumor sizes were measured using a caliper twice weekly. N = 6 mice/group. Data are means ± SEM. NS, not significant; *p < .05; ***p < .001; ****p < .0001.
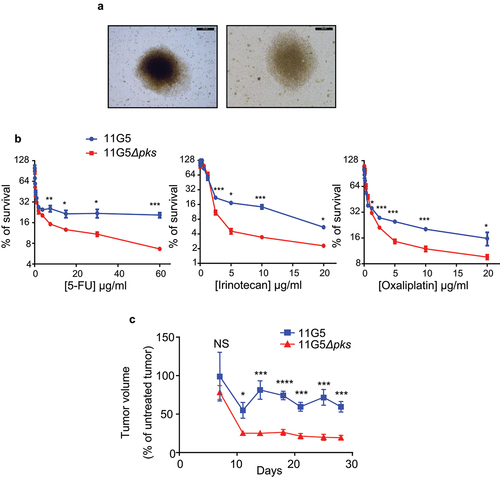
Overall, the results showed that cancer cells infected by CoPEC, despite the senescence induced by the genotoxic bacteria, form 3D spheroids and become chemoresistant.
CoPEC activated EMT and induced the emergence of CSCs
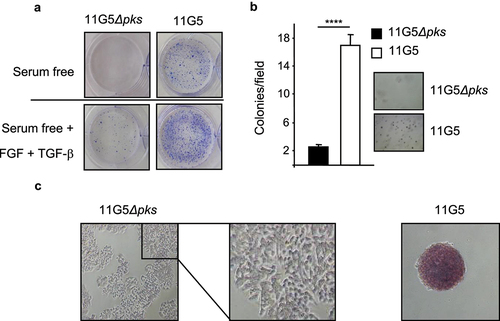
Since chemoresistance and 3D spheroid formation are features of CSCs,Citation2,Citation48,Citation49 we investigated stem cell markers in human colon cancer cells that were made resistant to chemotherapy by CoPEC infection, as described above. Compared to 11G5Δpks-infected cells, CoPEC-infected cells displayed enhanced growth on ultra-low attachment plates () and an ability to form colonies in soft agar (), which are hallmarks of CSCs.Citation50 In addition, 11G5 induced an increase in alkaline phosphatase activity – a well-known stem cell markerCitation51,Citation52 ().
Figure 3. Human colon cancer cells made senescent by 11G5 exhibited rebound growth and features of CSCs at 3 weeks post-infection. (a–c) HT-29 cells were infected with the 11G5 strain or the 11G5Δpks strain, and 3-week post-infection cells were used. (a) Cells were trypsinized and seeded on ultra-low attachment plates in the presence or absence of EGF and FGF. Representative pictures are shown. (b) Cells were trypsinized and seeded in a culture medium with 0.7% soft agar. After 2 weeks, colonies were counted (bar graph). Representative pictures are shown to the right of the bar graph. Values represent means ± SEM; ****p < .0001. (c) Cells were incubated with a substrate of alkaline phosphatase. A brown color signaled substrate degradation by the alkaline phosphatase. Representative pictures are shown.
To confirm the emergence of CSCs from cultures of CoPEC-infected cancer cells, we investigated the expression and sub-cellular location of NANOG, OCT-3/4, SOX2 (SRY-box transcription factor 2), KLF-4 (Kruppel-like factor 4), and c-MYC, which are key transcription factors in cell reprogramming and stem cell pluripotencyCitation52 and used to identify CSCs in a variety of cancers, including CRC.Citation53 Immunofluorescence experiments revealed the expression and accumulation of these four transcription factors in the nuclei of cells at 3 weeks post-infection with 11G5 ( left panel). Their expression was almost undetectable in 11G5Δpks-infected cells ( right panel). Furthermore, CD133, a classic marker of colon CSCs, was also found to be overexpressed in 11G5-infected cells (). Since EMT is a cellular dedifferentiation process tightly linked to CSC formation and drug resistance,Citation2,Citation54 we investigated the expression of EMT markers in human colon cancer cells at 3 weeks post-infection. As shown in , 11G5 infection, unlike 11G5Δpks infection, induced an increase of both N-cadherin and vimentin expression, and a decrease of E-cadherin expression – a pattern usually observed during EMT.Citation6
Figure 4. 11G5 infection of human colon cancer cells fostered the emergence of cells expressing CSC and EMT markers at 3 weeks post-infection. (a–d) cells were infected with the 11G5 strain or the 11G5Δpks strain, and 3-week post-infection cells were used. (a) Spheroids resulting from 11G5 infection were mechanically disrupted and then stained for the transcription factors involved in cellular reprogramming by immunofluorescence [red (SOX-2 and KLF-4) or green (c-MYC, NANOG, OCT3/4)]. Nuclei were stained with DAPI (blue). (b) Quantification of cells expressing CD133. Values represent means ± SEM; *p < .05. (c) Immunofluorescent labelling of the EMT markers N-cadherin or vimentin (red). Nuclei were stained with DAPI (blue). (d) The EMT marker E-cadherin was analysed using Western blot. Bar graph on the right represents quantification of bands density using ImageJ software. Values represent means ± SEM; *p < .05.
![Figure 4. 11G5 infection of human colon cancer cells fostered the emergence of cells expressing CSC and EMT markers at 3 weeks post-infection. (a–d) cells were infected with the 11G5 strain or the 11G5Δpks strain, and 3-week post-infection cells were used. (a) Spheroids resulting from 11G5 infection were mechanically disrupted and then stained for the transcription factors involved in cellular reprogramming by immunofluorescence [red (SOX-2 and KLF-4) or green (c-MYC, NANOG, OCT3/4)]. Nuclei were stained with DAPI (blue). (b) Quantification of cells expressing CD133. Values represent means ± SEM; *p < .05. (c) Immunofluorescent labelling of the EMT markers N-cadherin or vimentin (red). Nuclei were stained with DAPI (blue). (d) The EMT marker E-cadherin was analysed using Western blot. Bar graph on the right represents quantification of bands density using ImageJ software. Values represent means ± SEM; *p < .05.](/cms/asset/0ff0cb21-7c9e-4a50-a60f-9c06cca867f6/kgmi_a_2310215_f0004_oc.jpg)
In a previous study, transcomplementation of clbQ gene in the 11G5ΔclbQ strain, restored the wild-type phenotype (e.g. cellular megalocytosis, cellular senescence, etc.).Citation38 Here, we also double-checked that the observed phenotypes/markers upon 11G5ΔclbQ infection were due to the absence of a functional pks island. For that, HT-29 cells were infected with a transcomplementated 11G5ΔclbQ strain (11G5ΔclbQ:clbQ). As shown in Supplemental , the 11G5ΔclbQ:clbQ strain induced the same cellular consequences as the wild-type 11G5 strain (a decrease in E-cadherin expression, an increase in NANOG expression, and an increase in chemotherapy drugs resistance).
Overall, our results suggested that the post-senescence cancer cell growth observed after CoPEC infection was associated with both EMT induction and CSC emergence.
CoPEC-associated SASP induced EMT and the emergence of CSCs
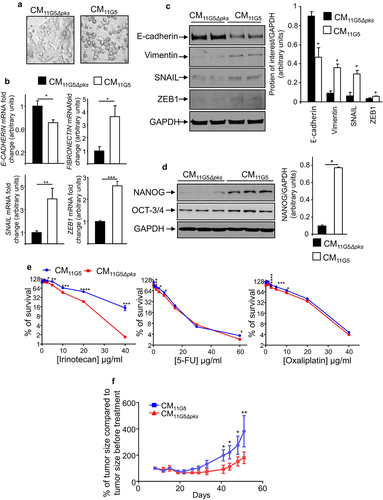
To determine the mechanisms sustaining CSC emergence in response to infection with CoPEC, we analyzed the role of the SASP produced by CoPEC-infected cells. A cell culture medium conditioned by 11G5-infected cells was collected at 5 days post-infection, the delay being necessary to obtain senescent cells in response to CoPEC infection as previously described.Citation38 The resulting conditioned media (CM), which contained the cellular SASP induced by CoPEC, were incubated with non-infected human colon cancer cells. CM derived from 11G5-infected cells (CM11G5), unlike CM derived from 11G5Δpks-infected cells (CM11G5Δpks), induced a change in the morphology of the cells. Instead of growing as a regular monolayer, the cells were rounder and harbored decreased intercellular contacts (). Compared to CM11G5Δpks stimulation, CM11G5 induced a significant decrease in E-cadherin mRNA level, as well as a significant increase in SNAIL, ZEB1, and fibronectin mRNA levels (). A tendency of increasing vimentin and N-cadherin mRNA levels was observed upon CM11G5 versus CM11G5Δpks stimulation (supplemental ). Furthermore, CM11G5 also induced a decreased expression of the protein E-cadherin and an increased accumulation of the proteins vimentin, SNAIL, and ZEB1 (). These indicated that EMT was induced by CM11G5. The NANOG stem cell marker, which is a key regulator of cellular reprogramming fostering CSC traitsCitation55,Citation56 observed in this work in mouse and human CoPEC-infected CRC tumors, was also overexpressed in response to CM11G5 compared to CM11G5Δpks (). Finally, we investigated the impact of CM on cells’ resistance to chemotherapeutic drugs. As shown in , CM11G5 significantly increased in vitro cellular resistance to irinotecan, and tended to increase resistance to 5-FU and to oxaliplatin, compared to CM11G5Δpks. Similarly, mouse xenografts from human colon cancer cells, treated over 5 days before engraftment with CM11G5, were more resistant to irinotecan than those from cells treated over 5 days with CM11G5Δpks ().
Figure 5. The SASP induced by 11G5 infection promoted the expression of CSC and EMT markers leading to chemoresistance in non-infected human colon cancer cells. (a–f) Cells were infected with the 11G5 strain or the 11G5Δpks strain. Five days post-infection, conditioned media (CM) derived from infected cells were collected and used to culture uninfected cells for 3 days (panel B), 5 days (panels A, C, D, F), 7 days (panel E). CM11G5, CM derived from 11G5-infected cells; CM11G5Δpks, CM derived from 11G5Δpks-infected cells. (a) Representative picture of cells incubated with the indicated CM. (b) E-cadherin, fibronectin, SNAIL, and ZEB1 mRNA levels were quantified using qRT-PCR. Values represent means ± SEM. *p < .05; **p < .01; ***p < 0.001. (c) EMT and (d) the NANOG CSC markers were analysed using Western blot. Bar graphs on the right represent quantification of bands density using ImageJ software. Values represent means ± SEM; *p < .05. (e) Uninfected cells were cultured for 1 week with the indicated CM supplemented with various concentrations of chemotherapeutic drugs. Cell viability was assessed using MTT assay. Untreated cells were used to represent 100% viability. Values represent means ± SEM. *p < .05; **p < .01; ***p < .001; ***p < .0001. (f) After 5 days of culture in the presence of the indicated CM, 106 HT-29 cells were subcutaneously injected into the dorsal flaps of 5-week-old nude mice. 7 days post-engraftment, mice received 30 mg/kg of irinotecan twice weekly for 3 weeks. Tumor sizes were measured using a caliper twice weekly. N = 6 mice for CM11G5 group and N = 5 mice for CM11G5Δpks group. Data are means ± SEM. *p < .05; **p < .01.
As expected, CM-derived from HT-29 cells infected with 11G5ΔclbQ:clbQ induced, like CM11G5, a decrease in E-cadherin, an increase in NANOG, and an increased resistance to irinotecan (Supplemental Figure S3).
Our results suggested an active role of senescence and SASP in the induction of EMT, the emergence of CSCs and drug resistance in response to CoPEC infection.
Discussion
The majority of patients with advanced CRC are initially responsive to the combined chemotherapy including 5FU, irinotecan, and oxaliplatin, which constitute first-line therapy for CRC. However, the recurrence of chemoresistant disease following therapy remains an intractable problem and represents a major impediment to reducing the morbidity and mortality attributable to malignant tumors. In addition, colon cancer patients are generally not responsive to novel immune checkpoint therapy.Citation57,Citation58 It is therefore of paramount importance to elucidate the mechanism of chemotherapy resistance in CRC patients. Bacteria overrepresented in human CRC biopsies, such as E. coli, can modulate the physiology of cancer cells. However, our understanding of the CRC and microbe relationships and their influences on therapeutic outcome is in its infancy. The present study has uncovered a novel role for CRC-associated E. coli in modulating therapeutic efficacy.
To address this issue, investigators have traditionally focused on elucidating the cell-intrinsic mechanisms that render tumors refractory to chemotherapeutics. However, cancer resident in organs throughout the body do not develop in isolation. Tumor cells arise in the context of nonmalignant cellular and non-cellular components of a tissue, defined as the tumor microenvironement (TME). The importance of TME in cancer initiation and progression is well established, and TME is now a key target for treatments.Citation59–61 In addition, tumors that arise at epithelial barrier surfaces of the body such as CRC harbor an extensive microbiota in the TME, and the importance of these microbes in cancer is now widely appreciated.Citation62–66 Bacteria overrepresented in human CRC biopsies, such as Bacteroides fragilis, Fusobacterium nucleatum, or E. coli, can modulate the physiology of cancer cells.Citation67–70 However, our understanding of the TME and microbe relationships and their influence on therapeutic outcomes is in its infancy. The present study has uncovered a novel role for CRC TME-associated E. coli in modulating therapeutic efficacy.
CoPEC, unlike E. coli devoid of pks and consequently unable to produce colibactin, promoted (in vitro and in vivo) multi-drug resistance, upregulation of EMT markers, and the emergence of cancer cells exhibiting stemness features. EMT induction and CSC emergence are considered major causes of chemoresistanceCitation2,Citation3,Citation11–15 and could therefore explain the chemoresistance linked to CoPEC infection. The co-emergence of EMT and CSCs in response to CoPEC accorded with the revised view of CSC and EMT, in which EMT is a way to access stemness.Citation2,Citation7,Citation9,Citation10,Citation16,Citation71 In the stomach, the carcinogen Helicobacter pylori drives EMT.Citation72,Citation73 Epithelial feature alteration by EMT might therefore be a mechanism shared by pathogenic microbial communities involved in cancer progression.
Compared to other CSC markers (OCT-3/4, NANOG, etc.), the percentage of cells positive for CD133 upon 11G5 infection might appear low. However, it should be noted that CD133 regulation is complex; it involves several transcription factors (OCT4, SOX2, HIF, NICD) and therefore the physiological context of cells.Citation74 Furthermore, even if OCT4 and SOX2 are overexpressed and are localized in the nucleus upon CoPEC infection (), we did not identify on which promoters they are bound. It should be interesting to perform a ChIP-seq analysis of 11G5-infected cells in order to decipher on which promoters OCT4, SOX2 … bind.
This role of CoPEC in the promotion of EMT and CSCs was supported by the induction of EMT and CSC markers by the secretory phenotype of colon cancer cells made senescent by CoPEC infection. Cellular senescence – a state of cell cycle arrest usually considered to be stable – is a key mechanism for countering tumorigenesis by halting the proliferation of damaged cells.Citation75 However, senescent cells secrete a complex mix of cytokines, chemokines, matrix metalloproteinases (MMP), and growth factors, known as SASP.Citation75,Citation76 Senescence induction and SASP stigmas have been observed in response to CoPEC infection in vitro, in CRC mouse models, and in human CRC biopsies.Citation38,Citation39 CoPEC-associated SASP taken from colon cancer cells comprised IL-6, MMP-3, and growth factors, including fibroblast growth factor (FGF) and hepatocyte growth factor (HGF),Citation38,Citation77 which are inducers of EMTs.Citation78 By inducing senescence and the corresponding secretory phenotype, CoPEC not only exerts selection pressure that enhances the expansion of senescence-resistant CSCs but indirectly promotes a tumor microenvironment favorable to CSC emergence via the EMT pathway in agreement with the key role of the tumor microenvironment in the regulation of CSC compartments.Citation71,Citation79,Citation80
In conclusion, our data supported the hypothesis that CoPEC can play a role in CRC progression and resistance to chemotherapy. Previous studies have shown that CoPEC can induce DNA damage, leading to mutations and chromosomal instability, which may be involved in cancer initiation. Our results showed that they can also affect the fate of tumors through the promotion of EMT and CSCs, which can affect cancer progression and susceptibility to treatments including chemotherapies and the therapy anti-PD1.Citation81
Materials and methods
Bacterial strains
The clinical 11G5 CoPEC strain, its isogenic mutant depleted for the clbQ gene in the pks island (11G5Δpks) unable to produce colibactin,Citation38 and the transcomplemented 11G5Δpks strain (11G5Δpks:pks),Citation38 were grown at 37°C in Luria-Bertani (LB) medium overnight. Bacterial inoculums were assessed at OD620 nm using a NanoPhotometer® (Implen GmbH, Munich, Germany).
Cell culture
The human intestinal epithelial cells HT-29 (ATCC, HTB38) were maintained in an atmosphere containing 5% CO2 at 37°C in the culture medium recommended by ATCC (American Type Culture Collection).
Infection and preparation of conditioned medium (CM)
The cells were infected as previously described.Citation38 Briefly, after 3 h of infection at a multiplicity of infection (MOI) of 500, cells were extensively washed with PBS and a culture medium containing 200 μg/mL of gentamicin was added. The culture medium was changed every 2 days. For the preparation of a conditioned medium, 5 days post-infection, cells were washed with PBS and a culture medium without serum was added. Sixteen hours later, the medium was collected (as a conditioned medium) and used to culture uninfected cells for the indicated time. The conditioned medium was changed every 2 days.
Culture in soft agar
Three weeks post-infection, HT-29 cells were trypsinized, seeded in a culture medium with 0.7% soft agar, and plated on 12-well plates (2,500 cells/well). The culture medium was changed every 2 days (1 mL/well). After 2 weeks, cells were stained using 0.05% crystal violet.
Culture using ultra-low attachment plates
Three weeks post-infection, the cells were trypsinized and 200,000 cells were plated in 6-well plates (ultra-low attachment plates; Corning® Inc., NY, USA). After 7 days, the cells were washed with PBS, stained with Giemsa stain, and counted.
Alkaline phosphatase activity
Three weeks post-infection, the cells were washed with PBS and fixed with 3.7% paraformaldehyde for 3 min at room temperature. After several washes with PBS, cells were incubated for 2 h at room temperature in darkness with the alkaline phosphatase substrate BCIP®/NBT, according to the manufacturer’s instructions (SIGMAFAST™ BCIP®/NBT; Sigma-Aldrich, MO, USA).
Protein extraction and western blot analysis
Cell and tissue samples were lysed in radioimmune precipitation assay buffer (150 mM NaCl, 0.5% sodium deoxycholate, 50 mM Tris-HCl, pH 8, 0.1% SDS, 0.1% Nonidet™ P -40) supplemented with protease inhibitors (Roche AG, Switzerland). Proteins were separated on SDS/PAGE gels, transferred to nitrocellulose membranes, and blocked with 5% nonfat milk in PBS containing 0.1% Tween® 20. The membranes were then probed overnight at 4°C with the relevant primary antibodies: anti-E-cadherin (Cell Signaling Technology, MA, USA), anti-vimentin (Cell Signaling Technology), anti-SNAIL (Thermo Fisher Scientific, MA, USA), anti-ZEB1 (Cell Signaling Technology), anti-OCT3/4 (Cell Signaling Technology), anti-NANOG (Cell Signaling Technology), and anti-GAPDH (Cell Signaling Technology). After extensive washing, the membranes were incubated with the appropriate HRP-conjugated secondary antibodies (Cell Signaling Technology). Blots were detected using an enhanced chemiluminescence detection kit (Amersham BioSciences, UK) and revealed using the ChemiDocTM XRS System (Bio-Rad Laboratories, CA, USA).
Fluorescent microscopy
Three weeks post-infection, cells were trypsinized, seeded on coverslips, fixed with 4% paraformaldehyde, permeabilized with 0.5% Triton™ X-100 for 20 min, and blocked for 1 h with PBS containing 0.025% Triton™ X-100, 3% BSA, and 5% FBS. Cells were immunostained overnight at 4°C with the indicated primary antibodies: anti-c-MYC (Cell Signaling Technology), anti-SOX2 (Cell Signaling Technology), anti-NANOG (Cell Signaling Technology), anti-KLF4 (Abcam, UK), anti-OCT3/4 (Cell Signaling Technology), anti-N-cadherin (Cell Signaling Technology), and anti-vimentin (Cell Signaling Technology). After washing with PBS, slides were incubated with appropriate secondary antibodies coupled with Alexa488™ or Cy3 dyes (Molecular Probes, OR, USA). Nuclei were stained with DAPI (Sigma-Aldrich, MO, USA). Coverslips were then mounted with Mowiol® solution (Calbiochem®; Sigma-Aldrich, MO, USA), and the slides were examined with a Zeiss LSM 510 Meta (ZEISS, Germany) confocal microscope. Each microscopy image represents three independent experiments.
Quantitative real-time RT-PCR (qRT-PCR)
Total RNAs were isolated using TRIzol® reagent (Thermo Fisher Scientific) following the manufacturer’s instructions. Two micrograms of mRNA were reverse transcribed using a first-strand cDNA synthesis kit (EUROMEDEX, France), and qRT-PCRs were performed using MESA BLUE qPCR kits for SYBR® assay (Eurogentec, Belgium) on a Mastercycler Realplex4 (Eppendorf, Germany) with specific primers (see Supplemental Table S1). 36B4 was used as an internal control for the quantification of mRNA expression. Fold induction was calculated using the Ct method, and the final data were derived from 2−ΔΔCt.
Quantification of CD133 positive cells using flow cytometry
Briefly, 3 weeks post-infection, cells were trypsinized and 106 cells were resuspended in 45 µl of PBS containing 2 mM of EDTA and 2% FBS. After the addition of 20 µl of FCR blocking reagent (Miltenyi Biotec, Germany), the cells were incubated at 4°C for 10 min with anti-CD133 antibody (Miltenyi Biotec) following the manufacturer’s instructions. Before the analyses, the cells were washed twice with PBS containing 2 mM EDTA and 2% FBS, and 7-AAD (0.25 µg/reaction; BD Biosciences, CA, USA) was added to detect dead cells. Cell populations were detected using a BD FACSAria™ SORP (BD Biosciences). For gating, we only considered singlets viable cells.
In vitro drug resistance assays
Three weeks post-infection, the cells were trypsinized, seeded in 96-well plates (5 × 10³/well), and cultured for 1 week with chemotherapeutic drugs. In order to assess the impact of the conditioned medium on HT-29 cells’ resistance to chemotherapeutic drugs, HT-29 cells were seeded in 96-well plates (5 × 10Citation3/well) and cultured for 1 week with CM derived from 11G5-infected HT-29 cells or from 11G5Δpks-infected HT-29 cells supplemented with chemotherapeutic drugs. Cell viability was assessed using the 3-(4,5-dimethylthiazol-2-yl)-2,5-diphenyltetrazolium bromide (MTT) assay.
AOM/DSS mouse model
Six-to-eight-week-old C57BL/6 mice (Charles River Laboratories, Ecully, France) were intraperitoneally injected with AOM (10 mg/kg body weight; Sigma-Aldrich, MO, USA) and treated with streptomycin in drinking water (2 mg/mL) for 2 days to facilitate CoPEC colonization.Citation38 Mice were allowed to drink regular water for 24 h and received 109 colony forming units of 11G5 or 11G5Δpks by gavage. Five days later, their drinking water was supplemented with 2% dextran sodium sulfate (DSS, colitis grade (36,000–50,000); MP Biomedicals, Illkirch-Graffenstaden, France) for 1 week. The mice then received regular water for 2 weeks. This cycle (1 week of DSS; 2 weeks of regular water) was repeated once, and the mice were then sacrificed. Colon tumors were collected using a dissecting microscope, immediately frozen in liquid nitrogen, and stored at −80°C until protein extraction. None of the mice were removed.
Xenograft mouse model
Three weeks post-infection, HT-29 cells were trypsinized; then, 106 cells were embedded in a growth factor-reduced Matrigel®(Becton Dickinson, NJ, USA) and subcutaneously injected into the dorsal flaps of 5-week-old female nude mice (Charles River Laboratories, Ecully, France). Seven days post-engraftment, mice received 30 mg/kg of 5-FU twice weekly for 3 weeks. The tumor sizes were measured using calipers twice a week. In order to assess the impact of the conditioned medium on HT-29 cells’ resistance to chemotherapeutic drugs in vivo, HT-29 cells were cultured for 5 days with a conditioned medium derived from 11G5-infected HT-29 cells or 11G5Δpks-infected HT-29 cells. The cells were trypsinized, then 106 cells were embedded in growth factor-reduced Matrigel® and subcutaneously injected into the dorsal flaps of 5-week-old female nude mice. Seven days post-engraftment, the mice received 30 mg/kg of irinotecan twice weekly for 3 weeks. Tumor sizes were evaluated twice weekly with caliper measurements using the following formula: tumor volume = (length × widthCitation2/2). Relative tumor growth inhibition was calculated by the relative tumor growth of the treated mice divided by the relative tumor growth of the control mice following the initiation of therapy. None of the mice were removed.
Ethics statement
The animal protocols were approved by the French Ministry of Education, Research and Innovation (APAFIS permits numbers #4096, #4099), and all animals were used in accordance with the European Community guidelines for the care and use of animals (86/609/CEE).
Samples from CRC patients were collected, according to previously published studies,Citation34,Citation38 from colon resections that were required for the treatment of the patients. Ethical approval for the study was granted by the Clermont-Ferrand Research Ethics Committee. Verbal informed consent to participate in the research was obtained from all the patients included in the study in accordance with French bioethics law (Act No. 2004-800 of August 6, 2004). Samples were taken from the resected colons at the site of malignant tumors. Pathological analysis confirmed the neoplastic features of the samples.
Statistical analysis
Values are expressed as means ± SEM. Statistical analyses were performed with GraphPad Prism version 5.01 software using a two-tailed Student’s t-test or a Mann-Whitney U-test, depending on the results of a D’Agostino-Pearson omnibus normality test. When appropriate, a one-way ANOVA test with a Bonferroni post hoc test was performed.
Supplemental Figures revised version.docx
Download MS Word (256.8 KB)supplementary_data.docx
Download MS Word (12.8 KB)Acknowledgments
The authors thank Anne-Sophie Marinelli for her technical assistance, Dr Céline Bourgne for her help with the flow cytometry (Plateforme de cytométrie en flux, CHU Clermont-Ferrand), and the platform CLIC (Clermont-Ferrand Imagerie Confocale, Université Clermont Auvergne) for assistance with the microscopy. This study was supported by the Ministère de la Recherche et de la Technologie, Inserm (UMR 1071), INRAe (USC 1382), the French government’s IDEX-ISITE initiative 16-IDEX-0001 (CAP 20-25), and the ITMO Cancer AVIESAN (Alliance Nationale pour les Sciences de la Vie et de la Santé, National Alliance for Life Sciences & Health) within the framework of the Cancer Plan (HTE201601).
Disclosure statement
No potential conflict of interest was reported by the author(s).
Data availability statement
The data that support the findings of this study are available from the corresponding author, GD, upon reasonable request.
Supplementary material
Supplemental data for this article can be accessed online at https://doi.org/10.1080/19490976.2024.2310215
Additional information
Funding
References
- Yauch RL, Settleman J. Recent advances in pathway-targeted cancer drug therapies emerging from cancer genome analysis. Curr Opin Genet Dev. 2012;22(1):45–15. doi:10.1016/j.gde.2012.01.003.
- Batlle E, Clevers H. Cancer stem cells revisited. Nat Med. 2017;23(10):1124–1134. doi:10.1038/nm.4409.
- Lytle NK, Barber AG, Reya T. Stem cell fate in cancer growth, progression and therapy resistance. Nat Rev Cancer. 2018;18(11):669–680. doi:10.1038/s41568-018-0056-x.
- Savagner P, Yamada KM, Thiery JP. The zinc-finger protein slug causes desmosome dissociation, an initial and necessary step for growth factor–induced epithelial–mesenchymal transition. J Cell Biol. 1997;137(6):1403–1419. doi:10.1083/jcb.137.6.1403.
- Cano A, Pérez-Moreno MA, Rodrigo I, Locascio A, Blanco MJ, Del Barrio MG, Portillo F, Nieto MA. The transcription factor snail controls epithelial–mesenchymal transitions by repressing E-cadherin expression. Nat Cell Biol. 2000;2(2):76–83. doi:10.1038/35000025.
- Zeisberg M, Neilson EG. Biomarkers for epithelial-mesenchymal transitions. J Clin Invest. 2009;119(6):1429–1437. doi:10.1172/JCI36183.
- Chaffer CL, Marjanovic ND, Lee T, Bell G, Kleer CG, Reinhardt F, D’Alessio AC, Young RA, Weinberg RA. Poised chromatin at the ZEB1 promoter enables breast cancer cell plasticity and enhances tumorigenicity. Cell. 2013;154(1):61–74. doi:10.1016/j.cell.2013.06.005.
- Ye X, Tam WL, Shibue T, Kaygusuz Y, Reinhardt F, Ng Eaton E, Weinberg RA. Distinct EMT programs control normal mammary stem cells and tumour-initiating cells. Nature. 2015;525(7568):256–260. doi:10.1038/nature14897.
- Beck B, Lapouge G, Rorive S, Drogat B, Desaedelaere K, Delafaille S, Dubois C, Salmon I, Willekens K, Marine J-C. et al. Different levels of Twist1 regulate skin tumor initiation, stemness, and progression. Cell Stem Cell. 2015;16(1):67–79. doi:10.1016/j.stem.2014.12.002.
- Schmidt JM, Panzilius E, Bartsch HS, Irmler M, Beckers J, Kari V, Linnemann JR, Dragoi D, Hirschi B, Kloos UJ. et al. Stem-cell-like properties and epithelial plasticity arise as stable traits after transient Twist1 activation. Cell Rep. 2015;10(2):131–139. doi:10.1016/j.celrep.2014.12.032.
- Oliveras-Ferraros C, Corominas-Faja B, Cufí S, Vazquez-Martin A, Martin-Castillo B, Iglesias JM, López-Bonet E, Martin ÁG, Menendez JA. Epithelial-to-mesenchymal transition (EMT) confers primary resistance to trastuzumab (herceptin). Cell Cycle Georget Tex. 2012;11(21):4020–4032. doi:10.4161/cc.22225.
- Ren J, Chen Y, Song H, Chen L, Wang R. Inhibition of ZEB1 reverses EMT and chemoresistance in docetaxel-resistant human lung adenocarcinoma cell line. J Cell Biochem. 2013;114(6):1395–1403. doi:10.1002/jcb.24481.
- Wilson C, Nicholes K, Bustos D, Lin E, Song Q, Stephan J-P, Kirkpatrick DS, Settleman J. Overcoming EMT-associated resistance to anti-cancer drugs via Src/FAK pathway inhibition. Oncotarget. 2014;5(17):7328–7341. doi:10.18632/oncotarget.2397.
- Wilson C, Ye X, Pham T, Lin E, Chan S, McNamara E, Neve RM, Belmont L, Koeppen H, Yauch RL. et al. AXL inhibition sensitizes mesenchymal cancer cells to antimitotic drugs. Cancer Res. 2014;74(20):5878–5890. doi:10.1158/0008-5472.CAN-14-1009.
- Song K-A, Niederst MJ, Lochmann TL, Hata AN, Kitai H, Ham J, Floros KV, Hicks MA, Hu H, Mulvey HE. et al. Epithelial-to-mesenchymal transition antagonizes response to targeted therapies in lung cancer by suppressing BIM. Clin Cancer Res Off J Am Assoc Cancer Res. 2018;24(1):197–208. doi:10.1158/1078-0432.CCR-17-1577.
- Puisieux A, Brabletz T, Caramel J. Oncogenic roles of EMT-inducing transcription factors. Nat Cell Biol. 2014;16(6):488–494. doi:10.1038/ncb2976.
- Thiery JP, Acloque H, Huang RYJ, Nieto MA. Epithelial-mesenchymal transitions in development and disease. Cell. 2009;139(5):871–890. doi:10.1016/j.cell.2009.11.007.
- Wellner U, Schubert J, Burk UC, Schmalhofer O, Zhu F, Sonntag A, Waldvogel B, Vannier C, Darling D, zur Hausen A. et al. The EMT-activator ZEB1 promotes tumorigenicity by repressing stemness-inhibiting microRnas. Nat Cell Biol. 2009;11(12):1487–1495. doi:10.1038/ncb1998.
- Viaud S, Saccheri F, Mignot G, Yamazaki T, Daillère R, Hannani D, Enot DP, Pfirschke C, Engblom C, Pittet MJ. et al. The intestinal microbiota modulates the anticancer immune effects of cyclophosphamide. Sci. 2013;342(6161):971–976. doi:10.1126/science.1240537.
- Iida N, Dzutsev A, Stewart CA, Smith L, Bouladoux N, Weingarten RA, Molina DA, Salcedo R, Back T, Cramer S. et al. Commensal bacteria control cancer response to therapy by modulating the tumor microenvironment. Sci. 2013;342(6161):967–970. doi:10.1126/science.1240527.
- Lehouritis P, Cummins J, Stanton M, Murphy CT, McCarthy FO, Reid G, Urbaniak C, Byrne WL, Tangney M. Local bacteria affect the efficacy of chemotherapeutic drugs. Sci Rep. 2015;5:14554. doi:10.1038/srep14554.
- Geller LT, Barzily-Rokni M, Danino T, Jonas OH, Shental N, Nejman D, Gavert N, Zwang Y, Cooper ZA, Shee K. et al. Potential role of intratumor bacteria in mediating tumor resistance to the chemotherapeutic drug gemcitabine. Sci. 2017;357(6356):1156–1160. doi:10.1126/science.aah5043.
- Sivan A, Corrales L, Hubert N, Williams JB, Aquino-Michaels K, Earley ZM, Benyamin FW, Lei YM, Jabri B, Alegre M-L. et al. Commensal bifidobacterium promotes antitumor immunity and facilitates anti–PD-L1 efficacy. Sci. 2015;350(6264):1084–1089. doi:10.1126/science.aac4255.
- Vétizou M, Pitt JM, Daillère R, Lepage P, Waldschmitt N, Flament C, Rusakiewicz S, Routy B, Roberti MP, Duong CPM. et al. Anticancer immunotherapy by CTLA-4 blockade relies on the gut microbiota. Sci. 2015;350(6264):1079–1084. doi:10.1126/science.aad1329.
- Yu T, Guo F, Yu Y, Sun T, Ma D, Han J, Qian Y, Kryczek I, Sun D, Nagarsheth N. et al. Fusobacterium nucleatum promotes chemoresistance to colorectal cancer by modulating autophagy. Cell. 2017;170(3):548–563.e16. doi:10.1016/j.cell.2017.07.008.
- Ramos A, Hemann MT. Drugs, Bugs, and Cancer: Fusobacterium nucleatum Promotes Chemoresistance in Colorectal Cancer. Cell. 2017;170(3):411–413. doi:10.1016/j.cell.2017.07.018.
- Mandip KC, Steer CJ. Novel mechanisms of chemoresistance by Fusobacterium nucleatum involve not so novel pathways of microRnas and autophagy. Transl Cancer Res. 2018;7(S1):S10–S15. doi:10.21037/tcr.2017.12.20.
- Zhang S, Yang Y, Weng W, Guo B, Cai G, Ma Y, Cai S. Fusobacterium nucleatum promotes chemoresistance to 5-fluorouracil by upregulation of BIRC3 expression in colorectal cancer. J Exp Clin Cancer Res CR. 2019;38(1):14. doi:10.1186/s13046-018-0985-y.
- Liu Y, Baba Y, Ishimoto T, Tsutsuki H, Zhang T, Nomoto D, Okadome K, Yamamura K, Harada K, Eto K. et al. Fusobacterium nucleatum confers chemoresistance by modulating autophagy in oesophageal squamous cell carcinoma. Br J Cancer. 2021;124(5):963–974. doi:10.1038/s41416-020-01198-5.
- Tenaillon O, Skurnik D, Picard B, Denamur E. The population genetics of commensal Escherichia coli. Nat Rev Microbiol. 2010;8(3):207–217. doi:10.1038/nrmicro2298.
- Croxen MA, Finlay BB. Molecular mechanisms of Escherichia coli pathogenicity. Nat Rev Microbiol. 2010;8(1):26–38. doi:10.1038/nrmicro2265.
- Swidsinski A, Khilkin M, Kerjaschki D, Schreiber S, Ortner M, Weber J, Lochs H. Association between intraepithelial Escherichia coli and colorectal cancer. Gastroenterology. 1998;115(2):281–286. doi:10.1016/S0016-5085(98)70194-5.
- Martin HM, Campbell BJ, Hart CA, Mpofu C, Nayar M, Singh R, Englyst H, Williams HF, Rhodes JM. Enhanced Escherichia coli adherence and invasion in Crohn’s disease and colon cancer. Gastroenterology. 2004;127(1):80–93. doi:10.1053/j.gastro.2004.03.054.
- Buc E, Dubois D, Sauvanet P, Raisch J, Delmas J, Darfeuille-Michaud A, Pezet D, Bonnet R, Battista JR. High prevalence of mucosa-associated E. coli producing cyclomodulin and genotoxin in colon cancer. PloS ONE. 2013;8(2):e56964. doi:10.1371/journal.pone.0056964.
- Dejea CM, Fathi P, Craig JM, Boleij A, Taddese R, Geis AL, Wu X, DeStefano Shields CE, Hechenbleikner EM, Huso DL. et al. Patients with familial adenomatous polyposis harbor colonic biofilms containing tumorigenic bacteria. Sci. 2018;359(6375):592–597. doi:10.1126/science.aah3648.
- Arthur JC, Perez-Chanona E, Mühlbauer M, Tomkovich S, Uronis JM, Fan T-J, Campbell BJ, Abujamel T, Dogan B, Rogers AB. et al. Intestinal inflammation targets cancer-inducing activity of the microbiota. Sci. 2012;338(6103):120–123. doi:10.1126/science.1224820.
- Bonnet M, Buc E, Sauvanet P, Darcha C, Dubois D, Pereira B, Déchelotte P, Bonnet R, Pezet D, Darfeuille-Michaud A. Colonization of the human gut by E. coli and colorectal cancer risk. Clin Cancer Res Off J Am Assoc Cancer Res. 2014;20(4):859–867. doi:10.1158/1078-0432.CCR-13-1343.
- Cougnoux A, Dalmasso G, Martinez R, Buc E, Delmas J, Gibold L, Sauvanet P, Darcha C, Déchelotte P, Bonnet M. et al. Bacterial genotoxin colibactin promotes colon tumour growth by inducing a senescence-associated secretory phenotype. Gut. 2014;63(12):1932–1942. doi:10.1136/gutjnl-2013-305257.
- Cougnoux A, Delmas J, Gibold L, Faïs T, Romagnoli C, Robin F, Cuevas-Ramos G, Oswald E, Darfeuille-Michaud A, Prati F. et al. Small-molecule inhibitors prevent the genotoxic and protumoural effects induced by colibactin-producing bacteria. Gut. 2016;65(2):278–285. doi:10.1136/gutjnl-2014-307241.
- Faïs T, Delmas J, Barnich N, Bonnet R, Dalmasso G. Colibactin: more than a New Bacterial Toxin. Toxins. 2018;10(4):10. doi:10.3390/toxins10040151.
- Vizcaino MI, Crawford JM. The colibactin warhead crosslinks DNA. Nat Chem. 2015;7(5):411–417. doi:10.1038/nchem.2221.
- Nougayrède J-P, Homburg S, Taieb F, Boury M, Brzuszkiewicz E, Gottschalk G, Buchrieser C, Hacker J, Dobrindt U, Oswald E. Escherichia coli induces DNA double-strand breaks in eukaryotic cells. Sci. 2006;313(5788):848–851. doi:10.1126/science.1127059.
- Cuevas-Ramos G, Petit CR, Marcq I, Boury M, Oswald E, Nougayrède J-P. Escherichia coli induces DNA damage in vivo and triggers genomic instability in mammalian cells. Proc Natl Acad Sci U S A. 2010;107(25):11537–11542. doi:10.1073/pnas.1001261107.
- Pleguezuelos-Manzano C, Puschhof J, Rosendahl Huber A, van Hoeck A, Wood HM, Nomburg J, Gurjao C, Manders F, Dalmasso G, Stege PB. et al. Mutational signature in colorectal cancer caused by genotoxic pks+ E. coli. Nature. 2020;580(7802):269–273. doi:10.1038/s41586-020-2080-8.
- Wang M-L, Chiou S-H, Wu C-W. Targeting cancer stem cells: emerging role of nanog transcription factor. OncoTargets Ther. 2013;6:1207–1220. doi:10.2147/OTT.S38114.
- Mohiuddin IS, Wei S-J, Kang MH. Role of OCT4 in cancer stem-like cells and chemotherapy resistance. Biochim Biophys Acta Mol Basis Dis. 2020;1866(4):165432. doi:10.1016/j.bbadis.2019.03.005.
- Walcher L, Kistenmacher A-K, Suo H, Kitte R, Dluczek S, Strauß A, Blaudszun A-R, Yevsa T, Fricke S, Kossatz-Boehlert U. Cancer stem cells-origins and biomarkers: perspectives for targeted personalized therapies. Front Immunol. 2020;11:1280. doi:10.3389/fimmu.2020.01280.
- Pastrana E, Silva-Vargas V, Doetsch F. Eyes wide open: a critical review of sphere-formation as an assay for stem cells. Cell Stem Cell. 2011;8(5):486–498. doi:10.1016/j.stem.2011.04.007.
- Weiswald L-B, Bellet D, Dangles-Marie V. Spherical cancer models in tumor biology. Neoplasia N Y N. 2015;17(1):1–15. doi:10.1016/j.neo.2014.12.004.
- Rotem A, Janzer A, Izar B, Ji Z, Doench JG, Garraway LA, Struhl K. Alternative to the soft-agar assay that permits high-throughput drug and genetic screens for cellular transformation. Proc Natl Acad Sci U S A. 2015;112(18):5708–5713. doi:10.1073/pnas.1505979112.
- Thomson JA, Itskovitz-Eldor J, Shapiro SS, Waknitz MA, Swiergiel JJ, Marshall VS, Jones JM. Embryonic stem cell lines derived from human blastocysts. Sci. 1998;282(5391):1145–1147. doi:10.1126/science.282.5391.1145.
- Takahashi K, Yamanaka S. Induction of pluripotent stem cells from mouse embryonic and adult fibroblast cultures by defined factors. Cell. 2006;126(4):663–676. doi:10.1016/j.cell.2006.07.024.
- Munro MJ, Wickremesekera SK, Peng L, Tan ST, Itinteang T. Cancer stem cells in colorectal cancer: a review. J Clin Pathol. 2018;71(2):110–116. doi:10.1136/jclinpath-2017-204739.
- Shibue T, Weinberg RA. EMT, CSCs, and drug resistance: the mechanistic link and clinical implications. Nat Rev Clin Oncol. 2017;14(10):611–629. doi:10.1038/nrclinonc.2017.44.
- Jeter CR, Yang T, Wang J, Chao H-P, Tang DG. Concise review: NANOG in cancer stem cells and tumor development: an update and outstanding questions. Stem Cells Dayt Ohio. 2015;33(8):2381–2390. doi:10.1002/stem.2007.
- Lathia JD, Liu H. Overview of cancer stem cells and stemness for community oncologists. Target Oncol. 2017;12(4):387–399. doi:10.1007/s11523-017-0508-3.
- Dahan L, Sadok A, Formento J-L, Seitz JF, Kovacic H. Modulation of cellular redox state underlies antagonism between oxaliplatin and cetuximab in human colorectal cancer cell lines. Br J Pharmacol. 2009;158(2):610–620. doi:10.1111/j.1476-5381.2009.00341.x.
- Zou W, Wolchok JD, Chen L. PD-L1 (B7-H1) and PD-1 pathway blockade for cancer therapy: mechanisms, response biomarkers and combinations. Sci Transl Med. 2016;8(328):328rv4. doi:10.1126/scitranslmed.aad7118.
- Smyth MJ, Ngiow SF, Ribas A, Teng MWL. Combination cancer immunotherapies tailored to the tumour microenvironment. Nat Rev Clin Oncol. 2016;13(3):143–158. doi:10.1038/nrclinonc.2015.209.
- Binnewies M, Roberts EW, Kersten K, Chan V, Fearon DF, Merad M, Coussens LM, Gabrilovich DI, Ostrand-Rosenberg S, Hedrick CC. et al. Understanding the tumor immune microenvironment (TIME) for effective therapy. Nat Med. 2018;24(5):541–550. doi:10.1038/s41591-018-0014-x.
- Jin M-Z, Jin W-L. The updated landscape of tumor microenvironment and drug repurposing. Sig Transduct Target Ther. 2020;5(1):1–16. doi:10.1038/s41392-020-00280-x.
- Hajishengallis G, Darveau RP, Curtis MA. The keystone-pathogen hypothesis. Nat Rev Microbiol. 2012;10(10):717–725. doi:10.1038/nrmicro2873.
- Tjalsma H, Boleij A, Marchesi JR, Dutilh BE. A bacterial driver–passenger model for colorectal cancer: beyond the usual suspects. Nat Rev Microbiol. 2012;10(8):575–582. doi:10.1038/nrmicro2819.
- Cummins J, Tangney M. Bacteria and tumours: causative agents or opportunistic inhabitants? Infect Agent Cancer. 2013;8(1):11. doi:10.1186/1750-9378-8-11.
- Zitvogel L, Galluzzi L, Viaud S, Vétizou M, Daillère R, Merad M, Kroemer G. Cancer and the gut microbiota: an unexpected link. Sci Transl Med. 2015;7(271). doi:10.1126/scitranslmed.3010473.
- Gagnaire A, Nadel B, Raoult D, Neefjes J, Gorvel J-P. Collateral damage: insights into bacterial mechanisms that predispose host cells to cancer. Nat Rev Microbiol. 2017;15(2):109–128. doi:10.1038/nrmicro.2016.171.
- Sears CL, Garrett WS. Microbes, microbiota, and colon cancer. Cell Host & Microbe. 2014;15(3):317–328. doi:10.1016/j.chom.2014.02.007.
- Gagnière J, Raisch J, Veziant J, Barnich N, Bonnet R, Buc E, Bringer M-A, Pezet D, Bonnet M. Gut microbiota imbalance and colorectal cancer. World J Gastroenterol. 2016;22(2):501–518. doi:10.3748/wjg.v22.i2.501.
- Mármol I, Sánchez-de-Diego C, Pradilla Dieste A, Cerrada E, Rodriguez Yoldi MJ. Colorectal Carcinoma: A General Overview and Future Perspectives in Colorectal Cancer. Int J Mol Sci. 2017;18(1):18. doi:10.3390/ijms18010197.
- Allen J, Sears CL. Impact of the gut microbiome on the genome and epigenome of colon epithelial cells: contributions to colorectal cancer development. Genome Med. 2019;11(1):11. doi:10.1186/s13073-019-0621-2.
- Mani SA, Guo W, Liao M-J, Eaton EN, Ayyanan A, Zhou AY, Brooks M, Reinhard F, Zhang CC, Shipitsin M. et al. The epithelial-mesenchymal transition generates cells with properties of stem cells. Cell. 2008;133(4):704–715. doi:10.1016/j.cell.2008.03.027.
- Amieva MR, Vogelmann R, Covacci A, Tompkins LS, Nelson WJ, Falkow S. Disruption of the epithelial apical-junctional complex by Helicobacter pylori CagA. Sci. 2003;300(5624):1430–1434. doi:10.1126/science.1081919.
- Hoy B, Löwer M, Weydig C, Carra G, Tegtmeyer N, Geppert T, Schröder P, Sewald N, Backert S, Schneider G. et al. Helicobacter pylori HtrA is a new secreted virulence factor that cleaves E-cadherin to disrupt intercellular adhesion. EMBO Rep. 2010;11(10):798–804. doi:10.1038/embor.2010.114.
- Liou G-Y. CD133 as a regulator of cancer metastasis through the cancer stem cells. Int J Biochem Cell Biol. 2019;106:1–7. doi:10.1016/j.biocel.2018.10.013.
- Ghosh K, Capell BC. The senescence-associated secretory phenotype: critical effector in skin cancer and aging. J Invest Dermatol. 2016;136(11):2133–2139. doi:10.1016/j.jid.2016.06.621.
- Ito M, Kanno S, Nosho K, Sukawa Y, Mitsuhashi K, Kurihara H, Igarashi H, Takahashi T, Tachibana M, Takahashi H. et al. Association of Fusobacterium nucleatum with clinical and molecular features in colorectal serrated pathway. Int J Cancer. 2015;137(6):1258–1268. doi:10.1002/ijc.29488.
- Secher T, Samba-Louaka A, Oswald E, Nougayrède J-P, Sherman M. Escherichia coli producing colibactin triggers premature and transmissible senescence in mammalian cells. PloS ONE. 2013;8(10):e77157. doi:10.1371/journal.pone.0077157.
- Lamouille S, Xu J, Derynck R. Molecular mechanisms of epithelial–mesenchymal transition. Nat Rev Mol Cell Biol. 2014;15(3):178–196. doi:10.1038/nrm3758.
- Morel A-P, Lièvre M, Thomas C, Hinkal G, Ansieau S, Puisieux A, Klefstrom J. Generation of breast cancer stem cells through epithelial-mesenchymal transition. PloS ONE. 2008;3(8):e2888. doi:10.1371/journal.pone.0002888.
- Prieto-Vila M, Takahashi R-U, Usuba W, Kohama I, Ochiya T. Drug resistance driven by cancer stem cells and their niche. Int J Mol Sci. 2017;18(12):18. doi:10.3390/ijms18122574.
- Lopès A, Billard E, Casse AH, Villéger R, Veziant J, Roche G, Carrier G, Sauvanet P, Briat A, Pagès F. et al. Colibactin-positive Escherichia coli induce a procarcinogenic immune environment leading to immunotherapy resistance in colorectal cancer. Int J Cancer. 2020;146(11):3147–3159. doi:10.1002/ijc.32920.