
ABSTRACT
The gut fungi play important roles in human health and are involved in energy metabolism. This study aimed to examine gut mycobiome composition in obese subjects in two geographically different regions in China and to identify specific gut fungi associated with obesity. A total of 217 subjects from two regions with different urbanization levels [Hong Kong (HK): obese, n = 59; lean, n = 59; Kunming (KM): obese, n = 50; lean, n = 49. Mean body mass index (BMI) for obesity = 33.7] were recruited. We performed deep shotgun metagenomic sequencing on fecal samples to compare gut mycobiome composition and trophic functions in lean and obese subjects across these two regions. The gut mycobiome of obese subjects in both HK and KM were altered compared to those of lean subjects, characterized by a decrease in the relative abundance of Nakaseomyces, Schizosaccharomyces pombe, Candida dubliniensis and an increase in the abundance of Lanchanceathermotolerans, Saccharomyces paradox, Parastagonospora nodorum and Myceliophthorathermophila. Reduced fungal – bacterial and fungal – fungal correlations as well as increased negative fungal-bacterial correlations were observed in the gut of obese subjects. Furthermore, the anti-obesity effect of fungus S. pombe was further validated using a mouse model. Supplementing high-fat diet-induced obese mice with the fungus for 12 weeks led to a significant reduction in body weight gain (p < 0.001), and an improvement in lipid and glucose metabolism compared to mice without intervention. In conclusion, the gut mycobiome composition and functionalities of obese subjects were altered. These data shed light on the potential of utilizing fungus-based therapeutics for the treatment of obesity. S. pombe may serve as a potential fungal probiotic in the prevention of diet-induced obesity and future human trials are needed.
Introduction
The prevalence of obesity has been increasing worldwide,Citation1–3 and varies by region and country.Citation4 Obesity may cause, exacerbate, or adversely impact numerous medical comorbidities, including diabetes mellitus, cardiovascular disease, and musculoskeletal disorders, thereby imposing a serious threat to public health and paving a heavy burden on society.Citation5–7 The trend of obesity and overweight among Chinese children and adolescents has been dramatically increasing in recent years. It is predicted that China will rank number one among countries with more than one million obese children by 2030.Citation8 In China, a body mass index (BMI) ≥28 kg/m2 is defined as obesity, while a BMI ≥24 kg/m2 is defined as overweight.Citation9
Gut microbiota dysbiosis, which has been linked to obesity, is characterized by an altered Firmicutes/Bacteroidetes ratio and a higher level of Faecalibacterium in the gut of obese subjects.Citation10–12 Some gut microbiota, including the genera Lactobacillus and Bifidobacterium, exert anti-obesity effects which promote weight loss in obese humans and animals.Citation13–16 The gut fungal microbiome (mycobiome) has also been linked to metabolic disorders. Heisel, et al.Citation17 observed a change in the gut fungal composition and a reduction in the abundance of Saccharomyces cerevisiae in mice fed an obesogenic diet. Moreover, an association between metabolic disorders in obese humans and mycobiome dysbiosis in their gut has been reported, where phylum Ascomycota, class Saccharomycetes, family Dipodascaceae, and genus Candida were found to be increased compared with those in the gut of non-obese subjects.Citation18–20 Although these results indicate that the gut fungal composition of obese subjects is altered, the function and the role of fungi in obesity remain unclear.
Geography is another crucial contributor to substantial gut mycobiome variation across populations.Citation21 For example, the fecal mycobiome compositions of Japanese and Indian populations were found to be distinctly separate.Citation22 Indians, whose diets are rich in plant-derived carbohydrates, harbor a higher abundance of gut Candida than their Japanese counterparts. In addition, a large Chinese population-based mycobiome study conducted by us highlighted the existence of regional differences in gut mycobiome configuration, particularly of Hong Kong (HK) and Yunnan subjects.Citation21 However, whether the above mycobiome variations across regions impact obesity or the manner in which such an impact is exerted remains unknown. We hypothesized that the gut mycobiome differs between obese and lean subjects and is region dependent. Thus, in this study, we aimed to delineate the gut mycobiome and trophic modes of obese subjects in two geographically different regions of China and identify specific gut fungi associated with obesity. The anti-obesity effects of these fungi were further validated using a high-fat diet-induced obese mouse model.
Materials and methods
Data and code availability statement
All sequence files are available from the National Center for Biotechnology Information Bio-Projects (accession number PRJNA648796 and PRJNA648797). R Code is available on GitHub at https://github.com/mushroom-field-lab/Mycobiome-alterations-in-obesity/.
Participants
In total, 217 subjects from KM (n = 99) and HK (n = 118) were recruited for this study. All obese participants who provided informed consent were consecutively enrolled at bariatric clinics. Lean participants were recruited from the general population via advertisements. Inclusion criteria were as follows: age between 18 and 70 years; BMI of obese subjects ≥28 kg/m2 and 18.5 kg/m2 ≤ BMI of lean subjects ≤23 kg/m2. Exclusion criteria included were as follows: current severe gastrointestinal diseases, including inflammatory bowel diseases, cancer, advanced adenoma, and gastroenteritis; frequent symptoms of the digestive system, including hemafecia, diarrhea, abdominal pain, and vomiting; current rheumatic immune diseases, active infection, or acquired immunodeficiency syndrome; a known history of organ dysfunction or failure related to the cardiopulmonary, urinary, nervous, reproductive and circulatory systems; any known history of abdominal surgery, radiochemotherapy, immunotherapy, or current incurable cancers; recent antibiotic and antifungal medication use; and pregnant or planning a pregnancy within 1 year.
Sample collection
Ethical approval and written informed consent were obtained from all participants. The participants’ demographic information of participants (i.e., age, sex, BMI, lifestyle, disease, and medical history) was obtained via a face-to-face interviewer-administered questionnaire. Additionally, the participants received oral and written instructions regarding the stool collection procedure under non-fasting conditions. Stool collection kits for self-collection were provided to the participants, who were required to deliver at least 30 g of fresh stool at ambient temperature to the laboratory within 2 h of defecation. On arrival, samples were subsequently aliquoted and placed at −80°C. All stool samples from HK and KM were shipped overnight by special post to the Center for Microbiome Research (Shenzhen Research Institute, The Chinese University of Hong Kong, Shenzhen, China), where they were stored in −80°C freezers until needed for nucleic acid extraction. Ethical approval for this study was granted by The Joint Chinese University of Hong Kong, New Territories East Cluster Clinical Research Ethics Committee (No. 2014.026) and The Clinical Research Ethics Committee of Kunming Medical University (No. 2019L23).
DNA extraction and sequencing
DNA was extracted following the methods outlined by Zuo, et al.Citation23 with minor modifications. Fecal samples (100 mg) were prewashed with 1 mL of ddH2O and pelleted via centrifugation at 13,000×g for 1 min. The fecal pellet was resuspended in 800 μL TE buffer (pH 7.5), supplemented with 16 μL β-mercaptoethanol and 250 U lyticase (Sigma), and incubated at 37°C for 90 min. The sample was then centrifuged at 13,000×g for 3 min, and fecal DNA was subsequently extracted from the pellet using a Maxwell RSC PureFood GMO and Authentication Kit (Promega, Madison, Wisconsin, USA) following the manufacturer’s instructions. Subsequently, 800 mL of cetrimonium bromide (CTAB) buffer was added to the fecal pellet and vortexed for 30 s, following which the mixture was incubated at 95°C for 5 min. The samples were then vortexed thoroughly with 0.5 mm and 0.1 mm beads at 2,850 rpm for 15 min. Subsequently, 40 µL of proteinase K and 20 µL of RNase A were added into the sample, and the mixture was incubated at 70°C for 10 min. The supernatant was then obtained by centrifugation at 13,000×g for 5 min and transferred to a Maxwell RSC machine for DNA extraction. The extracted fecal DNA samples were taken to Novogene Co., Ltd. (Beijing, China) for 150 bp paired-end shotgun metagenomic sequencing on an Illumina NovaSeq 6000 platform (Illumina, San Diego, California, USA). In addition, we included a blank control group to assess the contamination by environmental fungi during the stool sample collection, DNA processing, and sequencing.
Sequence data processing and bioinformatics
Adaptor contamination and low-quality reads were discarded from the raw data using KneadData (https://huttenhower.sph.harvard.edu/kneaddata). After trimming, the KneadData integrated Bowtie2 tool was used to remove reads that aligned to the human genome (GRCh38 p12). The two paired-end reads were concatenated. This was followed by fungal composition profiling inferred from HumanMycobiomeScanCitation24 V.1.0. Bacterial taxonomic profiling was performed using the MetaPhlAn2 V.2.7.7 classifier with the V.2.0 database.Citation25
Microbiota community composition
α-diversity indices including observed species, Chao1, and Shannon diversity indices were calculated using R package Vegan V.2.5.6, and significance tests were performed with Student’s t-test. In the pre-processing of abundance tables, we applied a pseudo count of 1 with zCompositions R package V.1.4.1 and reframed the read count tables to compositional data with centered log-ratio (CLR) transformation using “clr” function from the R package scone V.1.6.1. Non‐metric multidimensional scaling (NMDS), based on Bray-Curtis distance of the relative abundance of species, was performed using the Vegan package V.2.5.6 with the “adnonis2” function. A permutational multivariate analysis of variance (PERMANOVA, 999 permutations) based on the Bray – Curtis distance matrix was used to determine the association between gut mycobiome composition and covariate, and the interaction effects of the covariates of gut mycobiome composition. PERMANOVA was tested in the R package Vegan V.2.5.6 with the function “adonis2” function. All p-values were corrected using the Benjamini – Hochberg procedure.
Linear discriminant analysis effect size (LEfSe) was used to identify the features most likely to explain the differences between obesity and leanness in both regions.Citation26 The threshold of the logarithmic discriminant analysis score for distinct features was set to 2.0. The relative abundances of the significantly differential species were plotted using the R package ggplot2 V.3.4.2. Comparisons between the relative abundances of species in the two groups were performed using Student’s t-test. The partial Spearman rank correlation test with Benjamini – Hochberg correction in the R package Hmisc V.3.4.2 was used to analyze the correlations between species and BMI. Heatmaps were generated using the R ComplexHeatmap package V.2.16.0. Fecal fungal trophic modes prediction and functional groups annotation were performed using the FUNGuild database,Citation27 and stacked bar charts were constructed using the R package ggplot2 V.3.4.2. All plots were constructed using the aforementioned packages, ggpubr, circlize, and RColorBrewer. All p-values were corrected using the Benjamini – Hochberg procedure. Single nucleotide polymorphisms (SNP)-based approach in StrainPhlAnCitation28 was used to analyze SNP haplotypes of the dominant strains in all metagenomic samples (after removing reads mapping to human reference). Maximum likelihood phylogenetic trees were constructed based on the sample-specific consensus sequences of species marker genes. A bootstrap with 1,000 replicates was used for statistical confidence of the branches, with the percentages shown next to the branches. The tree was visualized using ITOL (https://itol.embl.de/).
Microbial networks
Microbial correlations were explored by constructing co-occurrence networks. Sparse correlations for compositional data (SparCC) were applied to quantify the intra- and inter-kingdom relationships at the species level using Python and R (package plyr V.1.8.9). p-values less than or equal to 0.05 after multiple comparisons correction via the false discovery rate (FDR) method were considered significant, and significant microbial co-occurrence and co-exclusion relationships (R= SparCC correlation coefficients; |R| ≥ 0.1 and p ≤ 0.05) were visualized using Cytoscape V.3.7.2. Network-level topological features include the node number, edge number, node degree, clustering coefficient, and network density. Nodes, the units of a network representing a class or genus, are colored; edges are links between the nodes, and node degree represents the number of connections of a node to other nodes.Citation29 Network connectivity is defined by the clustering coefficient (the degree to which the nodes tend to cluster together), and edge density is calculated as the intensity of connections among the nodes. All features were calculated using the R package igraph V.0.3.1. Correlations between the α-diversity of fecal bacteria and fungi in obese subjects and lean controls were assessed according to a previous study,Citation30 Spearman’s correlations were determined with R package Hmisc V.3.4.2, and the adjusted p-values by FDR ≤ 0.05 were reported. Plots were generated using the R package Corrplot V.0.9.2.
Statistical analyses
All data were imported into R software (version 3.6.1) for statistical analysis. Continuous variables are represented by their means ± standard deviations or medians (interquartile range [IQR]). Categorical variables were expressed as counts and frequencies (percentages). Student’s t-test was used for numerical variables, while Chi-square or Fisher’s exact test was applied for categorical variables as deemed fit. Comparisons between groups were performed using two-tailed t-tests.
Animals
Strains Schizosaccharomyces pombe and Saccharomyces cerevisiae were obtained from the Global Bioresource Center (ATCC). The strains were cultured in a yeast and mold agar (YMA) medium containing yeast extract (0.3%), dextrose (1.0%), peptone (0.5%), and agar (2.0%) (pH, 6.2 ± 0.2). To prepare the inoculation, yeast was grown on the solid medium at 25°C for 48–72 h. A loopful of a single colony in the YMA medium was then transferred to tubes containing 10 mL of yeast and mold broth, followed by incubation at 25°C for 18 h with shaking at 300 rpm. The fungal cells were harvested by centrifugation (6000 rpm, 10 min, 4°C) and washed twice with phosphate buffered saline (PBS).
Twenty-nine 6–8-week-old C57BL/6J male mice (n = 4 or 5 per group) were obtained from the Laboratory Animal Services Center of The Chinese University of Hong Kong. All animals were housed in standard plastic cages (four or five mice per cage) under a 12 h light-dark cycle at constant temperature and humidity (23 ± 1°C and 55 ± 5%, respectively) with free access to food and water. After acclimatization for 1 week, the mice were randomly divided into high-fat diet (HFD) and normal diet (ND) groups. Mice in the ND (control) group were fed a normal diet (Labdiet Picolab Select Mouse diet 50 IF/9F Irradiated, containing 18.0% protein, 8.0% fat and 5.0% fiber by weight; P.O. BOX 19,788, BRENTWOOD, MO 63,144). Mice in the HFD group were fed a high-sucrose cholesterol diet (SF11–078, 23.0% fat, 42.4% sucrose, and 19.4% protein by weight; Specialty Feeds, Perth, Australia). Mice in the ND and HFD groups were further divided into three groups (n = 4–5 per group). For each group, freshly prepared 0.2 mL of PBS, 0.2 mL of PBS containing S. cerevisiae (ATCC 36,375, 1 × 10⁷ CFU/mouse), or 0.2 mL of PBS containing S. pombe (ATCC 16,979, 1 × 10⁷ CFU/mouse) were intragastrically administered to the mice every weekday, and their body weights were measured weekly. All animal experiments were approved and conducted in compliance with the guidelines of the Animal Experimentation Ethics Committee (AEEC) of The Chinese University of Hong Kong.
Oral glucose tolerance test (OGTT) and insulin tolerance test (ITT)
Glucose tolerance was evaluated ten weeks after treatment using a standard OGTT. After 14 h of fasting, a 20% (w/v) glucose solution was administered to mice at a dose of 1 g/kg body weight via oral gavage. Blood samples were collected from a tail cut (by removing the distal 2 mm of the tail) before (0) and 15, 30, 60, and 90 min after administration, following which blood glucose levels were analyzed using a handheld glucometer (Sannuo; Changsha Sinocare, Inc., Changsha, China). The ITT was performed a week later. Diluted regular human insulin (Sigma-Aldrich) was injected intraperitoneally into mice at a dose of 0.75 units/kg body weight under non-fasting conditions. After insulin injection, blood glucose levels were measured as described above. At the end of the 12-week treatment period, blood was collected, and the mice were euthanized via cervical dislocation. The liver and adipose tissues (subcutaneous, epididymal, and perirenal) were precisely dissected and weighed. The liver index as well as adipose indices were calculated as liver weight and total adipose weight, respectively, divided by body weight. All animal experiments were approved and performed in compliance with the guidelines of the AEEC of The Chinese University of Hong Kong.
Biochemical analysis
Blood samples were collected and isolated via centrifugation at 1,500 rpm at 4°C for 10 min. Serum total cholesterol (TC), total triglyceride (TG), high-density lipoprotein cholesterol (HDL-C), and low-density lipoprotein cholesterol (LDL-C) levels were measured using commercial enzymatic kits purchased from the Nanjing Jiancheng Bioengineering Institute (Nanjing, China), according to the manufacturer’s instructions.
Statistical analyses of animal experiments
The results are presented as the mean ± standard error of the mean (SEM). One-way analysis of variance (ANOVA) with post hoc Tukey’s multiple-comparison test was used for the single-factor experiments involving six groups. Two-way repeated-measures ANOVA with post hoc Tukey’s multiple-comparison test was used to analyze body weight changes in mice at multiple time points. Adjusted p-values by Benjamin-Hochberg FDR ≤0.05 were reported and all statistical analyses were performed using GraphPad Prism 9.5.1 software (GraphPad Inc., San Diego, CA). Significance levels are indicated as *p ≤ 0.05, **p ≤ 0.01, and ***p ≤ 0.001.
Results
Clinical characteristics of study subjects
A total of 217 subjects were included in the study, 118 were recruited from HK (59 lean and 59 obese) and 99 from KM (49 lean and 50 obese). The median ages of the lean and obese subjects in the HK cohort were 45.88 and 47.85 years, respectively, whereas those of lean and obese subjects in the KM cohort were 48.14 and 40.56 years, respectively. The clinical and analytical characteristics of the subjects are shown in .
Table 1. Characteristics of study subjects. c: BMI, body mass index.
Variation in the gut mycobiome composition of lean and obese subjects across regions
For 217 fecal metagenomes, a total of 85 species-level fungal operational taxonomic units (OTUs) were identified across all samples, and an average of 60 ± 7.4 million clean paired-end reads per sample were obtained. Ascomycota was the predominant phylum in both HK and KM groups, with average relative abundances of 80.12% and 75.13%, respectively, followed by Basidiomycota with average relative abundances of 17.57% and 23.90% for the HK and KM group, respectively. At the genus level, Saccharomyces was the most abundant fungus, accounting for 48.53% in HK and 34.85 in KM (). Next, we assessed the clinical variables (region, sex, alcohol intake, obesity, smoking, T2DM, age, and medication use) to identify host factors significantly associated with gut mycobiome variation (; Supplementary Table S1). Gut mycobiome composition was significantly differentiated by region (effect size R2 = 0.015, p < 0.001) and obesity (effect size R2 = 0.010, p < 0.05). Moreover, a combined interactive effect of obesity and region on the gut mycobiome was observed (R2 = 0.026, p < 0.01). NMDS of the fungal species-level community indicated that KM subjects (yellow dots) clustered separately from HK subjects (blue dots), thereby reinforcing our finding that the regions contribute to gut mycobiome variation (PERMANOVA test, p < 0.001; Supplementary Figure S1). To exclude the impact of regional effects on the fecal mycobiome, we used PERMANOVA to test the contribution of the variables to mycobiome variation in each region separately (Supplementary Table S2). Results for the HK cohort indicated that T2DM (R2 = 0.013, p = 0.101), medication use (R2 = 0.015, p = 0.060), and smoking (R2 = 0.024, p = 0.139) did not exert a significant effect on gut mycobiome compositional variation. In contrast, obesity did exert a distinct effect (R2 = 0.015, p < 0.05) was independent of T2DM, medication use, and smoking. Similarly in the KM cohort, the effects exerted by T2DM (R2 = 0.016, p = 0.193), age (R2 = 0.007, p = 0.977), and sex (R2 = 0.013, p = 0.412) on the gut mycobiome compositional variation were insignificant, and thus, the effect exerted by obesity (R2 = 0.010, p = 0.050) on the gut mycobiome was independent of these variables. These results suggest that T2DM, medication use, smoking, age, and sex are unlikely to account for the differences in mycobiome composition.
Figure 1. Fecal fungal community structure in Hong Kong and Kunming cohorts. (A) Variations in gut mycobiome composition at genus level in association with obesity across two regions. (B) The effect size of covariables on human gut mycobiome variation. *p < 0.05, ***p < 0.001. (C–E) Variations in the α-diversity of human gut mycobiome in association with obesity across two regions. Fecal fungal Shannon diversity (C) evenness (D) and Chao1 richness (E). HK, Hong Kong; KM, Kunming. Statistical significance was determined via t-tests; bars with numbers indicate statistical differences.
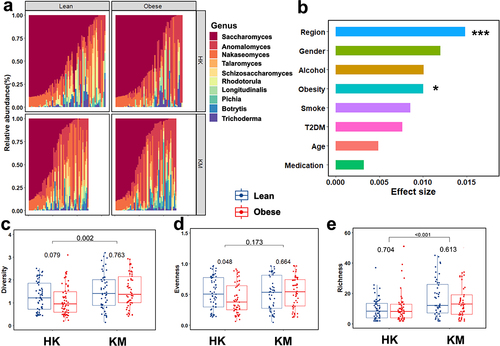
Obesity is associated with lower gut microbiome diversity.Citation31,Citation32 We therefore evaluated the fecal fungal diversity between regions as well as between obese and lean subjects. Fecal mycobiome Shannon diversity and Chao1 richness were significantly higher in KM subjects than those in HK subjects (p < 0.01 and p < 0.001, ). Furthermore, in regard to the effects of obesity, a lower fecal fungal evenness (p < 0.05, ) and Shannon diversity were observed in obese subjects compared to lean subjects in the HK cohort. A more homogeneous fecal fungal composition was observed between lean and obese subjects in the KM cohorts (p = 0.763 in Shannon diversity; p = 0.664 in evenness; p = 0.613 in Chao1 richness; respectively, ). In addition, we examined the impact of covariates, such as medication use, T2DM, and smoking, by assessing the fungal Shannon diversity of these covariates in the subgroups. The results indicated that the differences in diversity across subgroups according to the medication history (beta-blockers, non-steroidal anti-inflammatory drugs [NSAIDs], proton-pump inhibitors [PPIs], statins, and sulfonylureas [Sus]), T2DM, and smoking status (Supplementary Figure S2) were insignificant. These results suggested that changes in fecal mycobiome diversity and composition are likely driven by obesity.
Differential fecal fungal taxa between lean and obese subjects across regions
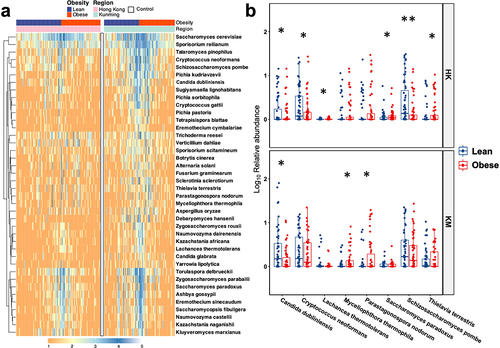
S. cerevisiae was the most abundant fungal species in the feces, contributing 48.53% and 34.85% of the gut mycobiota in HK and KM groups, respectively, followed by Sporisorium reilianum, which accounted for 13.79% and 19.48% of the gut mycobiota of HK and KM groups, respectively (). To further investigate the differences in fungal taxa between regions as well as between lean and obese subjects, we conducted LefSE analysis to identify differential fungal taxa. Each study group was characterized by different fungal taxa. In the HK cohort, the families Schizosaccharomycetaceae and Sporidiobolaceae as well as the genera Schizosaccharomyces and Rhodotorula distinguished lean subjects from obese subjects, with their corresponding relative abundances in obese subjects being 77.40%, 48.53%, 81.91%, and 76.09% lower than those in lean controls subjects, respectively (Supplementary Figure S3A). In the KM cohort, the genus Dematiopleospora was more prevalent in the obese groups than in the lean controls. A reduction in the abundance of genus Nakaseomyces was observed in the feces of the obese groups in both HK (obese vs. lean; 11.49% vs. 15.17%) and KM (11.81% vs. 20.35%) regions (Supplementary Figure S3a, b). At the species level, a depletion of Candida dubliniensis was observed in the feces of obese subjects in both groups (). Furthermore, compared with lean subjects, the relative abundances of Cryptococcus neoformans and S. pombe in the feces of obese subjects in HK were lower while the abundance of Lachancea thermotolerans, Saccharomyces paradox, and Thielavia terrestris were significantly higher. Parastagonospora nodorum and Myceliophthora thermophila were associated with obese subjects in the KM group ().
Figure 2. Variations in gut mycobiome composition (a) and differences between the relative abundances of major fungal taxa (b) at the species level in association with obesity in Hong Kong and Kunming cohorts. Only dominant fungal species (mean relative abundance ≥1.0%) are presented. Control indicates blank group for assessing environmental contamination during sample collection and processing. Log transformation of relative abundance is shown in the boxplot. HK, Hong Kong; KM, Kunming. Statistical significance was determined by t-test with FDR correction; *p<0.05, **p<0.01.
Prediction of fecal fungal trophic modes and functional groups in lean and obese subjects across regions
To further explore the function of the gut mycobiome, we predicted fecal mycobiome trophic modes and ecological guild for the respective regions (). According to the classification based on nutrient substrate preferences, the fungi were divided into 12 guilds (dung saprotrophs, wood saprotrophs, soil saprotrophs, animal pathogens, plant pathogens, epiphytes, endophytes, animal endosymbionts, fungal parasites, plant saprotrophs, undefined saprotrophs, and pathotrophs) and three trophic modes (pathotrophs, saprotrophs and symbiotrophs) (). Most detected fungi in the fecal mycobiome were saprotrophic, contributing over 79% of the community, with the taxon Saccharomycetales being predominant.
Figure 3. Putative fungal functional profiles in the fecal samples of lean and obese subjects from Hong Kong and Kunming cohorts. (a) Pie chart of the 12 guilds in the fecal samples. Lean in HK, lean subjects in Hong Kong; obesity in HK, obese subjects in Hong Kong; lean in KM, lean subjects in Kunming; obese in KM, obese subjects in Kunming. (b-e) relative abundance of animal endosymbiotic (b), epiphytic (c), plant pathogenic (d), plant saprotrophic (e) fungi in the fecal samples. All data are presented as the mean ± SEM. Bars with numbers indicate statistical differences, p-values are from t-test.
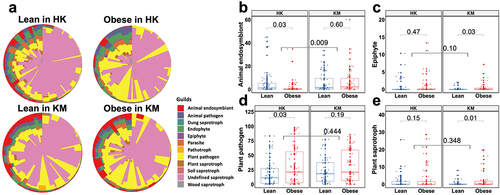
Fungal function varied largely across geographic regions (). The abundance of animal endosymbiotic fungi (p < 0.01) in KM subjects was 74.22% higher than that in HK subjects, whereas animal pathogenic (6.67% vs 3.87%; p < 0.05), endophytic (9.46% vs 5.10%; p < 0.01), parasitic (5.66% vs 2.59%; p < 0.05), soil saprotrophic (1.26% vs 0.20%; p < 0.05), and wood saprotrophic (4.30% vs 1.06%; p < 0.01) fungi were more abundant in the fecal samples of HK subjects compared with those in the fecal samples of KM subjects, respectively (). The trophic mode of the fecal mycobiome showed a marked region-specific association with obesity. A lower abundance of animal endosymbiotic fungi (p < 0.05) and a higher abundance of plant pathogenic fungi (p < 0.05) were found in the feces of the obese group (6.02% and 21.28%, respectively) in HK than in those of the lean group (7.33% and 17.01%, respectively; ). Epiphytic (0.60%) and plant saprotrophic (2.43%) fungi were relatively more abundant in the feces of the obese group than in those of the lean group in KM, as indicated by the substantially higher relative abundances of approximately 74.48% (p < 0.05) and 79.24% (p = 0.01), respectively (). These data imply that region and obesity have a combined effect on the functional landscape of gut fungi.
Fungal – fungal intra-kingdom co-occurrence networks in the fecal mycobiome of obesity across regions
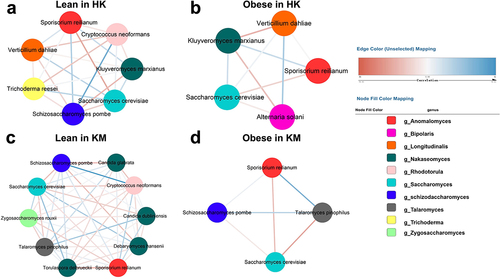
We performed a co-occurrence network analysis to study the effect of obesity on fungal-fungal interactions (). In the host gut, predominant fungi compete with one another for niches, nutrients, or oxygen, as shown by the antagonistic relationships between the two most abundant species S. cerevisiae and S. reilianum (: r2=-0.18; b: r2=-0.10; c: r2=-0.15; d: r2=-0.13). The intra-kingdom correlations observed in the fecal mycobiome of the lean groups of HK and KM cohorts () were more intricate than those in their obese groups (). The robust correlation observed between S. pombe and C. neoformans in the lean groups (r2 = 0.26 in HK, r2 = 0.33 in KM; ) was not evident in the obese groups. The fungal – fungal co-occurrence networks between the lean and obese groups were also region dependent. Plant-based food-derived Verticillium dahliae and Alternaria solani, both of which were unique to the HK cohort and were tightly associated (r2=-0.15 and r2=-0.13, respectively) with Kluyveromyces marxianus in the obese group (). However, KM subjects were specifically made distinguishable from the HK subjects by the presence of Talaromyces pinophilus, which was positively associated with C. dubliniensis (r2 = 0.16) and C. glabrata (r2 = 0.10) in the feces of lean subjects, whereas such symbiotic or synergistic relationships were absent in the gut of obese subjects (). Overall, a healthy gut mycobiome ecological network is characterized by a more complex gut fungal – fungal co-occurrence network, where diverse fungal species compete or cooperate with each other in the host. However, in obese subjects, the ecological network became much sparser, possibly due to the reduced fungal evenness ().
Figure 4. Intra-kingdom co-occurrence networks between fungal taxa in the feces of lean and obese subjects from Hong Kong and Kunming cohorts. (a) Lean in HK; lean group from Hong Kong cohorts; (b) obese in HK; obese group from Hong Kong cohorts; (c) lean in KM; lean group from Kunming cohorts; (d) obese in KM; obese group from Kunming cohorts. Colored nodes represent operational taxonomic units (OTUs) assigned to major genera. Edges between nodes stands for either positive (blue) or negative (red) co-abundance relationships inferred from OTU abundance profiles using the SparCC method (pseudo p<0.05, correlation value ≤−0.1 or ≥0.1).
Fungal – bacterial inter-kingdom co-occurrence networks in the fecal mycobiome of obesity across regions
We further explored possible relationships between fecal fungi and bacteria, by investigating correlations between the α diversities (Shannon diversity, evenness, and Chao1 richness) of the mycobiome and bacteriome of obese subjects and lean controls. Strong positive correlations were observed between the intra-kingdom α diversity metrics of lean control (), whereas correlations between fungal and bacterial diversity in the obese groups were either absent or negative (). In HK, gut mycobiome evenness of lean subjects was positively correlated with their bacteriome Shannon diversity and evenness (, r = 0.19 and r = 0.13), whereas these correlations in the obese group were found to be negative (, r = −0.04 and r = −0.06). These results were indicative of an altered fungal – bacterial correlation in obese subjects compared to that in lean controls.
Figure 5. Correlations between α diversity (Shannon diversity, evenness, and Chao1 richness) of fecal bacteria and fungi in lean and obese subjects from Hong Kong and Kunming cohorts. (a) Lean in HK; lean group from Hong Kong cohorts; (b) obese in HK; obese group from Hong Kong cohorts; (c) Lean in KM; Lean group from Kunming cohorts; (d) obesity in KM; obese group from Kunming cohorts. The asterisks inside circles indicate significant associations between mycobiome and bacteriome; *p<0.05, **p<0.01, ***p<0.001; their significance was corrected with FDR adjustment. Blue circles indicate positive correlations, and red circles indicate inverse correlations; color and size are intensified according to the correlation coefficient.
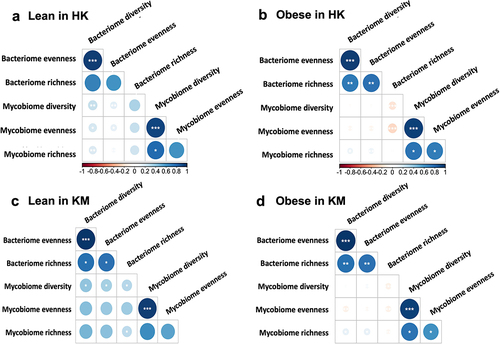
Such altered co-occurrence interactions of bacteria and fungi in the obese were also demonstrated at the species level. A difference in the average node degree and network complexity between lean and obese groups was observed (Supplementary Figure S4; Supplementary Table S3, 4). The nodes represent either bacteria or fungi. In the KM cohort, the density of the fungal – bacterial network in the fecal samples of obese subjects was lower, as indicated by fewer node degrees (p < 0.05) and decreased edge density, compared to that of lean subjects. In particular, a markedly increased number of negative correlations were observed between the fungi and bacteria of obese subjects when compared with those of lean subjects (Supplementary Table S3; HK, p < 0.05; KM, p < 0.01). For instance, Sporisorium scitamineum showed a negative correlation with the gram-negative bacterium, Megamonas hypermegale, in obese subjects from HK (R2=-0.18) and KM (R2=-0.11). Aspergillus oryzae showed a significant negative correlation with the Akkermansia muciniphila in obese subjects of HK (R2=-0.40) and KM (R2=-0.39) but not in the lean groups. Overall, fungal – bacterial inter-kingdom ecological correlations in the fecal samples of obese groups were weaker and less pronounced than those of lean controls in both regions, suggesting that obesity may be associated with an alteration in the fungal – bacterial networks. A tight and synergetic association between the fungal-bacterial inter-kingdom appears to help maintain an ecologically healthy gut microbiota network in lean subjects, as opposed to that in obese subjects.
The anti-obesity effect of schizosaccharomyces pombe in diet-induced obese mice
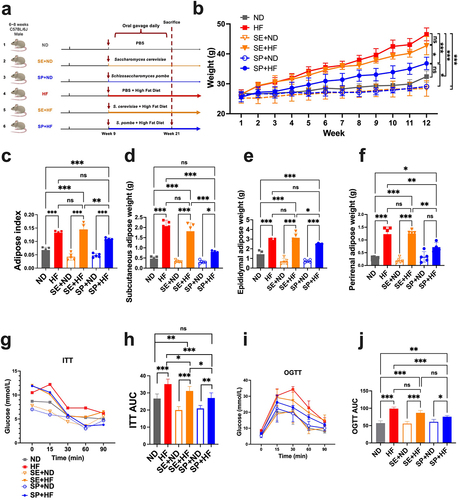
Several species were identified to distinguish obesity subjects from lean controls (Supplementary Figure S5A,B). Among these, C. dubliniensis, C. neoformans, and S. pombe were significantly associated with a lower BMI (r = −0.22, r = −0.17, and r = −0.19, Supplementary Figure S5C). S. pombe (59.91%) showed a higher prevalence than C. dubliniensis (35.16%) and C. neoformans (58.99%). Moreover, it was reported that the metabolite compositions of human blood and S. pombe are similar (up to 75%),Citation33 and S. pombe possesses several metabolic properties that are widely used in winemaking. S. pombe was chosen for further exploration of its anti-obesity effects using an animal model. Mice were fed a high-fat diet from the ninth week of age. Simultaneously, S. pombe was gavaged into the mice every weekday for intervention (). After 12 weeks of feeding, the mice treated with S. pombe showed a significantly slower body weight gain under a high-fat diet regimen than either mice without fungus intervention (p < 0.001) or with S. cerevisiae administration (, Supplementary Table S5, p < 0.05). A 12-week HF increased mouse adipose weight (p < 0.001), liver tissue weight (p < 0.01), insulin resistance (p < 0.001), and glucose intolerance (p < 0.001), while decreasing HDL-C (p < 0.001) and increasing LDL-C (p < 0.01) in the serum, which disrupted lipid metabolism (, Supplementary Figure S6, and Supplementary Table S5). Administering S. pombe significantly suppressed the increase in liver mass index (p < 0.001), and reduced subcutaneous (p < 0.001) and perirenal (p < 0.01) adipose weight, while improving insulin sensitivity (p < 0.001) and glucose tolerance (p < 0.001) in mice fed a HFD ( and Supplementary Figure S6A). In addition, S. pombe markedly reversed these abnormalities by improving the serum levels of HDL-C (p < 0.05) and reducing the serum levels of LDL-C (p < 0.001, Supplementary Figure S6B,C). Overall, our results indicated that S. pombe can considerably counteract high-fat diet-induced obesity, paving the way for further exploration of the role of S. pombe in human weight management.
Figure 6. Effects of S. pombe on obesity and serological parameters. (a) Schematic diagram, (b) body weight gain; (c-f) adipose change, adiposity index (c), subcutaneous adipose tissue weight (d), epididymal adipose tissue weight (e), perirenal adipose weight (f); (G-J) glucose metabolism changes, insulin tolerance test (ITT) (g), area under curve (AUC) of ITT (h), oral glucose tolerance test (OGTT) (i), AUC of OGTT (J). Data are shown as means ± SEM. p-values were corrected with FDR; *p<0.05, **p<0.01, ***p<0.001, ns indicates no significant difference. ND (n=5): group fed with normal diet; HF (n=5): group fed with high-fat diet; SE+ND (n=5): normal diet group treated with Saccharomyces cerevisiae; SE+HF (n=4): high-fat diet group treated with S. cerevisiae; SP+ND (n=5): normal diet group treated with S. pombe; SP+HF (n=5): high-fat diet group treated with S. pombe.
Discussion
In this study, we characterized and compared the fecal fungal compositions of obese and lean subjects of HK and KM, two main cities in China that differ greatly in diet, as well as in the type of environment, and degree of urbanization. Previous studies have reported that geography and obesity contribute to the composition of gut mycobiome.Citation19,Citation34,Citation35 Our results showed the combined impact of geographic region and obesity on mycobiome compositions and trophic mode types in the gut. Additionally, we observed that the gut environments of obese subjects across these two regions were disordered with altered inter- and intra-kingdom relationships.
Fecal fungal composition is markedly affected by obesity. Similar to the results of a previous study,Citation19 our results indicated that fungal diversity in the guts of obese subjects from the HK cohort was relatively low. However, unlike the results of other studies that reported increased levels of Paecilomyces, Penicillium, Candida, Aspergillus, Mucor, and Pichia in the guts of obese subjects,Citation18,Citation19 We separately identified higher levels of Dematiopleospora (KM) and lower levels of Nakaseomyces, Rhodotorula, and Schizosaccharomyces (HK) in the guts of obese subjects. Such inconsistencies may be attributed to variations in study populations, diets, lifestyles, and geography.Citation22
Unlike bacteria, fungi are relatively less abundant in the gut, but commonly found in various foods and environments, thereby raising a concern as to whether these fungi were true gut residents or environmental transients. Therefore, we investigated and compared the phylogenetic structure of the fungal strains identified in our cohort and the strains isolated from the environment and humans. S. cerevisiae was the predominant fungus in our cohorts, and we compared it with 12 isolated strains (eight of environmental origin, and four of human origin, Supplementary Table S6).Citation36–38 The phylogenetic tree revealed three distinct clades ⍺, β and γ (Supplementary Figure S7), which roughly corresponded to an environmental origin, and a human origin in different regions, respectively. Strains of clinical origins branched separately from those of nonclinical origins (fruits, soils, and farms), suggesting that the β and γ clades constituted a human-adapted subspecies. Differences between the β and γ evolutionary clades of S. cerevisiae, which are adapted to living in the human body, may be associated with geographical location. Besides, evolutionary differences between strains of human origins and non-human origins were also observed in another prevalent fungus, C. neoformans, as seen in clades δ and ε (Supplementary Figure S8). Overall, these results provide evidence that the gut fungi identified in this study were evolutionarily different from those isolated from the environment but similar to human isolates that were more likely to be true gut colonizers. S. cerevisiae has also been reported in previous obesity studies,Citation17,Citation39,Citation40 and thus we administrated S. cerevisiae to assess its anti-obesity effects. However, the fungus did not prevent body weight gain or lower adipose index in mouse HFD models (). Therefore, the presence of S. cerevisiae in the gut may not be associated with obesity.
Geography is another crucial factor influencing gut mycobiome composition concerning obesity.Citation41–43 KM is the main wheat-breeding and growing region in China.Citation44 In KM, the abundance of P. nodorum, a prevalent wheat pathogen,Citation45 in the feces of obese subjects was statistically higher compared to that of lean subjects (, p < 0.05). This is possibly ascribed to a higher intake of wheat (carbohydrates) by obese subjects or a weaker metabolic ability to process wheat on their part, leading to an increase in the abundance of P. nodorum in the gut. The Yunnan Province is home to a wide diversity of wild edible mushrooms. According to previous studies, people living in KM belong to various ethnic groups who prefer to eat wild edible mushrooms, insects, and flowers.Citation46 This is consistent with our findings that animal endosymbiotic fungi were substantially increased in the gut of KM subjects (, p < 0.01) compared to that of HK subjects. The most well-known animal endosymbionts are insect endosymbionts,Citation47 which belong to the genera Pichia and Saccharomyces.Citation48 These endosymbiotic fungi produce enzymes, such as hydrolase and glucosidase, that facilitate the degradation of substances in the gut,Citation49,Citation50 thereby digesting energy from food as well as facilitating the regulation of host weight. These findings substantiate our findings that animal endosymbiotic fungi were depleted in the feces of obese subjects in the HK cohort, compared with those in the feces of lean controls (). In addition, endophytic fungi, such as Fusarium solani and Cryptococcus sp., are capable of growing in association with mushrooms,Citation51 and notably, a higher relative abundance of the genus Cryptococcus (Supplementary Figure S3C, p < 0.05) was observed in the fecal sample of KM cohort. This suggests that the consumption of wild foods may influence the gut mycobiome structure by introducing endophytic fungi. Ingestion of Zygosaccharomyces and Pichia is known to be associated with the consumption of fermented or decaying fruits,Citation52,Citation53 their levels in the guts of obese subjects in the KM cohort were found to be higher than those in the HK cohort (Supplementary Figure S3C).Citation54–56 In contrast, a decreased proportion of the bacterial genus Bacteroide,Citation57 known to be associated with high protein and fat consumption, were identified in the gut of obese subjects in the KM cohort than those in the HK cohort. This evidence implied that the gut mycobiome structures of lean and obese subjects are different and region-dependent. Disparity in the dietary regimens between these two cohorts may play an important role in shaping the differences in the structure and function of their gut mycobiome.
In a healthy gut, comprehensive fungal-to-fungal and fungal-to-bacterial interactions are maintained systematically and tightly.Citation58,Citation59 Such associations could be antagonistic, synergistic, commensal, or symbiotic. A HFD reportedly leads to a distinct reduction in gut fungal-fungal and fungal-bacterial co-abundance in obese mice.Citation40 Consistently less intra- and inter-kingdom cooccurrence network densities, as well as more negative fungal – bacterial relationships were found in obese humans in our study. A decreased co-occurrence of members of microbial communities might suggest a less stable and complex microbiome, which is less resilient to environmental stresses.Citation60 Gut fungi inhibit multiple genera of gut bacteria, and such increased inverse correlations between bacterial and fungal loads have been observed in the gut of preterm infants, in which this antagonistic relationship could further influence gut microbiome assembly during infant development.Citation61 The evidence indicates that an increase in the negative associations between fungi and bacteria in obese subjects leads to a more competitive, unstable environment as well as a weaker microbial diversity-function relationship.Citation62 Moreover, a positive correlation between C. neoformans and S. pombe was observed in the lean group of both the HK and KM cohorts. S. pombe was found to alleviate diet-induced obesity in our study, whereas C. neoformans is known to produce prostaglandins E2,Citation63 which stimulates leptin release in explants of subcutaneous adipose tissue from obese humans.Citation64,Citation65 Thus, the close correlation between C. neoformans and S. pombe observed in this study may play a vital role in providing protection against obesity. However, the associations require further investigation.
Our study is the first to report a correlation between Schizosaccharomyces and metabolic diseases. The fungal species S. pombe was identified, and its ability to regulate metabolic disorders in a mouse model was demonstrated. S. pombe is present in food, particularly wine, beverages, and fruits, and is commonly used in winemaking to improve flavor and other sensory properties of products.Citation66 In our study, we determined that S. pombe was more abundant in lean subjects than in obese subjects, and it reduced body weight gain and reversed metabolic abnormalities caused by an HFD in a murine model. S. pombe has the capacity for the autolytic release of polysaccharides from their cell wallCitation67 and exhibits strong fermentation abilities for acetic and pyruvic acid production as well as malic acid degradation.Citation68 All the evidence implies that S. pombe may regulate body weight by breaking down fat in consumed food or influencing energy absorption in the gut.Citation69 The absence of statistical differences in serum TC and TG concentrations among groups, may be ascribed to the fact that short-term exposure to a HFD does not always lead to serum TC and TG levels change.Citation70 In summation, the dietary effects of S. pombe indicate that it could be developed as a probiotic to adjust a person’s fungal microbiome. Thus, S. pombe shows potential as a therapeutic agent that may be aimed at weight management.
Strengths and limitations
The main strengths of this study include the access to rich metadata of two varied cohorts in the Asian population and our ability to assess the functional capacity of fungi. The main limitation of our study was the absence of information regarding the dietary habits of the subjects, which limited our ability to directly evaluate the association between diet and the gut mycobiome under the impacts of region and obesity. In addition, compared with that of bacteria, the results of fungal taxonomic identification and functional inference generated from shotgun metagenomic sequencing were limited, owing to the database, and low-abundance fungi may have been compromised by the sequencing depth. Third, the presence of fungi in a stool sample does not necessarily indicate that they were colonized in the gut; it is difficult to discriminate between true gut residents and transients introduced via food or the environment.Citation71 Lastly, the small sample size of the mouse study and the lack of experiments designed to determine the mechanisms underlying the role of S. pombe limited our ability to translate our scientific findings from bench to bedside.
Conclusions
We assessed the gut mycobiome of lean and obese subjects from two different regions in China (Hong Kong and Kunming), and the results showed that the gut mycobiome is altered in obesity and is region dependent. Decreased fungal – fungal and fungal – bacterial microbiome associations and increased negative fungal – bacterial correlations were also observed in the gut of obese subjects. In addition, the fungus, S. pombe, exhibited a remarkable ability to alleviate obesity in mouse models and thus shows potential as a probiotic strain.
Authors’ contributions
H.Z. devised the study, performed data analysis, and drafted the manuscript. Y.T.W. revised the figures and manuscript. Y.S. conducted subject recruitment and collected clinical samples and data in Kunming. F.Z., Y.T.W. and C.P.C. assisted in data analysis, DNA extraction. F.Z., and W.Z. helped with animal work. Z.X. and Y.T.W. assisted with DNA extraction and manuscript revision. W.T. assisted with sample collection and questionnaire investigation. E.K.W.N., S.K.H. W., Y.K.Y. and F.K.L.C. provided significant intellectual contributions to the manuscript. T.Z., Z.Z. and S.C.N. supervised the study and revised the manuscript.
Ethics approval
This study was approved by The Joint Chinese University of Hong Kong – New Territories East Cluster Clinical Research Ethics Committee (No: 2014.026) and The Clinical Research Ethics Committee of Kunming Medical University (No: 2019L23). Ethical approval and written informed consent were obtained from all study subjects. All the animal experiments were approved by the Animal Experimentation Ethics Committee of The Chinese University of Hong Kong.
Consent for publication
Written informed consent for publication of this paper was obtained from all authors.
Supplemental Material
Download Zip (10.5 MB)Acknowledgments
Authors affiliated with MagIC are partially supported by InnoHK, The Government of Hong Kong, Special Administrative Region of the People’s Republic of China. S.C.N. received funding support from The New Cornerstone Investigator Program initiated by Tencent.
Disclosure statement
FKLC is Board Member of CUHK Medical Centre. He is a co-founder, non-executive Board Chairman, non-executive scientific advisor, honorary Chief Medical Officer and shareholder of GenieBiome Ltd. He receives patent royalties through his affiliated institutions. He has received fees as an advisor and honoraria as a speaker for Eisai Co. Ltd., AstraZeneca, Pfizer Inc., Takeda Pharmaceutical Co., and Takeda (China) Holdings Co. Ltd.
SCN has served as an advisory board member for Pfizer, Ferring, Janssen, and AbbVie and received honoraria as a speaker for Ferring, Tillotts, Menarini, Janssen, Abbvie, and Takeda. SCN has received research grants through her affiliated institutions from Olympus, Ferring, and AbbVie. SCN is a founder member, non-executive director, non-executive scientific advisor, and shareholder of GenieBiome Ltd. SCN receives patent royalties through her affiliated institutions.
HZ, YW, ZX, FZ, WZ, WT, YKY, FKLC, TZ and SCN are named inventors of patent applications held by the CUHK and MagIC that cover the therapeutic and diagnostic use of microbiome.
Supplementary material
Supplemental data for this article can be accessed online at https://doi.org/10.1080/19490976.2024.2367297
Additional information
Funding
References
- Chooi YC, Ding C, Magkos F. The epidemiology of obesity. Metabol. 2019;92:6–19. doi:10.1016/j.metabol.2018.09.005.
- Blüher M. Obesity: global epidemiology and pathogenesis. Nat Rev Endocrinol. 2019;15(5):288–298. doi:10.1038/s41574-019-0176-8.
- Hales CM, Carroll MD, Fryar CD. Prevalence of obesity and severe obesity among adults: United States, 2017–2018. NCHS data brief. 2020;360:1–8.
- Ng M, Fleming T, Robinson M, Thomson B, Graetz N, Margono C, Mullany EC, Biryukov S, Abbafati C, Abera SF, et al. Global, regional, and national prevalence of overweight and obesity in children and adults during 1980–2013: a systematic analysis for the global burden of disease study 2013. Lancet. 2014;384(9945):766–781. doi:10.1016/S0140-6736(14)60460-8.
- Komaroff AL. The microbiome and risk for obesity and diabetes. JAMA. 2017;317(4):355–356. doi:10.1001/jama.2016.20099.
- Riaz H, Khan MS, Siddiqi TJ, Usman MS, Shah N, Goyal A, Khan SS, Mookadam F, Krasuski RA, Ahmed H, et al. Association between obesity and cardiovascular outcomes: a systematic review and meta-analysis of Mendelian randomization studies. JAMA Netw Open. 2018;1(7):e183788–e88. doi:10.1001/jamanetworkopen.2018.3788.
- Lauby-Secretan B, Scoccianti C, Loomis D, Grosse Y, Bianchini F, Straif K. Body fatness and cancer—viewpoint of the IARC working group. N Engl J Med. 2016;375(8):794–798. doi:10.1056/NEJMsr1606602.
- Lobstein T. Atlas of childhood obesity. 2022. https://www.worldobesityday.org/assets/downloads/World_Obesity_Atlas_2022_WEB.pdf.
- He W, Li Q, Yang M, Jiao J, Ma X, Zhou Y, Song A, Heymsfield SB, Zhang S, Zhu S, et al. Lower BMI cutoffs to define overweight and obesity in China. Obesity. 2015;23(3):684–691. doi:10.1002/oby.20995.
- Ismail NA, Ragab SH, Abd ElBaky A, Shoeib ARS, Alhosary Y, Fekry D. Frequency of Firmicutes and bacteroidetes in gut microbiota in obese and normal weight Egyptian children and adults. Archiv Med Sci: AMS. 2011;3(3):501. doi:10.5114/aoms.2011.23418.
- Ley RE, Bäckhed F, Turnbaugh P, Lozupone CA, Knight RD, Gordon JI. Obesity alters gut microbial ecology. Proc Natl Acad Sci USA. 2005;102(31):11070–11075. doi:10.1073/pnas.0504978102.
- Hippe B, Remely M, Aumueller E, Pointner A, Magnet U, Haslberger AG. Faecalibacterium prausnitzii phylotypes in type two diabetic, obese, and lean control subjects. Benef Microbes. 2016;7(4):511–518. doi:10.3920/BM2015.0075.
- Ray M, Hor P, Ojha D, Soren JP, Singh SN, Mondal KC. Bifidobacteria and its rice fermented products on diet induced obese mice: analysis of physical status, serum profile and gene expressions. Benef Microbes. 2018;9(3):441–452. doi:10.3920/BM2017.0056.
- Kim J, Yun JM, Kim MK, Kwon O, Cho B. Lactobacillus gasseri BNR17 supplementation reduces the visceral fat accumulation and waist circumference in obese adults: a randomized, double-blind, placebo-controlled trial. J Med Food. 2018;21(5):454–461. doi:10.1089/jmf.2017.3937.
- Gøbel RJ, Larsen N, Jakobsen M, Mølgaard C, Michaelsen KF. Probiotics to adolescents with obesity: effects on inflammation and metabolic syndrome. J Pediatr Gastroenterol Nutr. 2012;55(6):673–678. doi:10.1097/MPG.0b013e318263066c.
- Tsai Y-C, Wang H-T, Hsu J-T, Li Y-H, Chen C-Y. Yeast with bacteriocin from ruminal bacteria enhances glucose utilization, reduces ectopic fat accumulation, and alters cecal microbiota in dietary-induced obese mice. Food Funct. 2015;6(8):2727–2735. doi:10.1039/C5FO00367A.
- Heisel T, Montassier E, Johnson A, Al-Ghalith G, Lin YW, Wei LN, Knights D, Gale CA. High-fat diet changes fungal microbiomes and interkingdom relationships in the murine gut. MSphere. 2017;2(5):e00351–17. doi:10.1128/mSphere.00351-17.
- Borges FM, de Paula TO, Sarmiento MR, de Oliveira MG, Pereira MLM, Toledo IV, Nascimento TC, Ferreira-Machado AB, Silva VL, Diniz CG. Fungal diversity of human gut microbiota among eutrophic, overweight, and obese individuals based on aerobic culture-dependent approach. Curr Microbiol. 2018;75(6):726–735. doi:10.1007/s00284-018-1438-8.
- Rodríguez MM, Pérez D, Chaves FJ, Esteve E, Marin-Garcia P, Xifra G, Vendrell J, Jové M, Pamplona R, Ricart W, et al. Obesity changes the human gut mycobiome. Sci Rep. 2015;5(1):14600. doi:10.1038/srep14600.
- García‐Gamboa R, Kirchmayr MR, Gradilla‐Hernández MS, Pérez‐Brocal V, Moya A, González‐Avila M. The intestinal mycobiota and its relationship with overweight, obesity and nutritional aspects. J Hum Nutr Diet. 2021;34(4):645–655. doi:10.1111/jhn.12864.
- Sun Y, Zuo T, Cheung CP, Gu W, Wan Y, Zhang F, Chen N, Zhan H, Yeoh YK, Niu J, et al. Population-level configurations of gut mycobiome across 6 ethnicities in urban and rural China. Gastroenterology. 2021;160(1):272–86. e11. doi:10.1053/j.gastro.2020.09.014.
- Pareek S, Kurakawa T, Das B, Motooka D, Nakaya S, Rongsen-Chandola T, Goyal N, Kayama H, Dodd D, Okumura R, et al. Comparison of Japanese and Indian intestinal microbiota shows diet-dependent interaction between bacteria and fungi. Npj Biofilms Microbiomes. 2019;5(1):1–13. doi:10.1038/s41522-019-0110-9.
- Zuo T, Wong SH, Cheung CP, Lam K, Lui R, Cheung K, Zhang F, Tang W, Ching JYL, Wu JCY, et al. Gut fungal dysbiosis correlates with reduced efficacy of fecal microbiota transplantation in clostridium difficile infection. Nat Commun. 2018;9(1):1–11. doi:10.1038/s41467-018-06103-6.
- Soverini M, Turroni S, Biagi E, Brigidi P, Candela M, Rampelli S. HumanMycobiomeScan: a new bioinformatics tool for the characterization of the fungal fraction in metagenomic samples. BMC Genom. 2019;20(1):496. doi:10.1186/s12864-019-5883-y.
- Truong DT, Franzosa EA, Tickle TL, Scholz M, Weingart G, Pasolli E, Tett A, Huttenhower C, Segata N. MetaPhlAn2 for enhanced metagenomic taxonomic profiling. Nat Methods. 2015;12(10):902–903. doi:10.1038/nmeth.3589.
- Segata N, Izard J, Waldron L, Gevers D, Miropolsky L, Garrett WS, Huttenhower C. Metagenomic biomarker discovery and explanation. Genome Biol. 2011;12(6):R60. doi:10.1186/gb-2011-12-6-r60.
- Nguyen NH, Song Z, Bates ST, Branco S, Tedersoo L, Menke J, Schilling JS, Kennedy PG. FUNGuild: an open annotation tool for parsing fungal community datasets by ecological guild. Fungal Ecol. 2016;20:241–248. doi:10.1016/j.funeco.2015.06.006.
- Truong DT, Tett A, Pasolli E, Huttenhower C, Segata N. Microbial strain-level population structure and genetic diversity from metagenomes. Genome Res. 2017;27(4):626–638. doi:10.1101/gr.216242.116.
- Xue P, Minasny B, McBratney AB. Land-use affects soil microbial co-occurrence networks and their putative functions. Appl Soil Ecol. 2022;169:104184. doi:10.1016/j.apsoil.2021.104184.
- Yeoh YK, Zuo T, Lui GCY, Zhang F, Liu Q, Li AY, Chung AC, Cheung CP, Tso EY, Fung KS, et al. Gut microbiota composition reflects disease severity and dysfunctional immune responses in patients with COVID-19. Gut. 2021;70(4):698–706. doi:10.1136/gutjnl-2020-323020.
- Pinart M, Dötsch A, Schlicht K, Laudes M, Bouwman J, Forslund SK, Pischon T, Nimptsch K. Gut microbiome composition in obese and non-obese persons: a systematic review and meta-analysis. Nutrients. 2021;14(1):12. doi:10.3390/nu14010012.
- Mar Rodríguez M, Pérez D, Javier Chaves F, Esteve E, Marin-Garcia P, Xifra G, Vendrell J, Jové M, Pamplona R, Ricart W, et al. Obesity changes the human gut mycobiome. Sci Rep. 2015;5(1):14600. doi:10.1038/srep14600.
- Chaleckis R, Ebe M, Pluskal T, Murakami I, Kondoh H, Yanagida M. Unexpected similarities between the schizosaccharomyces and human blood metabolomes, and novel human metabolites. Mol Biosyst. 2014;10(10):2538–2551. doi:10.1039/C4MB00346B.
- Newbound M, Mccarthy MA, Lebel T. Fungi and the urban environment: a review. Landsc Urban Plan. 2010;96(3):138–145. doi:10.1016/j.landurbplan.2010.04.005.
- Kabwe MH, Vikram S, Mulaudzi K, Jansson JK, Makhalanyane TP. The gut mycobiota of rural and urban individuals is shaped by geography. BMC Microbiol. 2020;20(1):1–12. doi:10.1186/s12866-020-01907-3.
- Strope PK, Skelly DA, Kozmin SG, Mahadevan G, Stone EA, Magwene PM, Dietrich FS, McCusker JH. The 100-genomes strains, an S. cerevisiae resource that illuminates its natural phenotypic and genotypic variation and emergence as an opportunistic pathogen. Genome Res. 2015;25(5):762–774. doi:10.1101/gr.185538.114.
- Hose J, Escalante LE, Clowers KJ, Dutcher HA, Robinson D, Bouriakov V, Coon JJ, Shishkova E, Gasch AP. The genetic basis of aneuploidy tolerance in wild yeast. Elife. 2020;9:e52063. doi:10.7554/eLife.52063.
- Zhang Z, Yin N, Cai X, Wang Z, Cui Y. Arsenic redox transformation by pseudomonas sp. HN-2 isolated from arsenic-contaminated soil in Hunan, China. J Environ Sci. 2016;47:165–173. doi:10.1016/j.jes.2015.11.036.
- Borgo F, Verduci E, Riva A, Lassandro C, Riva E, Morace G, Borghi E. Relative abundance in bacterial and fungal gut microbes in obese children: a case control study. Childhood Obesity. 2017;13(1):78–84. doi:10.1089/chi.2015.0194.
- Heisel T, Montassier E, Johnson A, Al-Ghalith G, Lin Y-W, Wei L-N, Knights D, Gale CA. High-fat diet changes fungal microbiomes and interkingdom relationships in the murine gut. MSphere. 2017;2(5). doi:10.1128/mSphere.00351-17.
- Fiers,William D., Irina Leonardi, and Iliyan D. Iliev. From birth and throughout life: fungal microbiota in nutrition and metabolic health. Annual review of nutrition 40 (2020):323–343.
- Chaverri P, Chaverri G. A missing link in mutualistic networks: symbiotic fungi in plant-animal interactions. bioRxiv. 2019:761270 doi:10.1101/761270.
- Chen W, Xu R, Wu Y, Chen J, Zhang Y, Hu T, Yuan X, Zhou L, Tan T, Fan J, et al. Plant diversity is coupled with beta not alpha diversity of soil fungal communities following N enrichment in a semi-arid grassland. Soil Biol Biochem. 2018;116:388–398. doi:10.1016/j.soilbio.2017.10.039.
- He Z. A history of wheat breeding. China: Cimmyt; 2001.
- Sommerhalder RJ, McDonald BA, Mascher F, Zhan J. Sexual recombinants make a significant contribution to epidemics caused by the wheat pathogen phaeosphaeria nodorum. Phytopathol. 2010;100(9):855–862. doi:10.1094/PHYTO-100-9-0855.
- Ying F, Xiaoming C, Long S, et al. Common edible wasps in Yunnan Province, China and their nutritional value [J]. Forest insects as food: humans bite back, 2010;9:93.
- Eleftherianos I, Yadav S, Kenney E, Cooper D, Ozakman Y, Patrnogic J. Role of endosymbionts in insect–parasitic nematode interactions. Trends Parasitol. 2018;34(5):430–444. doi:10.1016/j.pt.2017.10.004.
- Urubschurov V, Janczyk P. The Dynamic Process Biodiversity-Case Stud Evol Spatial Distribut. 2011;277–302. doi:10.5772/24108.
- Gibson CM, Hunter MS. Extraordinarily widespread and fantastically complex: comparative biology of endosymbiotic bacterial and fungal mutualists of insects. Ecol Lett. 2010;13(2):223–234. doi:10.1111/j.1461-0248.2009.01416.x.
- Barretto D, Vootla S. GC-MS analysis of bioactive compounds and antimicrobial activity of Cryptococcus rajasthanensis Ky627764 isolated from bombyx mori gut microflora. Int J Adv Res (Indore). 2018;6(3):525–538. doi:10.21474/IJAR01/6700.
- Elkhateeb W, Daba G. Fungi over fungi, endophytic fungi associated with mushroom fruiting bodies and lichens. J Pharm Pharm Res. 2021;4(2):01–04. doi:10.31579/2693-7247/028.
- Solieri L. The revenge of zygosaccharomyces yeasts in food biotechnology and applied microbiology. World J Microbiol Biotechnol. 2021;37(6):96. doi:10.1007/s11274-021-03066-7.
- Charoenchai C. Yeasts in the Production of Wine. Yeasts in Fruit Wine Fermentation; 2019. doi:10.1007/978-1-4939-9782-4_15.
- Spencer DM, Spencer J, De Figueroa L, Heluane H. Yeasts associated with rotting citrus fruits in Tucumán, Argentina. Mycol Res. 1992;96(10):891–892. doi:10.1016/S0953-7562(09)81038-1.
- Loureiro V, Malfeito-Ferreira M. Spoilage yeasts in the wine industry. Int J Food Microbiol. 2003;86(1–2):23–50. doi:10.1016/S0168-1605(03)00246-0.
- Hoffmann C, Dollive S, Grunberg S, Chen J, Li H, Wu GD, Lewis JD, Bushman FD. Archaea and fungi of the human gut microbiome: correlations with diet and bacterial residents. PLOS ONE. 2013;8(6):e66019. doi:10.1371/journal.pone.0066019.
- Wu GD, Chen J, Hoffmann C, Bittinger K, Chen Y-Y, Keilbaugh SA, Bewtra M, Knights D, Walters WA, Knight R, et al. Linking long-term dietary patterns with gut microbial enterotypes. Sci. 2011;334(6052):105–108. doi:10.1126/science.1208344.
- Sam Q, Chang MW, Chai LYA. The fungal mycobiome and its interaction with gut bacteria in the host. Int J Mol Sci. 2017;18(2):330. doi:10.3390/ijms18020330.
- Witherden EA, Shoaie S, Hall RA, Moyes DL. The human mucosal mycobiome and fungal community interactions. J Fungi (Basel). 2017;3(4):56. doi:10.3390/jof3040056.
- Banerjee S, Walder F, Büchi L, Meyer M, Held AY, Gattinger A, Keller T, Charles R, van der Heijden MGA. Agricultural intensification reduces microbial network complexity and the abundance of keystone taxa in roots. Isme J. 2019;13(7):1722–1736. doi:10.1038/s41396-019-0383-2.
- Rao C, Coyte KZ, Bainter W, Geha RS, Martin CR, Rakoff-Nahoum S. Multi-kingdom ecological drivers of microbiota assembly in preterm infants. Nature. 2021;591(7851):633–638. doi:10.1038/s41586-021-03241-8.
- Faust K, Sathirapongsasuti JF, Izard J, Segata N, Gevers D, Raes J, Huttenhower C. Microbial co-occurrence relationships in the human microbiome. PLoS Comput Biol. 2012;8(7):e1002606. doi:10.1371/journal.pcbi.1002606.
- Noverr MC, Phare SM, Toews GB, Coffey MJ, Huffnagle GB. Pathogenic yeasts Cryptococcus neoformans and Candida albicans produce immunomodulatory prostaglandins. Infect Immun. 2001;69(5):2957–2963. doi:10.1128/IAI.69.5.2957-2963.2001.
- Erb‐Downward JR, Noggle RM, Williamson PR, Huffnagle GB. The role of laccase in prostaglandin production by Cryptococcus neoformans. Mol Microbiol. 2008;68(6):1428–1437. doi:10.1111/j.1365-2958.2008.06245.x.
- Fain JN, Leffler CW, Cowan GS, Buffington C, Pouncey L, Bahouth SW. Stimulation of leptin release by arachidonic acid and prostaglandin E2 in adipose tissue from obese humans. Metabolism-Clin Exp. 2001;50(8):921–928. doi:10.1053/meta.2001.24927.
- Benito Á, Calderón F, Benito S. Mixed alcoholic fermentation of schizosaccharomyces pombe and Lachancea thermotolerans and its influence on mannose-containing polysaccharides wine composition. Amb Express. 2019;9(1):1–8. doi:10.1186/s13568-019-0738-0.
- Palomero F, Morata A, Benito S, Calderón F, Suárez-Lepe JA. New genera of yeasts for over-lees aging of red wine. Food Chem. 2009;112(2):432–441. doi:10.1016/j.foodchem.2008.05.098.
- Benito S. The impacts of schizosaccharomyces on winemaking. Appl Microbiol Biotechnol. 2019;103(11):4291–4312. doi:10.1007/s00253-019-09827-7.
- Mims TS, Al Abdallah Q, Stewart JD, Watts SP, White CT, Rousselle TV, Gosain A, Bajwa A, Han JC, Willis KA, et al. The gut mycobiome of healthy mice is shaped by the environment and correlates with metabolic outcomes in response to diet. Commun Biol. 2021;4(1):1–11. doi:10.1038/s42003-021-01820-z.
- Schröder T, Wiese AV, Ender F, Quell KM, Vollbrandt T, Duhn J, Sünderhauf A, Künstner A, Moreno‐Fernandez ME, Derer S, et al. Short‐term high‐fat diet feeding protects from the development of experimental allergic asthma in mice. Clin Exp Allergy. 2019;49(9):1245–1257. doi:10.1111/cea.13454.
- Fiers WD, Gao IH, Iliev ID. Gut mycobiota under scrutiny: fungal symbionts or environmental transients? Curr Opin Microbiol. 2019;50:79–86. doi:10.1016/j.mib.2019.09.010.