
ABSTRACT
Alcohol-related liver disease (ALD) is recognized as a global health crisis, contributing to approximately 20% of liver cancer-associated fatalities. Dysbiosis of the gut microbiome is associated with the development of ALD, with the gut microbial metabolite urolithin A (UA) exhibiting a potential for alleviating liver symptoms. However, the protective efficacy of UA against ALD and its underlying mechanism mediated by microbiota remain elusive. In this study, we provide evidence demonstrating that UA effectively ameliorates alcohol-induced metabolic disorders and hepatic endoplasmic reticulum (ER) stress through a specific gut-microbiota-liver axis mediated by major urinary protein 1 (MUP1). Moreover, UA exhibited the potential to restore alcohol-induced dysbiosis of the intestinal microbiota by enriching the abundance of Bacteroides sartorii (B. sartorii), Parabacteroides distasonis (P. distasonis), and Akkermansia muciniphila (A. muciniphila), along with their derived metabolite propionic acid. Partial attenuation of the hepatoprotective effects exerted by UA was observed upon depletion of gut microbiota using antibiotics. Subsequently, a fecal microbiota transplantation (FMT) experiment was conducted to evaluate the microbiota-dependent effects of UA in ALD. FMT derived from mice treated with UA exhibited comparable efficacy to direct UA treatment, as it effectively attenuated ER stress through modulation of MUP1. It was noteworthy that strong associations were observed among the hepatic MUP1, gut microbiome, and metabolome profiles affected by UA. Intriguingly, oral administration of UA-enriched B. sartorii, P. distasonis, and A. muciniphila can enhance propionic acid production to effectively suppress ER stress via MUP1, mimicking UA treatment. Collectively, these findings elucidate the causal mechanism that UA alleviated ALD through the gut-microbiota-liver axis. This unique mechanism sheds light on developing novel microbiome-targeted therapeutic strategies against ALD.
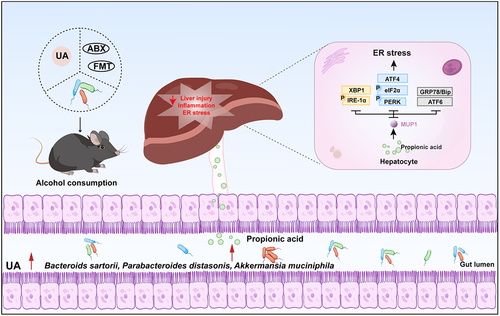
GRAPHICAL ABSTRACT
Introduction
Hepatic steatosis considered the earliest stage of alcohol-related liver disease (ALD) develops in nearly 90% of patients with alcohol use disorder.Citation1 As the disease progresses, inflammation and edema spread throughout the healthy liver parenchyma, leading to alcohol-associated steatohepatitis, fibrosis, cirrhosis, and eventually liver failure.Citation2 ALD is a major contributor to global morbidity and mortality associated with liver diseases, resulting in approximately 2 million deaths annually.Citation3,Citation4 In 2019, alcohol consumption was estimated to significantly contribute to approximately 25% of all cirrhosis-related fatalities worldwide and accounted for around 20% of deaths attributed to liver cancer.Citation5,Citation6 According to a recent report in The Lancet, global per capita alcohol consumption has witnessed a 10% increase between 1990 and 2017, with projections indicating a further surge of 17% over the next decade.Citation7 In severe cases of ALD, corticosteroids represent the sole efficacious first-line pharmacological intervention available; however, their beneficial effects are typically transient and short-lived.Citation8 Consequently, it is imperative to elucidate the underlying mechanism of this disease and explore novel therapeutic approaches due to the limited availability of current treatments.
An increasing number of research has demonstrated that an imbalance in the composition and function of gut microbiota, known as dysbiosis, could exacerbate the progression of ALD through the interactions with liver metabolism via the gut-microbiota-liver axis.Citation9,Citation10 Even during the early stages of ALD, alcohol consumption can induce an elevation in gut permeability, leading to a leaky gut syndrome. It is increasingly recognized that gut leakiness is a consequence of excessive alcohol consumption and that translocation of gut-derived lipopolysaccharide (LPS) represents a critical risk factor in the pathogenesis of ALD.Citation11–13 Individuals with alcoholism, alcoholic hepatitis, and liver cirrhosis exhibit elevated levels of bacterial products in their bloodstream compared to healthy individuals.Citation14,Citation15 Specifically, alcohol consumption increases circulating microbial double deoxyribonucleic acid (dDNA) only in ALD patients, particularly those with mild symptoms.Citation16 Furthermore, both alcohol-fed mice and patients with ALD exhibit enteric dysbiosis and intestinal bacterial overgrowth associated with alcohol consumption.Citation13 Consequently, regulating the homeostasis of intestinal flora and its metabolites can serve as a promising strategy for the prevention and treatment of ALD.
Fruits such as berries and pomegranates are abundant sources of polyphenolic compounds, including ellagitannin (ET) and ellagic acid (EA), which demonstrated significant positive impacts on human health.Citation17–19 The gut microbiota metabolizes EA into urolithins, with UA exhibiting superior anti-inflammatory and antioxidant properties compared to other urolithin types, and its biological safety has been confirmed in humans.Citation20–26 It has been proposed that UA plays a crucial role in the regulation of insulin resistance, obesity, and liver function.Citation27–32 In addition, UA enhances intestinal barrier function and exerts anti-inflammatory effects, thereby promoting overall gut health.Citation26 Recent evidence strongly supports the interaction between UA and gut microbiota.Citation33–37 The collective findings from these studies highlighted the pivotal role of gut microbial metabolism in facilitating the biological activities of UA, indicating its potential efficacy in improving ALD. Nonetheless, the protective effects of UA on ALD remain unclear, and there exists a substantial knowledge gap regarding the precise role of gut microbiota in mediating the effect of UA on regulating ALD. Based on these premises, we undertook a therapeutic strategy for ALD, aiming to elucidate the underlying mechanism involving intestinal flora.
Our study has elucidated the mechanisms through which UA exerts its beneficial effects on ALD via modulation of the gut-microbiota-liver axis. We observed a significant amelioration of ALD phenotypes following oral administration of UA. Moreover, analysis of the gut microbiome revealed a significant enrichment of specific bacteria, including B. sartorii, P. distasonis, and A. muciniphila upon UA treatment. These bacteria exhibited the potential to enhance propionic acid production, subsequently activating hepatic MUP1 to alleviate ER stress and ultimately ameliorate ALD. The present study provides valuable insights into the potential role of UA and its regulated gut microbiota, metabolites, and hepatic targets in the management of alcohol-related diseases.
Results
UA attenuates ALD-related metabolic disorders
To investigate the therapeutic effect of UA on ALD, we established a chronic alcohol mouse model by feeding male C57BL/6J mice either a control liquid diet (Ctrl group) or an alcohol liquid diet for 14 weeks with (Alc UA group) or without (Alc group) UA treatment in animal experiment 1 (). UA significantly decreased body weight and body weight gain in the Alc UA group compared to the Alc group (ANOVA with Tukey’s test, p < .05) (). No statistically significant differences were observed in food intake and liver index (). To investigate the pathological changes in liver injury, we conducted H&E staining and observed that UA-treated mice exhibited reduced accumulation of lipid droplets compared to the Alc group (). To further observe the changes in the inflammation level of liver macrophages, F4/80 immunohistochemical staining was performed. Mice in the Alc group exhibited liver impairment characterized by inflammation and macrophage infiltration of macrophages, as compared to the Ctrl group. However, treatment with UA effectively reversed these effects in the Alc UA mice (). Moreover, UA effectively ameliorated hepatic lesions and lipid accumulation in mice exposed to chronic alcohol consumption, as demonstrated by decreased levels of alanine aminotransferase (ALT), aspartate aminotransferase (AST) and total triglyceride (TG) (), accompanied by diminished expression of various genes and proteins associated with hepatic inflammation and injury ().
Figure 1. The effect of UA on chronic alcohol-induced liver injury.
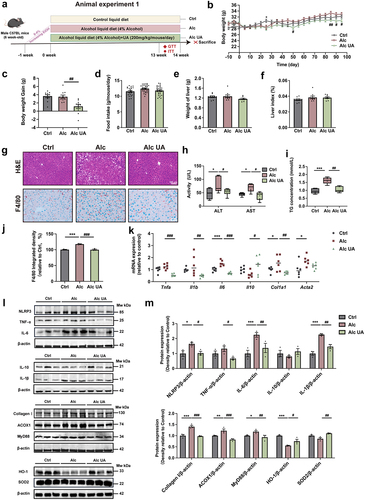
Considering the crucial role of insulin resistance (IR) in the pathogenesis of ALD,Citation38 we performed an oral glucose tolerance test (OGTT) and insulin tolerance test (ITT). Our findings demonstrate that UA treatment significantly improved insulin sensitivity in the Alc UA group compared to the Alc group (Figure. S1A&B). Moreover, we assessed energy expenditure using metabolic cages and observed significantly elevated levels of energy expenditure, oxygen consumption (VO2), carbon dioxide production (VCO2), and respiratory exchange rate (RER) (Figure. S1C-F) in UA-treated mice compared to the Alc mice. Interestingly, this disparity became more pronounced during periods of darkness. These findings indicate that UA has the potential to alleviate ALD-related metabolic disorders.
UA alleviates alcohol-induced hepatic endoplasmic reticulum stress via upregulating MUP1
To investigate the global gene expression signatures and identify the potential molecular target underlying the beneficial effect of UA on ALD, we conducted the RNA sequencing (RNA-seq) analysis using liver tissues from mice in the Ctrl, Alc, and Alc UA groups. The average mapping ratio with reference genome was 95.53%, the average mapping ratio with gene was 75.80%, and 19,733 genes were identified. Through RNA-seq gene expression profiling, we identified five key genes upregulated and 21 key genes downregulated in the livers of the Alc UA group compared to the Alc group, as shown in gene hierarchical clustering heatmap using differentially expressed gene (DEG) analysis (FDR q < 5%, ). The keystone genes were validated by qRT-PCR, and results were consistent with RNA-Seq findings (Figure. S1G). Volcano plot on the gene abundance showed that among five upregulated genes in UA-treated mice, the most significant one was Mup1 encoding major urinary protein 1 (MUP1) (). Moreover, the analysis of GO terms also revealed that MUP1 participated in the top five pathways of the GO Biological process (). It is noteworthy that our GSEA analysis revealed a significant impact of UA on the protein processing in the endoplasmic reticulum (ER) pathway, as indicated by the Kyoto Encyclopedia of Genes and Genomes (KEGG) functional pathway (). Consistent to transcriptome profile, the protein level of MUP1 was also restored by UA treatment, as assessed by immunofluorescence staining of liver tissues () and western blots (). Based on the aforementioned results, we hypothesized that UA regulated hepatic protein processing in ER pathway via MUP1. Our findings supported this hypothesis as we observed an upregulation in hepatic MUP1 and a downregulation in ER-related genes and proteins in the Alc UA group compared to the Alc group ( & Figure S1h).
Figure 2. UA alleviates alcohol-induced hepatic endoplasmic reticulum stress via upregulating MUP1.
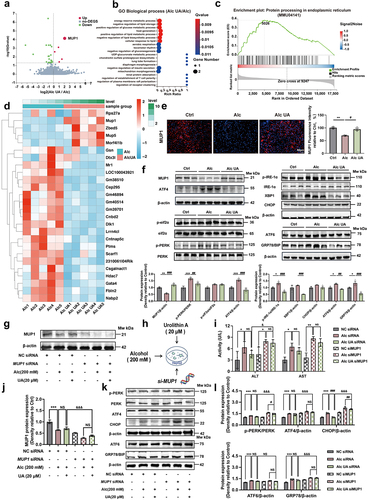
To further confirm the potential role of MUP1 in the beneficial effects of UA on ER stress, we further knocked down Mup1 expression using siRNA in the human liver cell line HepG2 treated with alcohol and UA (). Our findings demonstrate that we successfully knocked down the Mup1 (). Moreover, the knockdown of the Mup1 significantly attenuated the beneficial effects of UA on ER stress-related proteins (), implying that the effect of UA on hepatic ER stress was mediated by MUP1. Furthermore, the alleviating effects of UA on the levels of ALT and AST were also blunted when hepatic MUP1 was knocked down (). Interestingly, our results showed that the up-regulation of MUP1 was barely affected by UA in vitro without the gut microbiota (). These observations suggest that UA may not exert its therapeutic effects on ALD by directly targeting hepatic cells. The inter-organ crosstalk, especially the gut-liver axis, plays a pivotal role in regulating metabolic homeostasis.Citation39 We speculated that UA may ameliorate ALD by modulating the gut-liver axis. These findings first highlight the critical role of hepatic MUP1 in suppressing ER stress in ALD and suggest that it may serve as a key mechanism underlying the protective effects of UA against ALD.
UA restores alcohol-induced intestinal barrier damage and gut microbiome dysbiosis
The integrity of the intestinal barrier is critical to maintaining gut permeability and preventing endotoxemia and is also related to the gut microbiome, ALD, and its complications.Citation40 To investigate the potential role of UA in ameliorating ALD through modulation of the gut-microbiota-liver axis, we examined the impact of UA on intestinal barrier integrity. Our results demonstrate that UA administration increased the length of villi showed by the H&E staining (). Additionally, UA increased the number of goblet cells compared to the Alc mice by the Alcian blue staining and MUC2 immunofluorescence staining of colon sections (). Additionally, the expressions of intestinal inflammation-related genes were decreased in the Alc UA group, while the expressions of intestinal barrier-related genes were significantly increased in the Alc UA group compared to the Alc group (Figure. S2C). The levels of tight-junction proteins ZO-1, Occludin, and Claudin-1 were also elevated in the colon tissues in the Alc UA group (), consistent with the observed alteration in intestinal permeability. These findings suggest that UA enhanced the intestinal barrier function and maintained intestinal health homeostasis in ALD mice. Additionally, our findings demonstrate that UA exerted a significant reduction in the serum level of bacterial lipopolysaccharide (LPS) (), indicating that the modulation of gut microbiota and intestinal barrier integrity may play pivotal roles in ameliorating ALD through UA treatment.
Figure 3. UA restores alcohol-induced intestinal barrier damage and gut microbiome dysbiosis.
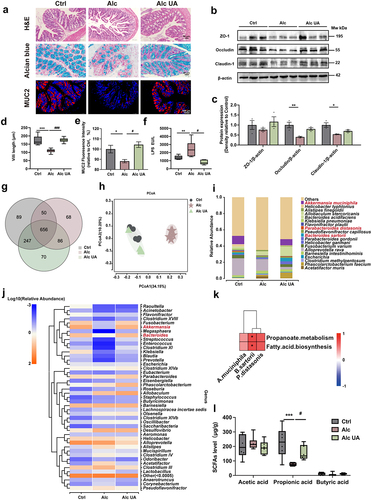
To investigate the impact of UA treatment on the altered gut microbiome profile in ALD mice, we conducted 16S rRNA amplicon sequencing of the fecal samples for microbiome analysis. Our results indicate that UA reshaped the structure of the gut microbiota and increased 118 unique OTUs compared to the Alc group (). The UniFrac distance-based principal coordinate analysis (PCoA) revealed that the composition of the intestinal microbiome in the Alc mice clustered separately from that of Ctrl mice (), indicating that chronic alcohol consumption disrupted the composition of the gut microbiota. However, the composition of the intestinal microbiome in the Alc UA mice displayed closer proximity to the Ctrl mice, indicating alcohol-induced disruption in the gut microbiota was partly restored by the UA intervention (). Moreover, we observed that chronic alcohol consumption decreased the enrichment of Akkermansia and Bacteroides at the genus level. In contrast, UA restored the enrichment of Akkermansia and Bacteroides (). Furthermore, alcohol decreased the abundance of B. sartorii, P. distasonis, and A. muciniphila at the species level in the Alc group compared to the Ctrl group (). However, UA administration exhibited an increase in the abundance of B. sartorii, P. distasonis, and A. muciniphila in Alc UA group compared to the Alc group ().
It was worth noting that the relative abundances of B. sartorii, P. distasonis and A. muciniphila were all positively correlated with the microbiota KEGG propanoate metabolism pathway and fatty acid biosynthesis (), especially B. sartorii (Pearson’s coefficient = 0.62, p < .05), suggesting that B. sartorii, P. distasonis and A. muciniphila may be involved in the production of short-chain fatty acids (SCFA) propionic acid. We further measured the concentration of SCFAs (acetic acid, propionic acid, butyric acid) in the feces of mice. Notably, our results demonstrated that UA significantly enhanced the level of propionic acid which was decreased by chronic alcohol consumption (). Additionally, UA enhanced the mRNA expression levels of receptors for SCFAs (Gpr41, Gpr43, and Olfr78), which were downregulated due to chronic alcohol consumption in Alc mice (Figure. S2B). The above results suggest that UA effectively ameliorated the dysbiosis of gut microbiome induced by chronic alcohol consumption in ALD mice, through the enrichment of specific gut bacteria B. sartorii, P. distasonis, and A. muciniphila, as well as their derived SCFA propionic acid.
UA alleviates ALD in a microbiota-dependent manner
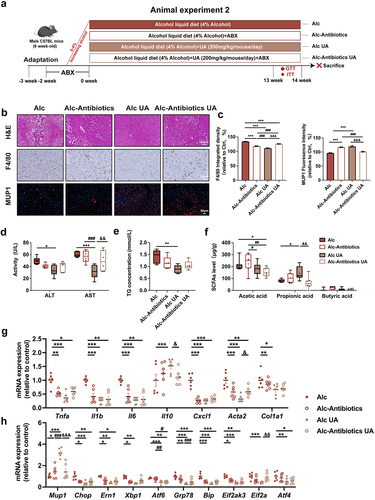
To investigate the pivotal role of gut microbiota in mediating the effects of UA on ALD, we aimed to investigate whether depleting gut microbiota would affect the observed beneficial effects of UA in ALD mice. In animal experiment 2, an antibiotics cocktail treatment was administered to investigate the role of gut microbiota in the liver function facilitated by UA. The mice were administrated antibiotics in the alcohol liquid diet, starting 14 days before the UA treatment and continuing twice a week throughout the experiment (). Subsequently, hepatic alterations were evaluated after 14 weeks. The beneficial effects of UA on ALT, AST and TG levels (), as well as macrophage infiltration (), were found to be attenuated following antibiotic administration. Additionally, the beneficial effects of UA against alcohol-induced inflammation, liver injury, as well as ER stress were blunted by antibiotic treatment (). Moreover, antibiotic treatment weakened the effect of UA on insulin sensitivity (Figure. S3A&B) and energy metabolism in alcoholic mice (Figure. S3C-F-). The Alc-Antibiotics UA mice exhibited significantly reduced levels of propionic acid compared to the Alc UA mice, suggesting that antibiotics directly depleted the microbiota responsible for propionic acid production (). It is noteworthy that the ability of UA to upregulate Mup1 was attenuated by antibiotic treatment, suggesting a gut microbiota-dependent regulation of MUP1 by UA (). Collectively, our results indicate that UA alleviated ALD in a microbiota-dependent manner.
Figure 4. UA alleviates ALD in a gut microbiota-dependent manner.
Gut microbiota mediates the activation of MUP1 to alleviate ALD
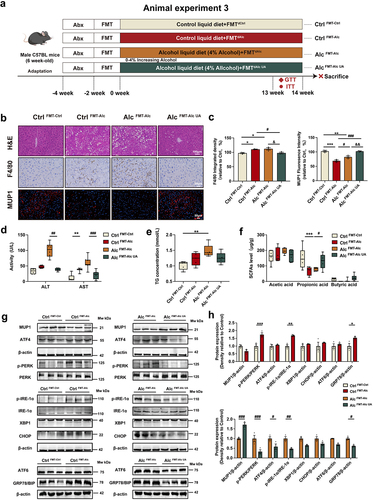
The intestinal microbiota has evolved as a major player in various hepatic disorders, especially ALD.Citation41,Citation42 To investigate whether the development of ALD and the UA alleviation of ALD are transmissible via gut microbiota, we performed an FMT experiment in animal experiment 3 (). The microbiota was transferred from the Ctrl group to healthy antibiotic-treated Ctrl mice (Ctrl FMT-Ctrl), from the Alc group to healthy antibiotic-treated Ctrl mice (Ctrl FMT-Alc), from the Alc group to healthy antibiotic-treated Alc mice (Alc FMT-Alc), and from the Alc UA group to antibiotic-treated recipient Alc mice (Alc FMT-Alc UA). We conducted a comprehensive analysis of the intestinal microbiota in mice both pre- and post-FMT, revealing no discernible alterations in the composition of species B. sartorii, P. distasonis, and A. muciniphila before FMT (Figure. S7A). Remarkably post-FMT, our findings demonstrate that Ctrl FMT-Alc mice exhibited a significant decrease in the abundance of B. sartorii, P. distasonis, and A. muciniphila. Conversely, Alc FMT-Alc UA mice exhibited a substantial increase in the abundance of B. sartorii, P. distasonis, and A. muciniphila (Figure. S7B). These results indicate that FMT successfully transported the alterations of B. sartorii, P. distasonis, and A. muciniphila to mice, which mediated the effect of UA on ALD. Our findings indicated that the Ctrl FMT-Alc mice exhibited liver damage with higher AST, ALT and TG levels compared to the Ctrl FMT-Ctrl mice, whereas the Alc FMT-Alc UA mice showed reduced levels of AST, AST and TG compared to the Alc FMT-Alc mice (). H&E staining and F4/80 immunohistochemistry revealed significant hepatic pathological injury, inflammation, and macrophage infiltration in the liver of Ctrl FMT-Alc mice compared to the Ctrl FMT-Ctrl group; however, Alc FMT-Alc UA mice exhibited amelioration of these injury compared to the Alc FMT-Alc mice (). In addition, the Ctrl FMT-Alc mice exhibited an upregulation of genes associated with hepatic inflammation and ER stress, whereas Alc FMT-Alc UA mice demonstrated a restoration of these genes (Figure. S5A-B). It was worth noting that the Alc FMT-Alc UA mice exhibited significant upregulation of MUP1 and downregulation of the expression of ER stress-related proteins compared to the Alc FMT-Alc mice (). Consistent with the effects of UA, the Alc FMT-Alc UA mice also demonstrated improvements in insulin sensitivity (Figure. S4C&D) and energy metabolism (Figure. S4E-H). Additionally, the level of propionic acid was significantly reduced in Crtl FMT-Alc mice compared to the Ctrl FMT-Ctrl mice. In contrast, it exhibited a reversed trend in the Alc FMT-Alc UA group (). Taken together, these findings mentioned above demonstrate that FMT from UA-treated mice mimicked the UA effects in alcoholic mice, thereby indicating the pivotal role of gut microbiota in mediating the impact of UA on MUP1 activation in ALD.
Figure 5. Gut microbiota mediates the activation of MUP1 to alleviate ALD.
B. sartorii, P. distasonis, A. muciniphila, and their derived propionic acid mediate the activation of hepatic MUP1
To further investigate the direct involvement of UA-enriched gut bacteria in the regulation of hepatic MUP1, we conducted an in-depth correlation analysis between UA-upregulated microbiota and MUP1. Our results demonstrated a positive correlation between B. sartorii, P. distasonis, and A. muciniphila with MUP1 (), while a negative correlation with UA-downregulated genes (Figure. S2a). To further investigate the potential of these three bacteria species in enhancing MUP1 activation, we administered B. sartorii, P. distasonis, and A. muciniphila via oral gavage in animal experiment 4 (). The alcoholic mice were orally administered with B. sartorii, P. distasonis, and A. muciniphila separately daily for 14 weeks. We conducted a comprehensive analysis of the intestinal microbiota in mice both pre- and post- B. sartorii, P. distasonis, and A. muciniphila intervention, revealing no discernible alterations in the composition of species B. sartorii, P. distasonis, and A. muciniphila before intervention (Figure. S7C). Remarkably, our findings demonstrate that administration of B. sartorii, P. distasonis, and A. muciniphila resulted in a significant enhancement in the abundance of B. sartorii, P. distasonis, and A. muciniphila, respectively (Figure. S7D). The administration of these strains resulted in a significant reduction in the levels of AST, AST and TG (), as well as a notable decrease in macrophage infiltration in alcoholic mice (). Additionally, supplementation with B. sartorii, P. distasonis, and A. muciniphila led to a decrease in the mRNA levels of genes associated with hepatic inflammation and ER stress (Figure. S5A&B). Interestingly, our findings demonstrated that B. sartorii, P. distasonis, and A. muciniphila enhanced the expression of hepatic MUP1, as well as contributing to the amelioration of ER stress in alcoholic mice ().
Figure 6. B. sartorii, P. distasonis, A. muciniphila, and their derived propionic acid mediate the activation of hepatic MUP1 in ALD.
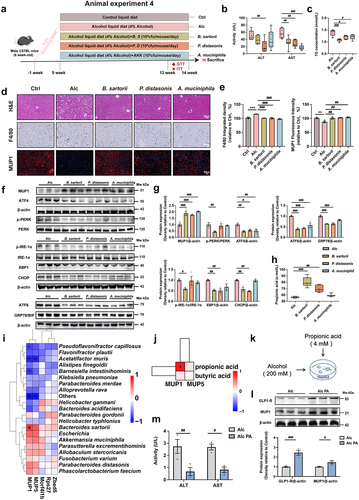
Notably, B. sartorii and P. distasonis administration significantly increased serum levels of propionic acid in alcoholic mice (). Interestingly, we observed a significant positive correlation between MUP1 and propionic acid (), implying the activation of MUP1 may associated with propionic acid. To further investigate the potential of propionic acid in activating MUP1, we directly intervened with propionic acid in alcohol-treated HepG2 cells (). The results of our study demonstrate the potential of propionic acid to activate MUP1 (), as well as a significant reduction in ALT and AST levels (). Collectively, our results indicate that UA-enriched B. sartorii, P. distasonis, and A. muciniphila increased propionic acid to activate MUP1, which ultimately mitigated the hepatic ER stress to ameliorate ALD.
Discussion
An increasing number of studies have recently suggested that the gut microbiota plays a significant role in the progression of ALD through the gut-microbiota-liver axis.Citation9,Citation10 The present study demonstrates, for the first time, that UA restored ALD-induced gut microbiota dysbiosis by enriching B. sartorii, P. distasonis, and A. muciniphila with their derived SCFA propionic acid, which played a pivotal role in the alleviation of ALD by suppressing ER stress via hepatic MUP1.
The liver is responsible for abundant protein synthesis and maintaining metabolic homeostasis. However, under pathological conditions, excessive protein synthesis overwhelms the storage capacity of the ER, thereby compromising its functional integrity in hepatocytes, which is likely to promote ER stress.Citation43,Citation44 Numerous studies have demonstrated the significant role of ER stress in the development of ALD, despite its complex intrinsic pathogenesis.Citation45–47 The gut microbial metabolite UA has been reported as a potential inhibitor of ER stress, effectively suppressing ER stress-induced insulin resistance and mitigating inflammation in the pancreas and lungs.Citation48–50 Our study revealed for the first time that UA upregulated MUP1 to consequently mitigate hepatic ER stress in ALD (). Moreover, the effect of UA on ER stress was blunted after the knockdown of the Mup1 (). MUP1, as the most abundant member of the MUP family, undergoes synthesis and processing in the ER and is subjected to negative regulation by ER stress.Citation48 Hepatic ER stress induces the formation of aggregates and sequestration of MUP1 within the ER, consequently impairing its secretion.Citation48 Consistent with our study, recent research supported the notion that there is a strong interaction between ER stress and MUP1 in nonalcoholic fatty liver disease (NAFLD). As a hormone-like protein, MUP1 is subject to regulation by both metabolic processes and ER stress, thereby alleviating hepatic ER stress and ER stress-induced insulin resistance.Citation48 Interestingly, we reveal that the effect of UA on MUP1 was diminished in vitro, implying that gut microbiota may be involved in the regulation of MUP1. Collectively, our findings demonstrated that targeted MUP1 may represent a promising therapeutic strategy for the management of ALD.
Mounting evidence has demonstrated that dysbiosis of the intestinal microbiota plays a significant role in the progression of ALD.Citation51–53 Alcohol exposure resulted in a decrease in the relative abundance of Bacteroides in the gut of experimental mice.Citation54 Our findings reveal that UA effectively restored the dysbiosis of the microbiome in ALD, leading to a significant enhancement in the abundance of B. sartorii, P. distasonis, and A. muciniphila (). In ALD and cirrhosis, lower butyrate concentrations in blood correlate with inflammation and disease progression.Citation55 Untargeted metabolomic analysis revealed a decline in propionic acid levels in the gut of chronic binge ethanol-fed mice.Citation56 Similarly, our findings indicate that the concentration of propionic acid in feces was reduced in the Alc mice. FMT from the Alc UA group and administration of B. sartorii, P. distasonis, and A. muciniphila mimicked the effect of UA on the elevation in fecal propionic acid levels.
The beneficial effects of UA on ALD were attenuated after removing the gut microbiota, highlighting the pivotal role of microbiota composition and their derived metabolites in mediating ALD (). The administration of UA also demonstrated improvements in body weight, liver function, insulin sensitivity, and energy metabolism in the control mice during animal experiment 5, implying the beneficial effect of UA on the liver in healthy mice. However, these effects were diminished when UA was co-administered with antibiotics (Figure. S6), suggesting that the hepatic and metabolic protective effects of UA in healthy mice may be partly mediated by gut microbiota as well. FMT contributes to restoring a balanced composition of gut microbiota and has emerged as a therapeutic option for chronic liver diseases including ALD. Consistent with our study, the administration of fecal microbiota obtained from healthy control mice results in a substantial improvement in ALD mice.Citation54 Our findings demonstrate that liver injury could be transmitted from ALD mice to healthy mice along with gut microbiota via FMT, providing evidence for a causal relationship between gut dysbiosis and the development of ALD. Moreover, FMT from the Alc UA mice could also activate MUP1 and ultimately alleviate ALD (), implying the pivotal role of gut microbiota in mediating the MUP1 activation. Our findings reveal that FMT from the Alc mice increased hepatic lipid accumulation and serum TG levels, whereas FMT from the Alc UA mice led to a decrease in hepatic lipid accumulation and serum TG levels. Similar to our results, previous research has demonstrated that FMT from alcohol-resistant mice effectively mitigated hepatic steatosis in alcohol-fed mice.Citation54 Collectively, the above findings demonstrate that UA alleviated ALD in a microbiota-dependent manner.
In our study, we reveal that administration of B. sartorii, P. distasonis, and A. muciniphila effectively alleviates ER stress through modulation of MUP1 in ALD (). Therapeutic interventions involving A. muciniphila or antibiotics have been shown to confer protection against ALD.Citation40,Citation51 P. distasonis has been reported to attenuate hepatic steatosis in ob/ob and high-fat diet-fed mice models.Citation57 The modulation of metabolites generated by the gut microbiota holds significant importance in ALD development. For instance, SCFA propionic acid has been shown to improve intestinal epithelial barrier dysfunction and ameliorate ALD in mice.Citation58 Indeed, in patients with alcoholic hepatitis as well as mice fed on alcohol, the level of fecal propionate is significantly decreased.Citation59,Citation60 The abundance of SCFA-producing bacterial species from the Clostridiales order exhibited an inverse correlation with alcoholic dependence, whereas cirrhosis was associated with multiple members of the Bacteroidales order.Citation55 In our study, we demonstrate for the first time that UA-enriched B. sartorii, P. distasonis, and A. muciniphila had the potential to enhance propionic acid, thereby activating MUP1 to effectively alleviate ALD (). Propionic acid has the potential to enhance intestinal permeability, thereby inhibiting the LPS-TLR4-NF-κB pathway and eventually leading to amelioration of alcohol-induced liver dysfunction impairment and lipid accumulation.Citation58 The gut microbiota-derived propionic acid may contribute to the alteration of M1/M2 balance in ALD.Citation61 Propionic acid facilitates the regulation of Th17/Treg balance, thereby augmenting its immunomodulatory role.Citation62 Additionally, propionic acid regulates the differentiation of Th17/Treg cells by modulating the GPR43-HDAC6 axis.Citation62 These results suggest that propionate may modulate the Th17/Treg cell balance, thereby potentially ameliorating ALD through the restoration of immune function. Moreover, propionic acid has the potential to activate SCFA receptors located on enteroendocrine cells, thereby inducing the release of glucagon-like peptide-1 (GLP-1) peptides.Citation63–65 It is of note that GLP-1 receptor agonists exhibited the potential to reverse the decline in MUP1 protein levels observed in the urine of mice with NAFLD.Citation48 Similarly, our results indicate that propionic acid has the potential to activate GLP-1 and MUP1. The aforementioned findings suggest that GLP-1 may be an upstream regulator of MUP1, the activation of MUP1 by propionic acid may be mediated through the involvement of GLP-1 in ALD. Our laboratory is currently investigating the molecular mechanism underlying the activation of MUP1 by propionic acid, which represents an intriguing avenue of research. Additionally, we are currently investigating the underlying mechanisms of UA for other alcohol-related diseases such as brain and kidney impairments. It is also important to further investigate the molecules and pathways that transmit microbiota changes into the liver, which could lead to the discovery of new therapeutic targets for ALD.
Our study possesses multiple notable strengths. First of all, we provide a novel insight into the mechanism by which a marked shift in gut microbiota, caused by alcohol, can negatively impact both liver and gut health. Secondly, our findings open up new research avenues into preemptive therapies for ALD that target specific gut microbiota B. sartorii, P. distasonis, A. muciniphila, and their derived SCFA. Finally, we demonstrate for the first time that hepatic MUP1 upregulated by UA could suppress ER stress and serve as a novel therapeutic target for ALD.
Conclusions
Overall, our study reveals that UA exhibited notable efficacy in alleviating ALD through modulating the gut-microbiota-liver axis. Mechanistically, UA significantly enhanced the abundance of B. sartorii, P. distasonis, and A. muciniphila, which increased beneficial metabolite propionic acid to activate MUP1, thereby suppressing ER stress to alleviate ALD. The UA-enriched gut microbiota, serum metabolite, and hepatic target in this study possess the potential to serve as biomarkers, thereby making significant contributions toward future advancements in interventions or drug targets for ALD.
Materials and methods
Mice
Male C57BL/6J mice (18 to 20 g, 6 weeks old) were purchased from Cheng Du Dossy Laboratory Animal Center (Chengdu, China). The mice were housed in SPF laboratory conditions with four mice per cage. They were kept in rooms with humidity and temperature-controlled, following a 12-hour light-dark cycle. The study protocol adhered to the international ethical guidelines and was approved by the Institutional Animal Care and Use Committee of the Institute of Biomedical Research at Northwest A&F University of Technology with ethics approval number XN2023–0704.
Animal experimental design
Animal experiment 1: UA treatment experiment
SPF C57BL/6J male mice aged 6–8 weeks were randomly divided into three groups (n = 10 per group). The Ctrl group received an AIN93M control liquid diet and orally administered sterilized carboxymethylcellulose sodium (CMC-Na) solution. The Alc group and the Alc UA group were administered an alcohol liquid diet, with or without oral gavage of UA at a dosage of 200 mg/kg (purity greater than 98% by HPLC, Nanjing DASF Biotechnology Co., Ltd, Nanjing, China) for 14 weeks.
Animal experiment 2: antibiotics-intervened experiment
SPF C57BL/6J male mice aged 6–8 weeks were randomly divided into four groups (Alc, Alc-Antibiotics, Alc UA, and Alc-Antibiotics UA group, n = 9 per group) and received an AIN93M alcohol liquid diet. Mice in Alc UA and Alc-Antibiotics UA groups received daily oral gavage of UA at a dosage of 200 mg/kg. The Alc and Alc-Antibiotics groups were orally administered sterilized CMC-Na solution via gavage and treated with a broad-spectrum antibiotics cocktail (ampicillin, neomycin, metronidazole: 1 g/L; vancomycin: 0.5 g/L) for two weeks followed by weekly administration until the end of the experiment to deplete the gut microbiota as previously reported.Citation66
Animal experiment 3: FMT experiment
SPF C57BL/6J male mice aged 6–8 weeks were randomly divided into four groups (n = 10 per group). Mice in the Ctrl FMT-Ctrl group and Ctrl FMT-Alc group received an AIN93M control liquid diet and were orally administered fecal suspension from the Ctrl and Alc groups separately. The Alc FMT-Alc and Alc FMT-Alc UA groups received an AIN93M alcohol liquid diet and were orally administered fecal suspension from the Alc and Alc UA groups, separately.
Fresh fecal pellets were promptly collected and transferred to an anaerobic chamber, where they were classified by type to ensure sufficient volume. The fresh fecal sample (1 g) was homogenized in the sterile phosphate-buffered saline (PBS) solution (5 mL). Subsequently, the mixture underwent filtration through a 70-μm strainer to remove large particles. Upon the arrival of recipient mice, they received an antibiotic cocktail incorporated into their liquid diet for 2 weeks before undergoing FMT. Following completion of the antibiotic treatment, mice underwent intestinal purging using PEG 4000 (polytethylene glycol, macrogolum; 59 g/L) supplemented with NaCl: 1.46 g/L; KCl: 0.75 g/L; Na2SO4: 5.68 g/L; NaHCO3: 1.68 g/L to eliminate any residual antibiotics in the intestine.Citation67 FMT was orally administered via gavage using 400 μL of a homogenized fecal slurry with a concentration of 100 mg/mL. During the initial week, FMT was administered once daily to facilitate microbiota engraftment, and thereafter it was given twice weekly.
Animal experiment 4: B. sartorii, P. distasonis, and A. muciniphila treatment experiment
SPF C57BL/6J male mice aged 6–8 weeks were randomly divided into five groups (n = 10 per group). The Ctrl group received an AIN93M control liquid diet and orally administered 200 μL of sterilized PBS per mouse daily for 14 weeks. The Alc group received an AIN93M alcohol liquid diet and orally administered 200 μL of sterilized PBS per mouse daily for 14 weeks. The B. sartorii, P. distasonis, and A. muciniphila groups received an AIN93M alcohol liquid diet with oral gavage of B. sartorii (5 × 10⁹ cfu/mL disinfected PBS), P. distasonis (5 × 10⁹ cfu/mL disinfected PBS), and A. muciniphila (5 × 10⁹ cfu/mL disinfected PBS) respectively, per mouse daily for 14 weeks.
Animal experiment 5: UA and antibiotic-intervened experiment on non-alcoholic mice
Male SPF C57BL/6J mice aged 6–8 weeks were randomly divided into four groups (Ctrl, C-Antibiotics, C UA, and C-Antibiotics UA group, n = 9 per group) and received an AIN93M control liquid diet. Mice in C UA and C-Antibiotics UA groups received daily oral gavage of UA at a dosage of 200 mg/kg. Mice in Ctrl and C-Antibiotics groups received oral gavage of sterilized CMC-Na solution and were treated with a broad-spectrum antibiotics cocktail (ampicillin, neomycin, metronidazole: 1 g/L; vancomycin: 0.5 g/L) for two weeks followed by weekly administration until the end of the experiment.
Metabolic cage studies
Mice were individually housed in metabolic cages (Columbus Instruments, Columbus, OH, USA) at a constant room temperature of 22 ± 2°C for 24 hours to allow acclimation. Oxygen consumption (VO2), carbon dioxide production (VCO2), and respiratory exchange ratio (RER) were measured every five minutes. The RER was calculated by dividing VCO2 by VO2, and energy expenditure was determined as (3.815 + 1.232 × RER) × VO2, expressed in kcal per hour. The analysis incorporated total body weight as a covariate.
Oral glucose tolerance test
The mice were fasted for 12 hours before the tests. The glucose (0.2 g/ml) was injected, and blood glucose was measured before (0 min) and after the injection (15, 30, 60, 120 min) using a OneTouch® SelectSimpleTM glucometer (LifeScan Inc., China). For other content analysis in plasma, all reagents and kits sources and identifiers were listed in Supplementary Table S1.
Insulin tolerance test
The mice were fasted for 6 hours before the tests. The insulin (0.75 U/kg, Sigma Aldrich, USA) was injected, and blood glucose was measured before (0 min) and after the injection (15, 30, 60, 120 min) using a OneTouch® SelectSimpleTM glucometer (LifeScan Inc., China). For other content analysis in plasma, all reagents and kits sources and identifiers were listed in Supplementary Table S1.
Biochemical assays
Plasma was obtained after fasting for 12 hours by harvesting blood from the inferior cava veins of mice into tubes, followed by centrifugation for 10 min at 3000 rpm and 4°C. The levels of ALT, AST and TG in plasma were determined using commercial kits (Nanjing Jiancheng Bioengineering Institute, Nanjing, China).
H&E staining and Alcian blue staining
The liver tissues of the sacrificed mice were immediately fixed in a 4% paraformaldehyde fixation solution for 24 hours followed by dehydration. After embedding in paraffin wax, the wax block was sectioned into 5 μm slices using a microtome and subsequently mounted onto an anti-slip slide. The slices were baked in a 60°C incubator for 4 hours and then used for H&E staining and Alcian blue staining.
For H&E staining, the liver tissue sections were deparaffinized and rehydrated: sections were placed in xylene I and xylene II successively for 10 min, and then treated in the following gradient ethanol solution successively for 5 min: 100% I, 100% II, 90%, 80%, 70% (V/V). After that, they were washed three times with PBS for 6 min. The slides were stained in hematoxylin for 5 min, then removed from the hematoxylin and washed in tap water for 1 min. Then, the slides were differentiated with 1% hydrochloric acid alcohol solution for 20 sec, rinsed with running water for 1 min, and then reversed blue with 1% dilute ammonia water for 30 sec. Finally, the slides were dehydrated in 85%, 90%, 95%, and 100% ethanol, and finally treated in xylene for 2 min. After sealing with neutral resin and drying, slides were observed and photographed under a light microscope.
For Alcian blue staining, the procedure was performed according to the instructions of the Alcian Blue staining kit: Paraffin sections of the colon were routinely processed for dewaxing in xylene, followed by rehydration with gradient ethanol, and distilled water; The slides were immersed in Alcian acidifying solution for 3 min, followed by Alcian staining solution for 15–30 min, and rinsed with running water for 5 min. Then, the slides were counterstained with nuclear solid red staining solution for 10 min, rinsed with running water for 1 min, dehydrated with gradient ethanol solution and transparently processed in xylene, and finally sealed with neutral gum. The Length of villi and number of goblet cells were measured by Image J software (developed by Wayne Rasband from NIH, USA) after pictures were recorded by light phase contrast microscopy.
Immunohistochemistry and immunofluorescence staining
The fixed liver sections were incubated with primary antibodies at 4°C overnight. The sections were subsequently washed three times in PBS after incubation, then incubated with a biotinylated secondary antibody at room temperature for 25 min, and washed with PBS for three times. The sections were subsequently mounted with a Mounting Medium containing DAPI. Immunofluorescence images and IHC staining images were obtained using an inverted fluorescent microscope (Olympus, Tokyo, Japan).
Transfection of Mup1 siRNA and in vitro assessment
Human liver cell line HepG2 was purchased from the Shanghai Institute of Cell Biology (Shanghai, China). HepG2 cells were routinely cultured in 5 mM glucose DMEM medium (Hyclone, Logan, USA) supplemented with 10% fetal bovine serum (Gibco, USA), 100 units/mL of penicillin, 100 μg/mL of streptomycin and GlutaMAX (Solarbio, China) at 37°C in a humidified atmosphere containing 5% CO2. Cultured cells were further treated with 200 mM alcohol for 24 hours in the presence or absence of 20 μM UA. Mup1-specific siRNA and negative controls for the knockdown experiment were purchased from Sangon Biotechnology (Shanghai, China). The oligonucleotide sequences of Mup1 siRNA were as follows: 1) sense, 5’-UUC UCC GAA CGU GUC ACG UTT-3’; 2) antisense, 5’-ACG UGA CAC GUU CGG AGA ATT-3’. HepG2 cells were transfected with Mup1 siRNA or negative control using Lipo8000 (Beyotime, China) in six-well plates following the manufacturer’s instructions. After incubating with the siRNA complex for 24 hours, the transfected cells were collected for further analysis.
RNA isolation and real-time qPCR
Total RNA was extracted from liver tissues using the SteadyPure Universal RNA Extraction Kit II (Accurate Biotechnology, Hunan, China). The concentration of RNA was determined using the Nano Drop 2000/2000C (Thermo Scientific; Waltham, MA, USA), and total RNA was reverse-transcribed to complementary DNA (cDNA) using the Evo M-MLV RT Mix Kit with gDNA Clean for qPCR Ver.2 (Accurate Biotechnology, Hunan, China) for qRT-PCR. Following the manufacturer’s protocol, a maximum of 100 ng total RNA was utilized in 20 μL reactions. The mRNA expression was quantified using the SYBR® Green Premix Pro Taq HS qPCR Kit (Accurate Biotechnology, Hunan, China) on a CFX96 Touch apparatus (Bio-Rad, Hercules, CA, USA), with the primers synthesized by Sangon Biotechnology (Shanghai, China) shown in Supplementary Table S2. The PCR conditions were as follows: 95°C for 30 sec, followed by 40 circles of 5 sec at 95°C and 30 sec at 60°C. The differences in transcript levels were quantified by normalizing each amplicon to β-actin, and the relative gene expression was calculated using the 2-△△Ct method.
Western blots
The protein of the intestine and liver tissues was extracted using a RIPA buffer supplemented with 1 mM phenylmethylsulfonyl fluoride (PMSF) and a protease inhibitor cocktail. The total tissue proteins (n = 3) were separated using SDS-polyacrylamide gel electrophoresis (SDS-PAGE) and subsequently transferred onto a polyvinylidene fluoride (PVDF) membrane through a wet transfer apparatus. The membranes were blocked and probed with appropriate primary antibodies at 4°C overnight, followed by incubating with the corresponding secondary antibodies. The immunoreactive bands were visualized with enhanced ECL detection reagents. Detailed information of the primary antibodies is shown in Supplementary Table S1. The protein bands were quantified using Image J (National Institutes of Health, Bethesda, MD, USA), normalized to β-actin.
Fecal short-chain fatty acids assay
The concentrations of SCFAs (acetic acid, propionic acid, and butyric acid) were determined as follows. The fecal sample of each mouse, weighing approximately 200 mg, was vigorously vortexed with 1 mL of distilled water after homogenization. The samples were subsequently mixed with 150 μL of 50% (w/w) H2SO4, followed by the addition of 1.6 mL of diethyl ether. The suspensions were incubated on ice for 30 min to extract SCFAs, and then subjected to centrifugation at 8000 rpm for 5 minutes at a temperature of 4°C. Finally, the organic phase was collected and analyzed using a Shimadzu GC-2014C gas chromatograph (Shimadzu Corporation, Kyoto, Japan) equipped with a DB-FFAP capillary column (30 m x 0.25 mm x 0.25 mm) from Agilent Technologies (Wilmington, DE, USA), with detection performed by flame ionization. The initial temperature was maintained at 50°C for 3 min and then gradually increased to 130°C at a rate of 10°C per min. Subsequently, it further rose to 170°C at a rate of 5°C per min and reached a final temperature of 220°C with an increase of 15°C per min. The final temperature was held constant for 3 min. The injector was maintained at a temperature of 250°C, while the detector was set to 270°C.
Fecal 16S rRNA amplicon sequencing and microbiome analysis
The fecal samples were collected from the respective groups and stored at −80°C until DNA extraction. Subsequently, total cellular DNA was extracted using the E.Z.N.A. Stool DNA Kit (Omega, Norcross, GA, USA) according to the instructions. The quantification of genomic DNA was confirmed using a Qubit 4 Fluorometer by using a Qubit dsDNA BR Assay kit (Invitrogen, USA), while quality was assessed by analyzing an aliquot on 1% agarose gel. Qualified genomic DNA samples underwent processing for the preparation of 16S rRNA libraries. The amplification of bacterial hypervariable V3–V4 region of 16S rRNA was performed using specific primers: 341_F: 50-ACTCCTACGGGAGGCAGCAG-30 and 806_R: 50-GGACTACHVGGGTWTCTAAT-30. The validated library was used for sequencing on HiSeq2500 (Illumina, CA, USA) to generate 23,300 bp paired-end reads. The high-quality paired-end reads were merged into tags based on overlaps by FLASH (Fast Length Adjustment of Short reads, v1.2.11), and subsequently clustered into operational taxonomic units (OTUs) at a similarity cutoff value of 97% using USEARCH (v7.0.1090). Chimeric sequences were identified by comparing them with the Gold database using UCHIME (v4.2.40). The representative sequences of OTUs were taxonomically classified using the Ribosomal Database Project Classifier (v2.2) with a minimum confidence threshold of 0.6 and then mapped to the Greengenes database (v201305). Principal coordinates analysis was conducted in R (v3.5.2) at the OTU level to calculate both unweighted and weighted UniFrac distance, followed by a PERMANOVA test (Vegan: Adonis) for detecting differences between intervention groups. Alpha diversity was assessed in R (v3.2.1) at the OTU level using the Wilcoxon rank-sum test. The Wilcoxon rank-sum test was employed for differential abundance analysis. Spearman’s rank correlations were used to determine the correlation, and multiple comparison corrections were performed using the cor test in R (v3.5.2). Statistical significance was defined as a p-value <.05.
RNA sequencing analysis
Liver tissues were macro-dissected and stored at −80°C until RNA extraction. The mRNA Library Preparation method is as follows: the appropriate quality inspection testing methods were selected based on sample and product requirements. A specific amount of RNA samples was denatured at an optimal temperature to unfold their secondary structure, followed by enrichment of mRNA using oligo (dT) -attached magnetic beads. The reaction system was configured, followed by incubation at an optimal temperature for a predetermined duration to induce RNA fragmentation. Subsequently, the first-strand synthesis reaction system was prepared and the reaction program was established to synthesize the first-strand cDNA. Furthermore, the second-strand synthesis reaction system was prepared and its corresponding reaction program was set up for synthesizing the second-strand cDNA. After configuring and setting up the reaction system and program, end-repair was performed on the double-stranded cDNA fragments, followed by the addition of a single ‘A’ nucleotide to the 3’ ends of the blunt fragments. Subsequently, adaptors were ligated with the cDNAs using a configured and set up reaction system and program. The PCR reaction system and program were configured and optimized for efficient product amplification. The selection of the corresponding library quality control protocol will be based on specific product requirements. Denaturation is employed to generate single-stranded PCR products, followed by the configuration and setup of the reaction system and program for circularization. Single-stranded cyclized products are generated, while linear DNA molecules that have not undergone cyclization are enzymatically degraded. Rolling circle amplification facilitates the replication of single-stranded circular DNA molecules, leading to the generation of a DNA nanoball (DNB) containing multiple copies of the genetic material. The high-intensity DNA nanochip technique is employed to load patterned nanoarrays with DNBs of sufficient quality, followed by sequencing through combinatorial Probe-Anchor Synthesis (cPAS). Subsequently, the obtained sequencing data undergoes filtration using SOAPnuke. The subsequent analysis and data mining are conducted on Dr. Tom’s Multi-omics Data Mining System. The clean reads were aligned to the gene set using Bowtie2, encompassing both known and novel transcripts, including coding and noncoding sequences. RSEM (v1.3.1) was employed for calculating the gene’s expression level. The heatmap was generated using the heatmap (v1.0.8) software, based on the differential gene expression observed across various samples. Specifically, we performed differential expression analysis using DESeq2 (v1.4.5), DEGseq, or PoissonDis with a significance threshold of Q value ≤ 0.05 or FDR ≤ 0.001. To gain insights into the phenotypic changes, we performed Gene Ontology (GO) and Kyoto Encyclopedia of Genes and Genomes (KEGG) enrichment analyses on annotated differentially expressed genes using Phyper, a Hypergeometric test-based tool (https://en.wikipedia.org/wiki/Hypergeometric_distribution). The significance levels of terms and pathways were adjusted using a stringent threshold for Q value correction (Q value ≤ 0.05).
Microbial strain and cultivation
All bacteria strains were purchased from BeNa Biotechnology (BNCC, Beijing, China). Akkermansia muciniphila (ATCC BAA-835) was anaerobically cultured in BHI broth supplemented with 1% mucin (M2378, Sigma-Aldrich) and 1‰ L-Cysteine (C0012, Solarbio, Beijing, China). The anaerobic culture of Bacteroides sartorii (JCM 17,136) was performed on blood agar plates (24070, HuanKai Microbial, Guangdong, China) for 48 hours. Similarly, Parabacteroides distasonis (DSM 20,701) was cultured under anaerobic conditions on Columbia blood agar plates (PB003A, LAND BRIDGE, Beijing, China) for the same period. The bacteria were collected and suspended in sterile PBS, then adjusted to an optical density of 1.0 at 600 nm (OD600), and subsequently administered to the animals via oral gavage.
Quantification and statistical analysis
Statistical analysis was described in each figure legend. GraphPad Prism 9.0 (GraphPad Software Inc, San Diego, CA, USA) was used for the data analysis. Except for 16S rRNA and RNA sequencing, all data were presented as mean ± SEM. Significant differences between mean values were determined by one-way ANOVA and Student’s t-test. The data from antibiotic treatment experiments were subjected to a two-way ANOVA, with UA and antibiotics being treated as the independent variables. Other software information employed in this study is deposited in Supplementary Information. The measurements were obtained from distinct samples and statistical significance was determined at a p-value threshold of 0.05.
Author contribution
M. W., Z. L., L. G. and H. Z. designed the experiments; H. Z., C. L. (Chaoyue Li) and Y. X. performed the experiments and analyzed the data; H. Z., M. W., Z. L., and L. G. wrote the manuscript; H. Z. and C. L. (Chaoyue Li)prepared the figures; L. H., J. B. and C. L. (Chao Liu) reviewed and edited the manuscript, L. G., Z. L., and M. W. supervised the work. All authors approved the final version of the manuscript.
Supplementary Material clean.docx
Download MS Word (4.8 MB)Acknowledgments
The authors would like to acknowledge the financial support provided by the China Agriculture Research System (CARS-08-E2-01), and the Natural Science Foundation of China (32001701).
Disclosure statement
No potential conflict of interest was reported by the author(s).
Data availability statement
The raw data of RNA sequencing in the current study were deposited on GEO, and the accession number is GSE253307. The accession number for the entire 16S rRNA sequencing dataset reported in this manuscript is NCBI Bio Project: PRJNA1065023.
Original data have been deposited to Mendeley Data, the DOI number is 10.17632/84nnnpx8d8.2.
Supplementary material
Supplemental data for this article can be accessed online at https://doi.org/10.1080/19490976.2024.2367342
Additional information
Funding
References
- Lackner C, Tiniakos D. Fibrosis and alcohol-related liver disease. J Hepatol. 2019;70(2):294–23. doi:10.1016/j.jhep.2018.12.003.
- Gustot T, Jalan R. Acute-on-chronic liver failure in patients with alcohol-related liver disease. J Hepatol. 2019;70(2):319–327. doi:10.1016/j.jhep.2018.12.008.
- Avila MA, Dufour JF, Gerbes AL, Zoulim F, Bataller R, Burra P, Cortez-Pinto H, Gao B, Gilmore I, Mathurin P. et al. Recent advances in alcohol-related liver disease (ALD): summary of a gut round table meeting. Gut. 2020;69(4):764–780. doi:10.1136/gutjnl-2019-319720.
- Szabo G, Kamath PS, Shah VH, Thursz M, Mathurin P. Alcohol-related liver disease: areas of consensus, unmet needs and opportunities for further study. Hepatology. 2019;69(5):2271–2283. doi:10.1002/hep.30369.
- Vos T. Global burden of 369 diseases and injuries in 204 countries and territories, 1990-2019: a systematic analysis for the global burden of disease study 2019. Lancet. 2020;396(10262):1562–1562. doi:10.1016/s0140-6736(20)30925-9.
- Huang DQ, Singal AG, Kono Y, Tan DJH, El-Serag HB, Loomba R. Changing global epidemiology of liver cancer from 2010 to 2019: NASH is the fastest growing cause of liver cancer. Cell Metab. 2022;34(7):969–977.e2. doi:10.1016/j.cmet.2022.05.003.
- Manthey J, Shield KD, Rylett M, Hasan OSM, Probst C, Rehm J. Global alcohol exposure between 1990 and 2017 and forecasts until 2030: a modelling study. Lancet. 2019;393(10190):2493–2502. doi:10.1016/S0140-6736(18)32744-2.
- Arab JP, Diaz LA, Baeza N, Idalsoaga F, Fuentes-Lopez E, Arnold J, Ramirez CA, Morales-Arraez D, Ventura-Cots M, Alvarado-Tapias E. et al. Identification of optimal therapeutic window for steroid use in severe alcohol-associated hepatitis: a worldwide study. J Hepatol. 2021;75(5):1026–1033. doi:10.1016/j.jhep.2021.06.019.
- Gao B, Bataller R. Alcoholic liver disease: pathogenesis and new therapeutic targets. Gastroenterology. 2011;141(5):1572–1585. doi:10.1053/j.gastro.2011.09.002.
- Szabo G. Gut–liver axis in alcoholic liver disease. Gastroenterology. 2015;148(1):30–36. doi:10.1053/j.gastro.2014.10.042.
- Keshavarzian A, Farhadi A, Forsyth CB, Rangan J, Jakate S, Shaikh M, Banan A, Fields JZ. Evidence that chronic alcohol exposure promotes intestinal oxidative stress, intestinal hyperpermeability and endotoxemia prior to development of alcoholic steatohepatitis in rats. J Hepatol. 2009;50(3):538–547. doi:10.1016/j.jhep.2008.10.028.
- Leclercq S, Matamoros S, Cani PD, Neyrinck AM, Jamar F, Starkel P, Windey K, Tremaroli V, Backhed F, Verbeke K. et al. Intestinal permeability, gut-bacterial dysbiosis, and behavioral markers of alcohol-dependence severity. Proc Natl Acad Sci USA. 2014;111(42):E4485–E4493. doi:10.1073/pnas.1415174111.
- Yan AW, Fouts DE, Brandl J, Starkel P, Torralba M, Schott E, Tsukamoto H, Nelson KE, Brenner DA, Schnabl B. Enteric dysbiosis associated with a mouse model of alcoholic liver disease. Hepatology. 2011;53(1):96–105. doi:10.1002/hep.24018.
- Parlesak A, Schafer C, Schutz T, Bode JC, Bode C. Increased intestinal permeability to macromolecules and endotoxemia in patients with chronic alcohol abuse in different stages of alcohol-induced liver disease. J Hepatol. 2000;32(5):742–747. doi:10.1016/S0168-8278(00)80242-1.
- Bajaj JS, Heuman DM, Hylemon PB, Sanyal AJ, White MB, Monteith P, Noble NA, Unser AB, Daita K, Fisher AR. et al. Altered profile of human gut microbiome is associated with cirrhosis and its complications. J Hepatol. 2014;60(5):940–947. doi:10.1016/j.jhep.2013.12.019.
- Israelsen M, Alvarez-Silva C, Madsen BS, Hansen CD, Torp NC, Johansen S, Hansen JK, Lindvig KP, Insonere J, Riviere V. et al. Impact of acute alcohol consumption on circulating microbiome in asymptomatic alcohol-related liver disease. Gut. 2023;73(6):1041–1044. doi:10.1136/gutjnl-2023-330360.
- Xiang QW, Li MF, Wen JY, Ren FJ, Yang Z, Jiang XY, Chen Y. The bioactivity and applications of pomegranate peel extract: a review. J Food Biochem. 2022;46(7). doi:10.1111/jfbc.14105.
- Heber D. Multitargeted therapy of cancer by ellagitannins. Cancer Lett. 2008;269(2):262–268. doi:10.1016/j.canlet.2008.03.043.
- Sharifi-Rad J, Quispe C, Castillo CMS, Caroca R, Lazo-Velez MA, Antonyak H, Polishchuk A, Lysiuk R, Oliinyk P, De Masi L. et al. Ellagic acid: a review on its natural sources, chemical stability, and therapeutic potential. Oxid Med Cell Longev. 2022;2022:1–24. doi:10.1155/2022/3848084.
- Andreux PA, Blanco-Bose W, Ryu D, Burdet F, Ibberson M, Aebischer P, Auwerx J, Singh A, Rinsch C. The mitophagy activator urolithin a is safe and induces a molecular signature of improved mitochondrial and cellular health in humans. Nat Metab. 2019;1(6):595–603. doi:10.1038/s42255-019-0073-4.
- Cerda B, Periago P, Espin JC, Tomas-Barberan FA. Identification of urolithin a as a metabolite produced by human colon microflora from ellagic acid and related compounds. J Agric Food Chem. 2005;53(14):5571–5576. doi:10.1021/jf050384i.
- Selma MV, Beltran D, Garcia-Villalba R, Espin JC, Tomas-Barberan FA. Description of urolithin production capacity from ellagic acid of two human intestinal Gordonibacter species. Food Funct. 2014;5(8):1779–1784. doi:10.1039/c4fo00092g.
- Espin JC, Larrosa M, Garcia-Conesa MT, Tomas-Barberan F. Biological significance of urolithins, the gut microbial ellagic acid-derived metabolites: the evidence so far. Evid Based Complement Alternat Med. 2013;2013(9):1–15. doi:10.1155/2013/270418.
- Ishimoto H, Shibata M, Myojin Y, Ito H, Sugimoto Y, Tai A, Hatano T. In vivo anti-inflammatory and antioxidant properties of ellagitannin metabolite urolithin a. Bioorg Med Chem Lett. 2011;21(19):5901–5904. doi:10.1016/j.bmcl.2011.07.086.
- Cerdá B, Periago P, Espín JC, Tomás-Barberán FA. Identification of urolithin a as a metabolite produced by human colon microflora from ellagic acid and related compounds. J Agric Food Chem. 2005;53(14):5571–5576. doi:10.1021/jf050384i.
- Singh R, Chandrashekharappa S, Bodduluri SR, Baby BV, Hegde B, Kotla NG, Hiwale AA, Saiyed T, Patel P, Vijay-Kumar M. Enhancement of the gut barrier integrity by a microbial metabolite through the Nrf2 pathway. Nat Commun. 2019;10(1):1–18. doi:10.1038/s41467-018-07859-7.
- Zhang C, Song YY, Yuan M, Chen L, Zhang QY, Hu JJ, Meng Y, Li S, Zheng GH, Qiu ZP. Ellagitannins-derived intestinal microbial metabolite urolithin a ameliorates fructose-driven hepatosteatosis by suppressing hepatic lipid metabolic reprogramming and inducing lipophagy. J Agric Food Chem. 2023;71(9):3967–3980. doi:10.1021/acs.jafc.2c05776.
- Karim S, Madani B, Burzangi AS, Alsieni M, Bazuhair MA, Jamal M, Daghistani H, Barasheed MO, Alkreathy H, Khan MA. et al. Urolithin A’s antioxidative, anti-inflammatory, and antiapoptotic activities mitigate doxorubicin-induced liver injury in Wistar rats. Biomedicines. 2023;11(4):1125. doi:10.3390/biomedicines11041125.
- Ryu D, Mouchiroud L, Andreux PA, Katsyuba E, Moullan N, Nicolet-Dit-Felix AA, Williams EG, Jha P, Lo Sasso G, Huzard D. et al. Urolithin a induces mitophagy and prolongs lifespan in C-elegans and increases muscle function in rodents. Nat Med. 2016;22(8):879–888. doi:10.1038/nm.4132.
- Yang JP, Guo YQ, Henning SM, Chan B, Long JF, Zhong J, Acin-Perez R, Petcherski A, Shirihai O, Heber D. et al. Front cover: ellagic acid and its microbial metabolite urolithin a alleviate diet-induced insulin resistance in mice. Mol Nutr Food Res. 2020;64(19). doi:10.1002/mnfr.202070043.
- Xia B, Shi XC, Xie BC, Zhu MQ, Chen Y, Chu XY, Cai GH, Liu M, Yang SZ, Mitchell GA. et al. Urolithin a exerts antiobesity effects through enhancing adipose tissue thermogenesis in mice. PLOS Biol. 2020;18(3):e3000688. doi:10.1371/journal.pbio.3000688.
- Fang EF, Hou Y, Palikaras K, Adriaanse BA, Kerr JS, Yang B, Lautrup S, Hasan-Olive MM, Caponio D, Dan X. Mitophagy inhibits amyloid-β and tau pathology and reverses cognitive deficits in models of Alzheimer’s disease. Nat Neurosci. 2019;22(3):401–412. doi:10.1038/s41593-018-0332-9.
- Zhao R, Long X, Yang J, Du L, Zhang X, Li J, Hou C. Pomegranate peel polyphenols reduce chronic low-grade inflammatory responses by modulating gut microbiota and decreasing colonic tissue damage in rats fed a high-fat diet. Food Funct. 2019;10(12):8273–8285. doi:10.1039/C9FO02077B.
- Abdulrahman AO, Alzubaidi MY, Nadeem MS, Khan JA, Rather IA, Khan MI. Effects of urolithins on obesity-associated gut dysbiosis in rats fed on a high-fat diet. Int J Food Sci Nutr. 2021;72(7):923–934. doi:10.1080/09637486.2021.1886255.
- Ma MX, Wang YX, Fan SQ, Huang YM, Su XR, Lu CY. Urolithin a alleviates colitis in mice by improving gut microbiota dysbiosis, modulating microbial tryptophan metabolism, and triggering AhR activation. J Agric Food Chem. 2023;71(20):7710–7722. doi:10.1021/acs.jafc.3c00830.
- Romo-Vaquero M, Fernandez-Villalba E, Gil-Martinez A-L, Cuenca-Bermejo L, Carlos Espin J, Trinidad Herrero M, Victoria Selma M. Urolithins: potential biomarkers of gut dysbiosis and disease stage in Parkinson’s patients. Food Funct. 2022;13(11):6306–6316. doi:10.1039/D2FO00552B.
- Yu Z-H, Cao M, Wang Y-X, Yan S-Y, Qing L-T, Wu C-M, Li S, Li T-Y, Chen Q, Zhao J. Urolithin a attenuates Helicobacter pylori-induced damage in vivo. J Agric Food Chem. 2022;70(38):11981–11993. doi:10.1021/acs.jafc.2c03711.
- Longato L, Ripp K, Setshedi M, Dostalek M, Akhlaghi F, Branda M, Wands JR, de la Monte SM. Insulin resistance, ceramide accumulation, and endoplasmic reticulum stress in human chronic alcohol-related liver disease. Oxid Med Cell Longev. 2012;2012(2012):1–17. doi:10.1155/2012/479348.
- Tilg H, Adolph TE, Trauner M. Gut-liver axis: pathophysiological concepts and clinical implications. Cell Metab. 2022;34(11):1700–1718. doi:10.1016/j.cmet.2022.09.017.
- Grander C, Adolph TE, Wieser V, Lowe P, Wrzosek L, Gyongyosi B, Ward DV, Grabherr F, Gerner RR, Pfister A. et al. Recovery of ethanol-induced Akkermansia muciniphila depletion ameliorates alcoholic liver disease. Gut. 2018;67(5):891–901. doi:10.1136/gutjnl-2016-313432.
- Tilg H, Cani PD, Mayer EA. Gut microbiome and liver diseases. Gut. 2016;65(12):2035–2044. doi:10.1136/gutjnl-2016-312729.
- Wang LR, Fouts DE, Starkel P, Hartmann P, Chen P, Llorente C, DePew J, Moncera K, Ho SB, Brenner DA. et al. Intestinal REG3 lectins protect against alcoholic steatohepatitis by reducing mucosa-associated microbiota and preventing bacterial translocation. Cell Host Microbe. 2016;19(2):227–239. doi:10.1016/j.chom.2016.01.003.
- Villalobos-Labra R, Subiabre M, Toledo F, Pardo F, Sobrevia L. Endoplasmic reticulum stress and development of insulin resistance in adipose, skeletal, liver, and foetoplacental tissue in diabesity. Mol Aspects Med. 2019;66(0):49–61. doi:10.1016/j.mam.2018.11.001.
- Hotamisligil GS. Endoplasmic reticulum stress and the inflammatory basis of metabolic disease. Cell. 2010;140(6):900–917. doi:10.1016/j.cell.2010.02.034.
- Lebeaupin C, Vallee D, Hazari Y, Hetz C, Chevet E, Bailly-Maitre B. Endoplasmic reticulum stress signalling and the pathogenesis of non-alcoholic fatty liver disease. J Hepatol. 2018;69(4):927–947. doi:10.1016/j.jhep.2018.06.008.
- Haotian M, Chen SH, Xiong HY, Wang M, Hang W, Zhu XL, Zheng YB, Ge BS, Li RZ, Cui HL. Astaxanthin from Haematococcus pluvialis ameliorates the chemotherapeutic drug (doxorubicin) induced liver injury through the Keap1/Nrf2/HO-1 pathway in mice. Food Funct. 2020;11(5):4659–4671. doi:10.1039/C9FO02429H.
- Wang BY, Gao XL, Liu BG, Li YC, Bai M, Zhang ZQ, Xu EP, Xiong ZE, Hu YL. Protective effects of curcumin against chronic alcohol-induced liver injury in mice through modulating mitochondrial dysfunction and inhibiting endoplasmic reticulum stress. Food Nutr Res. 2019;63(0):1–13. doi:10.29219/fnr.v63.3567.
- Gao R, Wang HT, Li T, Wang J, Ren ZT, Cai N, Ai HY, Li SS, Lu Y, Zhu YH. et al. Secreted MUP1 that reduced under ER stress attenuates ER stress induced insulin resistance through suppressing protein synthesis in hepatocytes. Pharmacol Res. 2023;187:106585. doi:10.1016/j.phrs.2022.106585.
- Cao XL, Wan H, Wan H. Urolithin a induces protective autophagy to alleviate inflammation, oxidative stress, and endoplasmic reticulum stress in pediatric pneumonia. Allergol Immunopathol (Madr). 2022;50(6):147–153. doi:10.15586/aei.v50i6.743.
- Zhang YZ, Aisker G, Dong HY, Halemahebai G, Zhang Y, Tian LA. Urolithin a suppresses glucolipotoxicity-induced ER stress and TXNIP/NLRP3/IL-1β inflammation signal in pancreatic β cells by regulating AMPK and autophagy. Phytomedicine. 2021;93:153741. doi:10.1016/j.phymed.2021.153741.
- Sarin SK, Pande A, Schnabl B. Microbiome as a therapeutic target in alcohol-related liver disease. J Hepatol. 2019;70(2):260–272. doi:10.1016/j.jhep.2018.10.019.
- Lang S, Schnabl B. Microbiota and fatty liver disease—the known, the unknown, and the future. Cell Host Microbe. 2020;28(2):233–244. doi:10.1016/j.chom.2020.07.007.
- Schnabl B, Brenner DA. Interactions between the intestinal microbiome and liver diseases. Gastroenterology. 2014;146(6):1513–1524. doi:10.1053/j.gastro.2014.01.020.
- Ferrere G, Wrzosek L, Cailleux F, Turpin W, Puchois V, Spatz M, Ciocan D, Rainteau D, Humbert L, Hugot C. et al. Fecal microbiota manipulation prevents dysbiosis and alcohol-induced liver injury in mice. J Hepatol. 2017;66(4):806–815. doi:10.1016/j.jhep.2016.11.008.
- Dubinkina VB, Tyakht AV, Odintsova VY, Yarygin KS, Kovarsky BA, Pavlenko AV, Ischenko DS, Popenko AS, Alexeev DG, Taraskina AY. et al. Links of gut microbiota composition with alcohol dependence syndrome and alcoholic liver disease. Microbiome. 2017;5(1):141. doi:10.1186/s40168-017-0359-2.
- Chen LY, Chu HK, Hu LL, Li ZL, Yang L, Hou XH. The role of NADPH oxidase 1 in alcohol-induced oxidative stress injury of intestinal epithelial cells. Cell Biol Toxicol. 2022;39(5):2345–2364. doi:10.1007/s10565-022-09725-1.
- Wang K, Liao MF, Zhou N, Bao L, Ma K, Zheng ZY, Wang YJ, Liu C, Wang WZ, Wang J. et al. Parabacteroides distasonis alleviates obesity and metabolic dysfunctions via production of succinate and secondary bile acids. Cell Rep. 2019;26(1):222–235.e5. doi:10.1016/j.celrep.2018.12.028.
- Xu Q, Zhang RS, Mu Y, Song Y, Hao N, Wei YB, Wang QB, Mackay CR. Propionate ameliorates alcohol-induced liver injury in mice via the gut–liver axis: focus on the improvement of intestinal permeability. J Agric Food Chem. 2022;70(20):6084–6096. doi:10.1021/acs.jafc.2c00633.
- Smirnova E, Puri P, Muthiah MD, Daitya K, Brown R, Chalasani N, Liangpunsakul S, Shah VH, Gelow K, Siddiqui MS. et al. Fecal microbiome distinguishes alcohol consumption from alcoholic hepatitis but does not discriminate disease severity. Hepatology. 2020;72(1):271–286. doi:10.1002/hep.31178.
- Xie GX, Zhong W, Zheng XJ, Li Q, Qiu YP, Li HK, Chen HY, Zhou ZX, Jia W. Chronic ethanol consumption alters mammalian gastrointestinal content metabolites. J Proteome Res. 2013;12(7):3297–3306. doi:10.1021/pr400362z.
- Wang Z, Zhang XX, Zhu LL, Yang XL, He F, Wang T, Bao T, Lu HX, Wang H, Yang SQ. Inulin alleviates inflammation of alcoholic liver disease via SCFAs-inducing suppression of M1 and facilitation of M2 macrophages in mice. Int Immunopharmacol. 2020;78:78. doi:10.1016/j.intimp.2019.106062.
- Du HX, Yue SY, Niu D, Liu C, Zhang LG, Chen J, Chen Y, Guan Y, Hua XL, Li C. et al. Gut microflora modulates Th17/Treg cell differentiation in experimental autoimmune prostatitis via the short-chain fatty acid propionate. Front Immunol. 2022;13:13. doi:10.3389/fimmu.2022.915218.
- Christiansen CB, Gabe MBN, Svendsen B, Dragsted LO, Rosenkilde MM, Holst JJ. The impact of short-chain fatty acids on GLP-1 and PYY secretion from the isolated perfused rat colon. Am J Physiol-Gastr L. 2018;315(1):G53–G65. doi:10.1152/ajpgi.00346.2017.
- Psichas A, Sleeth ML, Murphy KG, Brooks L, Bewick GA, Hanyaloglu AC, Ghatei MA, Bloom SR, Frost G. The short chain fatty acid propionate stimulates GLP-1 and PYY secretion via free fatty acid receptor 2 in rodents. Int J Obes. 2015;39(3):424–429. doi:10.1038/ijo.2014.153.
- Larraufie P, Martin-Gallausiaux C, Lapaque N, Dore J, Gribble FM, Reimann F, Blottiere HM. SCFAs strongly stimulate PYY production in human enteroendocrine cells. Sci Rep. 2018;8(1):74. doi:10.1038/s41598-017-18259-0.
- Liu XN, Li X, Xia B, Jin X, Zou QH, Zeng ZH, Zhao WY, Yan SK, Li L, Yuan SF. et al. High-fiber diet mitigates maternal obesity-induced cognitive and social dysfunction in the offspring via gut-brain axis. Cell Metab. 2021;33(5):923–938.e6. doi:10.1016/j.cmet.2021.02.002.
- Leclercq S, Le Roy T, Furgiuele S, Coste V, Bindels LB, Leyrolle Q, Neyrinck AM, Quoilin C, Amadieu C, Petit G. et al. Gut microbiota-induced changes in β-hydroxybutyrate metabolism are linked to altered sociability and depression in alcohol use disorder. Cell Rep. 2020;33(2):108238. doi:10.1016/j.celrep.2020.108238.