
 ?Mathematical formulae have been encoded as MathML and are displayed in this HTML version using MathJax in order to improve their display. Uncheck the box to turn MathJax off. This feature requires Javascript. Click on a formula to zoom.
Abstract
In the study of interphase chromosome organization, genome-wide chromosome conformation capture (Hi-C) maps are often generated using 2-dimensional (2D) monolayer cultures. These 2D cells have morphological deviations from cells that exist in 3-dimensional (3D) tissues in vivo, and may not maintain the same chromosome conformation. We used Hi-C maps to test the extent of differences in chromosome conformation between human fibroblasts grown in 2D cultures and those grown in 3D spheroids. Significant differences in chromosome conformation were found between 2D cells and those grown in spheroids. Intra-chromosomal interactions were generally increased in spheroid cells, with a few exceptions, while inter-chromosomal interactions were generally decreased. Overall, chromosomes located closer to the nuclear periphery had increased intra-chromosomal contacts in spheroid cells, while those located more centrally had decreased interactions. This study highlights the necessity to conduct studies on the topography of the interphase nucleus under conditions that mimic an in vivo environment.
Introduction
A striking feature of the eukaryotic cell nucleus is the packing of DNA into highly folded chromatin that fits into a very limited space.Citation1 However, chromatin occupies only half of the available nuclear volume and the remaining ‘interchromatin space’ harbors nuclear sub-compartments and soluble components involved in dynamic structural changes to chromatin domains.Citation2 A prevailing idea is that the spatial arrangement of the human genome in the interphase nucleus is best described in terms of chromosome territories,Citation3 or a volumetric measure of each chromosome with information about its position within the nucleus. A high level of genome organization is revealed by CT proximity patterns, stability and changes in cycling cells, positioning dynamics and chromatin interactions, and internal architecture such as domain organization within CTs.Citation3 CT organization in interphase is thought to contribute to inter- and intrachromosomal interactions and coordinated expression among sets of genes.Citation4 Furthermore, it has become increasingly apparent that the organization of the nucleus plays a critical role in its function.Citation5 This is relevant for regulating gene expression, DNA repair, and differentiation.
Compelling data support the idea that radial arrangements of CTs in the nuclear volume are nonrandom and evolutionarily conserved in higher primates.Citation5-11 Multiple factors, including gene density, GC content, replication timing, and chromatin compaction, may affect CT positioning. Cumulative evidence suggests a pivotal role of local gene density in the radial positioning of CTs in the nucleus.Citation3,9). For example, chromosome 19 is gene rich and radially located in the interior of the nucleus, while gene-poor chromosome 18 is preferentially found at the periphery.Citation8,12
In mammalian nuclei, some data suggest that global chromosome positioning is maintained in interphase and transmitted to the next generation through mitosis.Citation13 However, other investigations find loss of order during transmission, as well as variations in CT neighborhood from one cell cycle to the next.Citation14,15 As a whole, these studies show that an understanding of the 3 dimensional genome requires approaches that address its dynamical nature.
Two methods are commonly used to investigate the architecture of the genome: in situ imaging of labeled genomic regions or chromosomes, and biochemical proximity-based ligation methods. Biochemical methods have advanced rapidly and provide insight into nuclear sub-compartments and local gene expression patterns. Initially such characterizations only analyzed one or a few loci.Citation16–18 The recently developed high-throughput genome-wide chromosome conformation capture (Hi-C) probes 3-dimensional architecture by coupling proximity-based ligation with massively parallel sequencing. This method has the potential to reveal critical global characteristics of the nucleus that may participate in regulation of transcriptional programs. Spatial proximity maps of the human genome have been constructed using Hi-C at a resolution of 0.1–1 megabase.Citation19 These maps confirmed the presence of chromosome territories and the spatial proximity of gene-rich chromosomes. The maps also identified an additional level of genome organization that is characterized by the spatial segregation of open and closed chromatin into 2 genome-wide compartments. The composition of the compartments at the level of individual loci can differ between cell types, but the overall compartment patterns appear to be similar, and there is a strong correlation between the compartment pattern and chromatin accessibility in the same cell type.Citation19 These results demonstrate the power of Hi-C to map genome-wide chromosome conformations and, furthermore, reveal that open and closed chromatin domains throughout the genome occupy different spatial compartments in the nucleus. These patterns may be used to distinguish specific cell types or states.
Many mathematical and statistical models have been proposed to infer chromatin geometry from Hi-C contact matrices, thus the measurement precision of the number of contacts is important. To date, chromatin interaction maps in human fibroblasts have been obtained from 2 dimensional (2D) monolayer cultures Citation20 or from cells cultured in suspension (3D).Citation19 In 2D cultures, cells and nuclei are morphologically flatter than suspension cultures; therefore nuclear architectural conditions present in native 3-dimensional tissue may not be authentically maintained in 2D cultures. Consequently, genome conformation in 2D cultures might be altered with respect to corresponding cells in human tissues. In this regard, Bolzer et al.Citation21 compared genome organization between fibroblasts and lymphocytes that are shaped more roundly. Cell type-specific nuclear organization was demonstrated, but the authors used modeling to show that some of the differences could be due to differences in nuclear shape. However, no definitive conclusions could be drawn since the cells were of different type.
To explore the contribution of nuclear shape to genome organization in a more controlled way, we aimed to recapitulate the 3D structure of human tissue by culturing human fibroblasts in 3D spheroids (see methods). We generated chromatin interaction maps of fibroblasts growing in 2D cultures and 3D spheroids using Hi-C.Citation19,23 Here we report a significant difference in genome-wide chromatin interactions between 2D cultures and 3D spheroids in the same cell type.
Results
We grew human foreskin fibroblast spheroids in a 96-well PERFECTA3D® hanging drop plateCitation24 for 48 hours and then harvested the spheroids for Hi-C analysis. We examined the spheroids with a light microscope and found no indication of cell necrosis inside the spheroids (supplementary ). Spheroids were viable when plated to grow in a 2-dimensional (2D) culture vessel (not shown). We generated confocal images of nuclei for 2D cells and cells in 3D spheroids. We calculated the nuclear volumes for cells grown on 2D culture and those in 3D spheroids. The mean nuclear volume of 2D cells was 318.3 μm3, and that of 3D spheroids was 262.7 μm3. There was significant difference in mean nuclear volume between 2D and 3D cells (t-test p value = 0.024) (supplementary , supplementary Table 1, supplementary Movie 1).
Figure 1. The 4 diagonal matrices (3D rep1 and rep2, 2D rep1 and rep2) are the heatmaps that show the norms of portions of the Hi-C matrices after RPM (A) and ICE (B) application, after the centromeres are removed. Each pixel within these heatmaps represents a summary of an interaction between 2 chromosomes; each is obtained by taking the norm of the corresponding block from the Hi-C matrix and dividing by the length of the corresponding chromosomes. On the off-diagonal, the heatmaps show the absolute magnitude difference between the diagonal heatmaps, all on the same scale, so that these matrices are symmetric about the diagonal matrices. Color bars shown right of both (A) and (B) correspond to individual matrix diagonal values. Color bars shown below (A) and (B) correspond to individual matrix off-diagonal values. Note that the difference between replicates is relatively small compared to the difference between growth conditions.
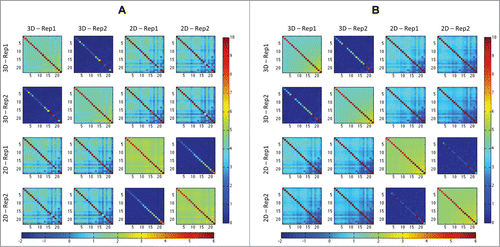
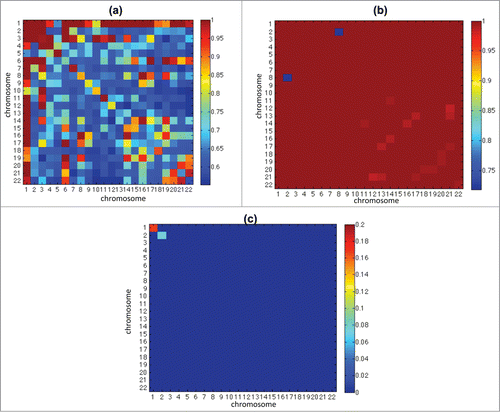
Figure 2. This figure shows the p-values of the distribution test of intra- and inter-chromosome matrices between 2D and 3D cases (see Local Analysis under Materials and Methods). (a, b) shows the p-values of test within 2D and 3D replicates respectively, and shows there is no significant difference within replicates. (c) shows that most blocks have very small p value, which implies significant difference.
We generated Hi-C matrices (maps) at 1 Mb resolution for 2D cells and 3D spheroids. These matrices consist of paired-end sequence reads from 2 biological replicates in each culturing condition. Sequence reads and genome mapping information is summarized in supplementary Table 2.
Analysis of RPM (read per million) normalized Hi-C matrices (see Materials and Methods) revealed significant genome-wide difference in chromatin interactions (contacts) between 2D cultures and 3D spheroids (). We also applied ICECitation25 to our data for normalization, which produced very similar result (). The RPM normalization simply tunes matrices comparable by considering the reads counts as a distribution and removing the distortion caused by total read number. This is a necessary raw data processing. In our data, the biases (e.g., restriction sites, mapability, GC content) are consistent over experiments since they were performed in the same condition. For this reason, although the bias may exist, the data are comparable due to the consistence of bias over replicates. On the other hand, other bias removing normalization techniques (such as “ICE”) usually make in addition stronger assumption on the data model and impose strict constraints, which may lead to additional uncontrollable distortions or overcorrections. Therefore we prefer keep on using RPM normalization and it does not constraint the conclusions.
We observed that in large regions of the genome, the number of intra-mega base contacts (Hi-C matrix diagonal counts) were significantly increased in 3D spheroids compared to 2D cultures (supplementary ), while inter-chromosome contacts (Hi-C matrix column sums with diagonal counts removed) were significantly reduced in spheroids (supplementary ). We also found that intra-contacts in a large number of regions remained similar between 2D cultures and spheroids throughout the genome (supplementary –26). shows the p-values of the distribution test of intra- and inter-chromosome matrices between 2D and 3D cases (see Local Analysis under Materials and Methods). The test p-values within 2D () or within 3D replicates () shows there is no significant difference within replicates. shows that most blocks have very small p value, which implies significant difference between 2D and 3D matrices.
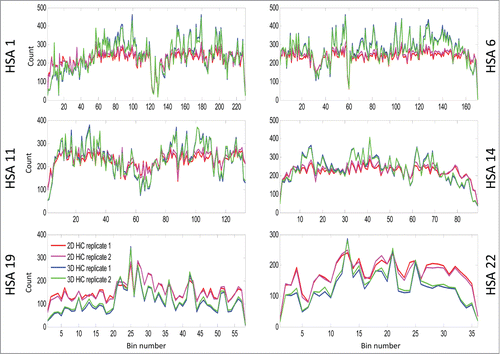
Figure 3. This figure shows the Hi-C matrices (interactions) in 2D and 3D cases for chromosomes HSA 1, 6, 11, 14, 19, and 22.
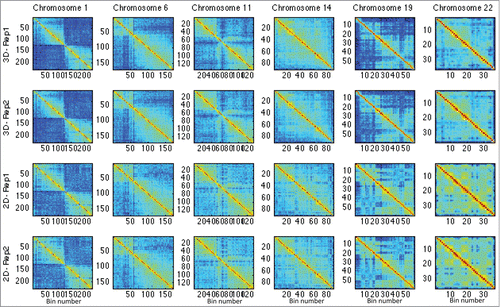
Figure 4. This figure shows the component-wise significance level test for equality of means between Hi-C matrices from 3D spheroids and 2D cells. Shown in this heat map are intra-chromosome contact matrices for chromosomes HSA 1, 6, 11, 14, 19, 22. Dark blue represents the bins with significance level with adjusted P < 0.05.
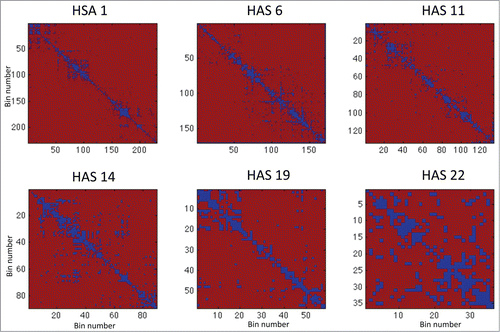
Figure 5. This line plot shows the intra-bin Hi-C counts after RPM normalization within each mega base generated from 2D cells and 3D spheroids. On the X-axis are the coordinates of DNA sequence in mega base from pter to qter of each correspondence chromosome. The Y-axis indicates the diagonal bin counts. Lines in blue and cyan indicate counts for spheroids, and lines in red and magenta represent counts from 2D cells. Increased bin-wise counts in spheroids are seen in large regions on HSA 1, 6, 11, 14, and decreased bin-wise counts in spheroids are seen on HSA 19 and 22. If you want to include ICE figures, the figure legend will be nearly the same – simply indicate that ICE and RPM were applied before the analyses.
In order to examine the difference between 2D and 3D Hi-C data in a more detailed manner, we performed an element-wise significance test against the null hypothesis that , where
and
denote the (ij)th entry of 2D and 3D Hi-C matrices, respectively (see Materials and Methods). This analysis was performed on matrices of chromosomes HSA 1, 6, 11, 14, 19, and 22, respectively (see and supplementary Fig. 51 for chromosome illustration, and and supplementary Fig. 52 for test results). These chromosomes represent the various classes of human chromosomes, with characteristics such as small, large, gene poor, and gene rich, while also including the most gene dense chromosome 19. The original Hi-C data of the replicates in the 2D and 3D cases are shown in . The p-value maps associated with these chromosomes are shown in , where the dark blue represents lower p-values and significantly different regions.
When examining individual chromosomes, we found that increased intra-contacts in spheroids were dominant on HSA 1 – 15, 18, 20p, and 21q (supplementary –22). However, intra-contacts were significantly reduced on HSA 16, 17, 19, 20q, 22, and 1pter (supplementary Figs. 23–27, and 4). As examples for decreased and increased contact maps, the matrix diagonal plots of HSA 1, 6, 11, 14, 19, and 22 are shown in . The grouping of these chromosomes correlates loosely with the proposed non-randomness of chromosome radial positioning, in which gene-rich chromosomes are preferentially found located in the interior of the nucleus, while gene-poor chromosomes are found more peripherally.Citation8 We also found that the number of intra-contacts dropped significantly in regions proximal to telomeres on HSA 1p, 2p and 2q, 3p, 4p. 5p and q, 6q, 7p and q, 8p and q, 9q, 10p and q, 11p and q, 12p and q, 13q, 14q, 16p and q, 17p and q, 18q, 19p and q, 20p and q, 21q, and 22q (supplementary –27).
We next examined matrix column sums for inter-mega base interactions with the diagonal counts (intrachromosomal proximities that are dominant in the matrices) removed. This analysis showed that, in general, the column sums (inter-mega base interactions) were significantly reduced in spheroids compared to those in 2D cells (, and supplementary Figs. 28–49]), except in a few regions of mega-base bins on HSA 1–8 , and 12 where increased contacts in spheroids were observed.
Figure 6. This line plot shows RPM normalized inter-bin mega base bin sums generated from 2D cells and 3D spheroids. This was calculated by taking the sum of counts in each bin with the diagonal removed. Globally decreased interaction are seen on all chromosomes displayed (HSA 1, 6, 11 14, 19, 22). On the X-axis are the coordinates of DNA sequence in mega base from pter to qter of each correspondence chromosome. The Y-axis indicates the bin counts. Lines in blue and cyan indicate counts for spheroids, and lines in red and magenta represent counts from 2D cells.
Discussion
We report a significant difference in chromatin interactions between 3D spheroids and 2D cultures in identical cells, which were highly reproducible. The changes observed do not show a systematic monotonic pattern or randomness in the entire genome, which otherwise may indicate the existence of a systematic technical error. Instead, the differences seen display specific patterns dependent on individual chromosomes. The interactions in multiple regions remain similar between the 2 growth conditions, suggesting that the natural chromatin status is preserved with our cross linking procedures. Additionally, we performed analysis on the normalized matrices based on the ICE (iterative correction and eigenvector decomposition) technique.Citation24 This analysis produced similar results ().
The basis for how a change in cell culture condition significantly impacts chromatin interaction is currently unclear. Differences in space, shape or volume may contribute to chromosomal conformation changes when cells are grown in spheroids. In 2D conditions, the nucleus is a disk-like volume, which is larger than that in spheroids (supplementary , supplementary Table 1, supplementary Movie 1). Consequently, chromosome volumes may be more restricted in the 3D cells compared to that in 2D cells. This restriction then causes increased chromatin compaction for those preferentially located at the nuclear periphery in fibroblasts (such as chromosomes 3, 4, 5, 8, 13, 18, and 21).Citation8 Consistently, we observe increased intra-chromosomal interactions within these chromosomes in spheroid-grown cells. On the other hand, our results show decreased intra-chromosomal interactions within chromosomes 16, 17, 19, 20q, and 22 that are more interiorly located.Citation8 This observation suggests that space restrictions in 3D cells may have less impact on these interiorly located chromosomes. It appears that a large region in the middle of 20p is an exception. In fact, the gene density in this region is relatively low compared with the rest of the chromosome. The observation of an inverse correlation between the degree of CT regularity and gene density by Sehgal et al.Citation26 implies reduced chromatin compactness in irregular gene dense chromosomes.
We find that inter-chromosomal contacts are generally decreased in spheroids relative to intra-chromosomal contacts. This is likely a result of a gain in the Z-dimension of the nuclei in cells grown in spheroids which separates individual CT volumes to a greater degree than in 2D cultured cells, such that territories contact one another less often. We did observe on average that the nuclei in 3D spheroids are significantly smaller than that in 2D cultures (supplementary , supplementary Table 1, supplementary Movie 1). Alternately, the chromosome territories in cells grown as spheroids could be more compact, increasing the number of intra-chromosome contacts. However, the increase in the Z-dimension suggests that the chromosome territories are in fact more separated in spheroids than in 2D cultured cells.
We are aware that different concentrations of formaldehyde were used in cross linking (1% for 2D cells for 15 minutes, and 2% for 3D spheroids for 30 minutes). Different concentrations of formaldehyde might confound the result. However, in preparation of Hi-C libraries, we routinely apply a quality control step to amplify a known interaction with a pair of 3C PCR primers. In our preliminary experiments, we used 1% and 2% of formaldehyde in cross linking for 2D cultures (fibroblasts) and 3D spheroids (HEK 293 cells) for 15 and 30 minutes, respectively. We found that all the libraries made under respective conditions performed equally in amplification of the known 3C interactions (supplementary Fig. 50). Therefore, we simply chose the commonly used 1% formaldehyde for 2D cultures. Considering that the interior cells in spheroids might be less exposed to cross linking with 1% formaldehyde, we chose 2% formaldehyde for 3D spheroids. To fully address this question, it would be ideal to perform a systematic analysis of a series of Hi-C libraries consisting of different concentrations of formaldehyde in cross linking, duration of linking, foreign DNA spike in for 2D cells and 3D spheroids. We will pursue this question in further studies.
Conclusion and Recommendations
In conclusion, we find a significant difference of chromatin interactions between identical, isogenic cells grown in 2D cultures compared to 3D spheroids. We found that chromosomes located more peripherally show increased intra-chromosomal contacts, while those located in the interior display decreased intra-chromosomal interactions in spheroids. Contacts between chromosomes are generally decreased in spheroids when compared to 2D cell cultures. In addition, the interaction maps in a large number of regions in the genome are preserved between 2D cells and 3D spheroids.
There are several open questions to be addressed: First, in the current experiment, we only examined uniform same size spheroids derived from plating 500,000 cells per spheroid. The impact of spheroid size and/or the initial number of cells used for spheroid formation on chromatin interactions may need to be evaluated in future experiments. Also, we only analyzed spheroids sampled at 48 hours post-plating. An investigation on the effect of spheroid growth time and proliferation rate on chromatin interactions may help to further define the differences between 2D cells and 3D spheroids. Additionally, a difference in chromatin interactions between 2D cells and 3D spheroids may affect gene expression. Future experiments may include analysis of gene expression profiles in cells from the 2 forms of culturing conditions. In addition, imaging methods such as fluorescence in situ hybridization (FISH) or live cell imaging with high-resolution microscopy may be used to validate Hi-C results. Finally, comparison of data generated from multiple cell types may assist in establishing a mathematical foundation for predicting the coupling of genome architecture with its function.
Materials and Methods
Cell culture and crosslinking of chromatin
Human foreskin fibroblasts from a normal karyotyped male individual (Cat # CRL-2522, ATCC, Manassas, VA) were propagated in growth medium, composed of MEM medium (cat # 11095–098, Life Technologies, Grand Island, NY), 10% fetal bovine serum (FBS, cat # 10082–147, Life Technologies), 1 X non-essential amino acids (NEAA, cat # 11140–050, Life Technologies), and 1 X antibiotic/antimycotic (cat # 15240–062, Life Technologies). Fibroblasts were synchronized to G0/G1 phase with serum-free MEM medium supplemented with 1 X NEAA and 1 X Antibiotic/antimycomic for 48 hours. Synchronized cells were dissociated with 0.25% trypsin (Cat # 25200–056, Life Technologies) to suspend for replating. For 2 dimensional (2D) monolayer cultures, 4 × 10⁶ cells were plated in each 150 mm dish. For 3D cultures, 0.5 × 10⁶ cells were plated in each well of a 96-well PERFECTA3D® Hanging Drop Plate (3D Biomatrix, Ann Arbor, MI). Both 2D and 3D cultures were incubated for 48 hours in growth medium at 37°C with 5% CO2. Approximately 20 × 106 cells grown in 2D were cross linked with 1% formaldehyde (Cat # BP531–25, Fisher Scientific, Pittsburgh, PA) in serum free-medium for 15 min at room temperature, and then quenched with glycine (Cat # G8898–500 g, Sigma-Aldrich, St. Louis, MO) to a final concentration of 0.128 M. Cross linked cells were flash frozen in liquid nitrogen and then stored at −80°C until the construction of Hi-C libraries. Spheroids were harvested in serum-free medium, and cross-linked with 2% formaldehyde for 30 min at room temperature. The cross linking reaction was then quenched with the addition of glycine to a final concentration of 0.128 M. Spheroids were collected, flash frozen in liquid nitrogen, and then stored at −80°C until the construction of Hi-C libraries.
We generated confocal nucleus images for 2D cells and cells in 3D spheroid. Cells are rinsed briefly in PBS, fixed in 4% paraformaldehyde for 8 minutes, and rinsed 3 × 5 minutes in PBS. For 2D cells, 15 μl of Prolong Gold (p36941 Life Technologies) with DAPI was placed on each slide, an 18 × 18 mm coverslip applied, sealed, and stored at −20°C for later imaging. For 3D spheroids, we embedded the spheroids in Prolong Gold and transferred to the well in a 35 mm cultures dish with a coverslip bottom (Cat D35–20.1.5N, In Vitro Scientific, Sunnyvale, CA), which preserves the original shape of 3D spheroids. We processed 3D nuclei imaging immediately. All imaging was completed on a Zeiss LSM 710 Confocal Microscope with a 63x Oil plan-apochromat DIC objective, Collection parameters provided for 0.132 μm x and y resolution, 0.320 μm z resolution, and used a 24 μm pinhole. Excitation was by a 405 nm laser with an emission collection band from 411 to 486 nms.
Image reconstructions were created by first imaging cell cultures, then selecting individual cell nuclei from each culture at random. These images were then analyzed and clustered using proprietary WIC software, which clustered the nuclei to create a spheroid reconstruction. This software uses covariance matrices to determine the best fit for an ellipsoid rendering of the cell z-stack images, and outputs Eigen values for this ellipsoid. WIC data was then input to Malab to construct the above subplot.
Generation of Hi-C libraries for sequencing
The methods for Hi-C library construction were adopted from.Citation21 For each Hi-C library, approximately 20 × 106 cells were resuspended in 1 mL ice-cold lysis buffer, consisting of 10 mM Tris-HCl, 10 mM NaCl, 0.2% Igpel (Cat # 8896–50mL, Sigma-Aldrich), and 10 mL protease inhibitor cocktail (Cat # P8340–1ml, Sigma-Aldrich), and incubated on ice for 15 min. Cells were homogenized in a Dounce homogenizer on ice with pestle A, and the lysate was transferred to a 1.7 mL tube. Cells were collected by spinning for 5 minutes at 2,000xg, then washed twice in 500 μL of ice cold 1x NEB buffer 2. Cells were distributed between 4 individual 1.7 ml centrifuge tubes (50 μL per tube). Chromatins in each tube were digested with 400u of restriction enzyme HindIII (Cat # R0104M, New England BioLabs, Ipswich, MA) in 1x NEB buffer 2 at 37°C overnight on a spin wheel.
After HindIII digestion, restriction site overhanging ends were filled and labeled with biotin with DNA polymerase I large (Klenow) fragments (Cat # M0210L, New England BioLabs) in a reaction containing dATP, dGTP, dTTP, and biotin-14-dCTP (Cat # 19518–018, Life Technologies) in each of the 4 Hind III digestion tube. DNA fragments labeled biotin-14-dCTP from each of the 4 tubes were ligated at 16°C for 4 hours in an 8.23 mL reaction containing 1x ligation buffer, 1% Triton X-100 (Cat # T8787–250ML, Sigma-Aldrich), 1 mg/ml Bovine serum albumin (BSA)(Cat # BP9706–100, Fisher Scientific), 10 mM ATP (Cat # A9187–1g, Sigma-Aldrich), and 50u T4 DNA ligase (Cat # 15224–025, Life Technologies).
Reverse cross-linking was performed at 2 steps. First, 50 μl of 10 mg/ml proteinase K (Cat # 25530–015, Life Technologies) were added to each ligation reaction tube and incubated at 65°C for ∼4 hours. Then, another 50 μl of proteinase K were added to each tube and continued incubating at 65°C overnight. Next, DNA was extracted with saturated phenol : chloroform (1:1) (Cat # 1100631, Fisher Scientific), and desalted by using AMICON® Ultra Centrifugal Filter Unit (Cat # UFC503024, Millipore, Billerica, MA) with 1 x TE buffer. The final volume of desalted DNA was adjusted to 100 μL in 1 x TE buffer.
Removal of Biotin from un-ligated ends was carried out in 8 individual reactions each of 50 μL containing 5 μg of Hi-C DNA, 1 mg/ml BSA,1X NEB buffer 2, 25 nM dATP, 25 nM dGTP, and 15u T4 DNA polymerase at 20°C for 4 hours. The Hi-C DNA was then pooled in a single tube, purified with single phenol extraction, and precipitated by ethanol. The DNA was re-dissolved in 105 μl of water, and transferred to a microTUBE AFA tube (Cat # 520045, Covaris, Woburn, Massachusetts). DNA fragmentation was performed in a Sonicator (Covaris S2, Covaris). The DNA fragments in a size of 200 – 400 bp were recovered with Agencourt AMPure® XP mixture (Cat # A63880, Beckman Coulter, Indianapolis IN) following the manufacturer's protocols.
DNA fragment ends were repaired in a 70 μL reaction containing 1 X ligation buffer (Cat # B0202, New England BioLabs), 0.25 mM of dNTP mixture, 7.5 u of T4 DNA polymerase (Cat # M0203L, New England BioLabs), 25u of T4 polynucleotide kinase (Cat # M0201S, New England BioLabs), 2.5u of DNA polymerase I large fragment at 20°C for 30 min. The reaction was purified with a MinElute column (Cat 28204, Qiagen, Valencia, CA). The DNA was eluted in 32 μL of elusion buffer for A-tailing, which was performed in a 50 μL reaction containing purified DNA (5 μg), 1 X NEB buffer 2, 0.2 mM dATP, 15u Klenow fragment (3’→5’ exo-) (Cat # M0212L, New England BioLabs). The reaction was incubated at 37°C for 30 min, then at 65°C for 20 min to inactivate Klenow (exo-).
For Streptavidin pull-down of biotinylated Hi-C ligation products, the biotinylated Hi-C ligation products were mixed with MyOne C1 streptavidin bead solution (Cat # 65001, Life Technologies) for binding of biotinylated Hi-C fragments. Non-specifically binding DNA was removed by washing with 1 X binding buffer (5 mM Tris-HCl (pH8.0), 0.5 mM EDTA, and 1 M NaCl), then with 1 X T4 Ligation buffer (Cat # 46300–018, Life Technologies). The DNA-bound beads were resuspended in 38.75 μl of 1 X ligation buffer for adapter ligation.
Illumina adapter ligation was performed in a 50 μL reaction by adding to the DNA-bound beads suspension of 1 X T4 ligation buffer, 90 pM of Illumina paired end adapter, 3u of T4 DNA ligase (Cat # 15224–025, Life Technologies). The reaction was incubated at room temperature for 2 hours. The beads were reclaimed, and the supernatant discarded. The beads were washed twice in Tween Wash Buffer (5 mM Tris-HCl pH8.0, 0.5 mM EDTA, 1 M NaCl, 0.05% Tween 20), once in 1 X binding buffer (5 mM Tris-HCl (pH8.0), 0.5 mM EDTA, and 1 M NaCl), and twice in 1 X NEB buffer 2. After the last wash, the beads were resuspended in 20 μl of 1X NEB buffer 2.
The Hi-C DNA sample was amplified by 15 PCR cycles (optimized in the log amplification phase) for Illumina HiSeq sequencing. Each PCR reaction in 25 μl, 1.5 μl of Bead-bound Hi-C DNA, 0.35 μl of PE primer 1.0, 0.35 μl of PE primer 2.0, 0.2 μl of 25 mM dNTP, 2.5 μl of 10X PfuUltra buffer, 19.6 μl of H2O, and 0.5 μl of PfuUltra Fusion DNA polymerase. The PCR cycling parameters were 98°C for 30 seconds, followed by 15 cycles at 98°Cfor 10 seconds, 65°C for 30 seconds, and 72°C for 30 seconds, and a final extension at 72°C for 7 minutes. PCR products pooled from the supernatant of multiple reactions were subjected to AMpure XP beads purification to remove primer dimers. A standard quality control procedure was performed on the purified PCR products (Hi-C library). Each Hi-C library that passed the QC procedure was then sequenced in a single lane of a flow cell on a HiSeq 2000 sequencer to generate paired-end sequence reads at 100 bases per end read.
Generation of Hi-C matrices
We standardized a pipeline to process Hi-C sequence data at the University of Michigan Bioinformatics Core facilities. With this pipeline, raw sequence reads were processed with FastQC (http://www.bioinformatics.bbsrc.ac.uk/projects/fastqc/) for data quality control. Paired-end reads with excellent quality were mapped to the reference human genome (HG19) using Bowtie2,Citation26 with default parameter settings and the “–very-sensitive-local” preset option, which produced a SAM formatted file for each member of the read pair (R1 and R2). HOMER (http://homer.salk.edu/homer/interactions/) was used to develop the contact matrix with “makeTagDirectory” with the –tbp 1setting, and with “analyzeHi-C” with the “-raw” and “-res 1000000” settings to produce the raw contact matrix at 1 MB resolution.
We also analyzed the Hi-C data bin-by-bin by creating vectors which summarized the information in each bin. The first of these vectors contained only the diagonal counts, representing the intra-bin interactions. Another vector contained the total reads for a bin. The final vector was the total reads for each bin, subtracting out the diagonal interactions in order to remove linearly local interactions and instead focus on interactions between genetic locations that are more distant within the linear genome.
Statistical Analysis
Normalization of Hi-C data
RPM Normalization
First, we normalized the raw contact matrices to facilitate comparability. The scaling factor was chosen to be the sum of the lower-triangular elements. This quantity represents the total number of reads used to create the Hi-C matrix. We divided each element of the Hi-C matrix by this sum, then multiplied by one million to generate a Reads-Per-Million-Reads (RPM) normalized Hi-C matrix. This process results in a matrix with elements expressing the number of interactions expected if exactly one million paired end reads were observed. The normalization puts all Hi-C matrices on the same scale, ensuring that any differences between Hi-C matrices are not attributable to variation in total sequencing depth. Subsequent analyses were performed on the RPM-normalized Hi-C matrices. We used this RPM normalization since further, more sophisticated normalizationCitation25 produced similar results (see ).
Global Analysis
Chromosomal matrix reduction
In addition to generating the fine-grained Hi-C matrices as outlined above, we also assessed interactions at chromosome resolution (i.e., considering only chromosome-level interactions) using a square matrix. To understand the process used to create these matrices, first consider a Hi-C matrix as a
block matrix with blocks defined by chromosomal boundaries. Each block represents a chromosome-by-chromosome interaction, and diagonal blocks represent Hi-C interactions within a single chromosome. By replacing each block with a single value summarizing its contents, we can reduce the megabase-scale Hi-C matrix to a more general
matrix. This summary value was chosen as the mean value of the block entries for the inter-chromosome Hi-C matrices, and the mean value of the block entries with the diagonal removed for the intra-chromosome Hi-C matrices.
Hi-C matrix comparisons
To quantify the differences between the Hi-C matrices we performed a statistical test on the distribution of each intra- and inter- chromosome Hi-C block entries. Namely,
where denotes the distribution of the samples, and the subscripts
,
,
,
distinguish the cases and replicates. In order to consider more on general pattern and reduce the dimension, we summarize each 10 by 10 region in the block by its count summation, and then a variance normalizing transformation (the Anscombe transformation)is applied to the entries of these reduced size matrices to better shape the data. The diagonals of the intra-chromosome matrix are also removed due to their particularity. After that the Kolmogorov-Smirnov testCitation28 is applied to test the significance of the distribution differences. The thresholded p-value map is shown in where Benjamini-Hochberg correction is used.28 It can be clearly observed the significant difference between 2D and 3D case, while there's no significant difference within replicates in both 3D and 2D cases.
Local Analysis
We performed another statistical test to determine if sequence localized differences exist between 2D and 3D Hi-C matrices. Monte Carlo significance tests have been widely used to test significance of pattern differences and we used a related approach here. The element-wise significance test against the null hypothesis that , where
and
denote the (ij)th entry of 2D and 3D Hi-C matrices, respectively. In this local analysis, we assume that each entry is a Poisson random variable with its own rate. The RPM matrices are rescaled by a same scalar that ensures the smallest entry in the matrices are not less than 1. Considering that we have few numbers of replicates and nontrivial distribution of the statistic, we performed test via the Monte-Carlo method, with the assumption that the observed counts were corrupted by the Poisson noise. To achieve this, we generated N = 100000 matrices where each entry is a random variable following the Poisson distribution centered at the mean under the null hypothesis. The distribution of
under the null hypothesis can then be approximated using these generated samples. Computing the associated statistic from the observed samples, and evaluating the percentage of generated samples that exceeds this statistic, provide us with the significance level of the difference. The above analysis was performed on matrices of all chromosomes (see for chromosome 1, 6, 11, 14, 19, and 22, see Supp. Fig. 52 for all matrices). The result p-value maps associated with these chromosomes are shown in , where the dark blue represents regions with adjusted P-values < 0.05.
Disclosure of Potential Conflicts of Interest
No potential conflicts of interest were disclosed.
Supplementary Material
Supplemental data for this article can be accessed on the publisher's website.
Supplementary_Materials.zip
Download Zip (21.1 MB)Acknowledgments
We thank Lindsey Muir and Joan Ritland Politz for critical reading of the manuscript. We also thanks Dr. Richard Mc Eachin for support in processing Illumina sequence data with a standardized pipeline, Walter Meixner for providing microscopy images obtained from 3D spheroids, and Laura Seaman for helpful discussion on the manuscript. We are grateful to Dr. Job Dekker for providing the Hi-C protocol.
Funding
This work is supported with a grant from Defense Advanced Research Projects Agency (DARPA) Biochronicity Project and National Institutes of Health (NIH; grant K25DK082791–01A109) to IR. The work of J. Chen and A. O. Hero was partially supported by Defense Advanced Research Projects Agency (DARPA), under the Predicting Health and Disease (PHD) program.
References
- Misteli T. Beyond the sequence: cellular organization of genome function. Cell 2007; 128:787-800; PMID:17320514; http://dx.doi.org/10.1016/j.cell.2007.01.028
- Rouquette J, Genoud C, Vazquez-Nin GH, Kraus B, Cremer T, Fakan S. Revealing the high-resolution three-dimensional network of chromatin and interchromatin space: a novel electron-microscopic approach to reconstructing nuclear architecture. Chromosome Res 2009; 17:801-10; PMID:19731052; http://dx.doi.org/10.1007/s10577-009-9070-x
- Cremer T, Cremer M. Chromosome territories. Cold Spring Harb Perspect Biol 2010; 2:a003889; PMID:20300217; http://dx.doi.org/10.1101/cshperspect.a003889
- Rajapakse I, Groudine M. On emerging nuclear order. J Cell Biol 2011; 192:711-21; PMID:21383074; http://dx.doi.org/10.1083/jcb.201010129
- Takizawa T, Meaburn KJ, Misteli T. The meaning of gene positioning. Cell 2008; 135:9-13; PMID:18854147; http://dx.doi.org/10.1016/j.cell.2008.09.026
- Boyle S, Gilchrist S, Bridger JM, Mahy NL, Ellis JA, Bickmore WA. The spatial organization of human chromosomes within the nuclei of normal and emerin-mutant cells. Hum Mol Genet 2001; 10:211-9; PMID:11159939; http://dx.doi.org/10.1093/hmg/10.3.211
- Cremer T, Cremer C. Rise, fall and resurrection of chromosome territories: a historical perspective. Part I. The rise of chromosome territories. Eur J Histochem 2006; 50:161-76; PMID:16920639
- Kreth G, Finsterle J, von Hase J, Cremer M, Cremer C. Radial arrangement of chromosome territories in human cell nuclei: a computer model approach based on gene density indicates a probabilistic global positioning code. Biophys J 2004; 86:2803-12; PMID:15111398; http://dx.doi.org/10.1016/S0006-3495(04)74333-7
- Kupper K, Kolbl A, Biener D, Dittrich S, von Hase J, Thormeyer T, Fiegler H, Carter NP, Speicher MR, Cremer T, et al. Radial chromatin positioning is shaped by local gene density, not by gene expression. Chromosoma 2007; 116:285-306; PMID:17333233; http://dx.doi.org/10.1007/s00412-007-0098-4
- Parada L, Misteli T. Chromosome positioning in the interphase nucleus. Trends Cell Biol 2002; 12:425-32; PMID:12220863; http://dx.doi.org/10.1016/S0962-8924(02)02351-6
- Tanabe H, Muller S, Neusser M, von Hase J, Calcagno E, Cremer M, Solovei I, Cremer C, Cremer T. Evolutionary conservation of chromosome territory arrangements in cell nuclei from higher primates. Proc Natl Acad Sci U S A 2002; 99:4424-9; PMID:11930003; http://dx.doi.org/10.1073/pnas.072618599
- Croft JA, Bridger JM, Boyle S, Perry P, Teague P, Bickmore WA. Differences in the localization and morphology of chromosomes in the human nucleus. J Cell Biol 1999; 145:1119-31; PMID:10366586; http://dx.doi.org/10.1083/jcb.145.6.1119
- Gerlich D, Beaudouin J, Kalbfuss B, Daigle N, Eils R, Ellenberg J. Global chromosome positions are transmitted through mitosis in mammalian cells. Cell 2003; 112:751-64; PMID:12654243; http://dx.doi.org/10.1016/S0092-8674(03)00189-2
- Strickfaden H, Zunhammer A, van Koningsbruggen S, Kohler D, Cremer T. 4D chromatin dynamics in cycling cells: Theodor Boveri's hypotheses revisited. Nucleus 2010; 1:284-97; PMID:21327076
- Thomson I, Gilchrist S, Bickmore WA, Chubb JR. The radial positioning of chromatin is not inherited through mitosis but is established de novo in early G1. Curr Biol 2004; 14:166-72; PMID:14738741; http://dx.doi.org/10.1016/j.cub.2003.12.024
- Dostie J, Richmond TA, Arnaout RA, Selzer RR, Lee WL, Honan TA, Rubio ED, Krumm A, Lamb J, Nusbaum C, et al. Chromosome Conformation Capture Carbon Copy (5C): a massively parallel solution for mapping interactions between genomic elements. Genome Res 2006; 16:1299-309; PMID:16954542; http://dx.doi.org/10.1101/gr.5571506
- Simonis M, Klous P, Splinter E, Moshkin Y, Willemsen R, de Wit E, van Steensel B, de Laat W. Nuclear organization of active and inactive chromatin domains uncovered by chromosome conformation capture-on-chip (4C). Nat Genet 2006; 38:1348-54; PMID:17033623; http://dx.doi.org/10.1038/ng1896
- Zhao Z, Tavoosidana G, Sjolinder M, Gondor A, Mariano P, Wang S, Kanduri C, Lezcano M, Sandhu KS, Singh U, et al. Circular chromosome conformation capture (4C) uncovers extensive networks of epigenetically regulated intra- and interchromosomal interactions. Nat Genet 2006; 38:1341-7; PMID:17033624; http://dx.doi.org/10.1038/ng1891
- Lieberman-Aiden E, van Berkum NL, Williams L, Imakaev M, Ragoczy T, Telling A, Amit I, Lajoie BR, Sabo PJ, Dorschner MO, et al. Comprehensive mapping of long-range interactions reveals folding principles of the human genome. Science 2009; 326:289-93; PMID:19815776; http://dx.doi.org/10.1126/science.1181369
- Jin F, Li Y, Dixon JR, Selvaraj S, Ye Z, Lee AY, Yen CA, Schmitt AD, Espinoza CA, Ren B. A high-resolution map of the three-dimensional chromatin interactome in human cells. Nature 2013; 503:290-4; PMID:24141950
- Bolzer A, Kreth G, Slovei, I, Koehler, D, Saracoglua, K, Fauth, C, Muller, S, Eils, R, Cremer, C, Speicher, MR et al. Three-dimensional maps of all chromosomes in human male fibroblast nuclei and prometaphase rosettes. PLoS biology 2005:3, e157.
- Belton JM, McCord RP, Gibcus JH, Naumova N, Zhan Y, Dekker J. Hi-C: a comprehensive technique to capture the conformation of genomes. Methods 2012; 58:268-76; PMID:22652625; http://dx.doi.org/10.1016/j.ymeth.2012.05.001
- Tung YC, Hsiao AY, Allen SG, Torisawa YS, Ho M, Takayama S. High-throughput 3D spheroid culture and drug testing using a 384 hanging drop array. Analyst 2011; 136:473-8; PMID:20967331; http://dx.doi.org/10.1039/c0an00609b
- Imakaev M, Fudenberg G, McCord RP, Naumova N, Goloborodko A, Lajoie BR, Dekker J, Mirny LA. Iterative correction of Hi-C data reveals hallmarks of chromosome organization. Nat Methods 2012; 9:999-1003; PMID:22941365; http://dx.doi.org/10.1038/nmeth.2148
- Sehgal N, Fritz AJ, Morris K, Torres I, Chen Z, Xu J, Berezney R. Gene density and chromosome territory shape. Chromosoma 2014; 123:499-513; PMID:25106753; http://dx.doi.org/10.1007/s00412-014-0480-y
- Langmead B, Salzberg SL. Fast gapped-read alignment with Bowtie 2. Nat Methods 2012; 9:357-9; PMID:22388286; http://dx.doi.org/10.1038/nmeth.1923
- Massey FJ. The Kolmogorov-Smirnov Test for Goodness of Fit. J Am Stat Assoc 1951; 46:68-78; http://dx.doi.org/10.1080/01621459.1951.10500769
- Benjamini Y, Hochberg Y. Controlling the false discovery rate: a practical and powerful approach to multiple testing. Journal of the Royal Statistical Society. Series B 1995; 57:289-300.