
ABSTRACT
A supervised machine learning algorithm, which is qualified for image classification and analyzing similarities, is based on multiple discriminative morphological features that are automatically assembled during the learning processes. The algorithm is suitable for population-based analysis of images of biological materials that are generally complex and heterogeneous. Here we used the algorithm wndchrm to quantify the effects on nucleolar morphology of the loss of the components of nuclear envelope in a human mammary epithelial cell line. The linker of nucleoskeleton and cytoskeleton (LINC) complex, an assembly of nuclear envelope proteins comprising mainly members of the SUN and nesprin families, connects the nuclear lamina and cytoskeletal filaments. The components of the LINC complex are markedly deficient in breast cancer tissues. We found that a reduction in the levels of SUN1, SUN2, and lamin A/C led to significant changes in morphologies that were computationally classified using wndchrm with approximately 100% accuracy. In particular, depletion of SUN1 caused nucleolar hypertrophy and reduced rRNA synthesis. Further, wndchrm revealed a consistent negative correlation between SUN1 expression and the size of nucleoli in human breast cancer tissues. Our unbiased morphological quantitation strategies using wndchrm revealed an unexpected link between the components of the LINC complex and the morphologies of nucleoli that serves as an indicator of the malignant phenotype of breast cancer cells.
Introduction
The cell nucleus is surrounded by the nuclear envelope (NE) that comprises the inner and outer nuclear membranes (INM and ONM). The multifunctional nuclear membrane protein assembly called the linker of nucleoskeleton and cytoskeleton (LINC) complex consists of the INM-spanning protein SUN and the ONM-spanning protein nesprin. SUN and nesprin interact in the lumen of the NE via their luminal domains.Citation1 The LINC complex directly connects the cytoskeleton (e.g. actin filaments or microtubule motors) and the nucleoskeleton (e.g., lamins or chromatin) and plays a major role in shaping and positioning the nucleus.Citation2 Further, the LINC complex connects specific chromosomal loci to the nucleoplasmic face to orchestrate chromosome organization and dynamics during meiosisCitation3 and acts in mechanotransduction by relaying extracellular signals to the nucleus.Citation4,5
Morphological changes in the nucleus are hallmarks of cancer cells. In particular, an enlarged nucleus, abnormal nuclear shape, anisokaryosis, increased chromatin staining, and altered nucleolar size are often observed in cancer cells.Citation6,7 These phenotypes are used for histological and cytological diagnosis. Further, the diagnostic and prognostic pathology of the NE in human cancers was described.Citation8 For example, deregulation of lamin A/C expression occurs in many human tumors.Citation9-13 We reported recently that the expression of SUN1, SUN2, nesprin-2, and lamin A/C are down-regulated in breast cancer tissues,Citation14 suggesting an association of the LINC complex and nuclear lamina components with abnormal nuclear shape and structure. However, the biological consequences of the loss of these major nuclear structural molecules in cancer cells remain to be investigated.
The nucleolus is the largest structure in the nucleus and forms around specific chromosomal regions called nucleolar organizer regions (NORs) that comprise arrays of ribosomal DNA (rDNA) gene clusters located on human chromosomes 13, 14, 15, 21, and 22.Citation15 The ultrastructural organization of the nucleolus is described in detail in a review written by Lam et al.Citation16 Three subcompartments are present within the interior of the nucleolus. The interior compartment, fibrillar center (FC), is surrounded by the dense fibrillar component (DFC), and FC-DFC complexes are further embedded in the granular component (GC). Tumor cells frequently show an altered nucleolar structure, and an enlarged nucleolus is one of the most distinctive cytological features of cancer cells.Citation17,18 The enlarged nucleolar size typically reflects deregulation of rRNA transcription.Citation19-24 However, little is known about the molecular mechanism that induces the aberrant nucleolar morphologies and deregulates rRNA transcription.
Objective measurements of differences of intracellular structures are extremely difficult because of their complexity and intrinsic heterogeneity. Conventional image analysis strategies predefine specific features to automatically recognize and measure specific objects.Citation35 However, these algorithms are inadequate, because the morphologies of the structures change and the algorithms do not recognize variations caused by pathological or nonphysiological conditions or both. A supervised machine learning algorithm, “wndchrm” (weighted neighbor distances using a compound hierarchy of algorithms representing morphology), classifies and mines images to identify similarities or differences. Instead of specifying target morphologies and choosing specific algorithms, users define classes by simply providing multiple examples of images of each class, such as those of normal and cancer cells. After a class is defined, a large number of features of each image is computed, the algorithm selects the features that best discriminate among groups, and a classifier is automatically generated. An undefined dataset is tested using multiple rounds of cross-validation, which provides marginal probabilities that are used to measure the classification accuracies and morphological dissimilarity. A great advantage of wndchrm is its versatility, and it was successfully used to solve problems such as reprogramming of human iPS colonies,Citation25 early detection of osteoarthritis,Citation26,27 measurement of sarcopenia in Caenorhabditis elegans,Citation28 classification of malignant lymphoma,Citation29 measurement of nucleolar alterations,Citation30 and others.Citation31
The aim of the present study was to quantify the effects of the loss of components of the LINC complex on cellular morphology visualized using Papanicolaou (Pap) staining and to identify the pathological significance of the loss of each component on cancer progression. We took advantage of the machine learning algorithm wndchrm and demonstrate here that the LINC protein SUN1 functionally associated with the nucleolus.
Results
Cellular morphology changes upon depletion of nuclear membrane components
We recently demonstrated that the expression of the LINC complex and nuclear lamina components decreases in a significant fraction of human breast cancer tissues.Citation14 However, the effects on cell morphology of the loss of each factor in the LINC complex and nuclear lamina are unknown. To measure morphological changes, we used an image classifier, wndchrm.Citation26,29 The nontumorigenic MCF10A cell line derived from human mammary epithelial cells was transfected with siRNAs specific for SUN1, SUN2, or LMNA (encoding lamin A/C) mRNA, and their knockdown efficiencies were determined using immunofluorescence microscopy () and western blotting (Fig. S1). SUN1, SUN2, and lamin A/C localized to the nuclear membrane in cells transfected with control siRNAs, which were almost completely absent in each siRNA-targeted knockdown cell ().
Figure 1. Depletion of LINC complex components caused morphological changes in cells. (A) MCF10A cells were transfected with the indicated siRNAs and stained with anti-SUN1 (left), -SUN2 (middle), and -lamin A/C (right) pAbs, respectively, to show that each knockdown was efficient. Cell nuclei were counterstained with DAPI. Scale bar = 20 µm. (B) Pap-stained images of the cells transfected with the siRNAs. The rectangles in the top panels indicate regions enlarged at the bottom. Scale bar = 20 µm. (C) Classification accuracy (CA) of knockdown against control (siControl_1) cells was measured using the machine-learning algorithm wndchrm. Twenty images for each knockdown class (Fig. S2) were employed for the CA measurements. Knockdown of SUN1, SUN2, and lamin A/C resulted in morphological changes significant enough to yield high classification accuracy (CA= ∼1.0 for each). The dotted line indicates CA = 0.5, the expected value of random classification with no detectable morphological differences. Thus, the value for the difference between siControls_2 and _1 (CA = 0.462 ± 0.083) is approximately as expected. (D) Morphological distances of the knockdown classes from the control were measured using wndchrm. Twenty images for each knockdown class (Fig. S2) were analyzed. Larger values indicate morphologies different from those of control cells (siControl_1). Knockdown of SUN1 resulted in significant changes. For (C) and (D), the values are the mean ± standard deviation (SD) of 20 independent cross validation tests. p values were calculated using the Student t test (***p < 0.005).
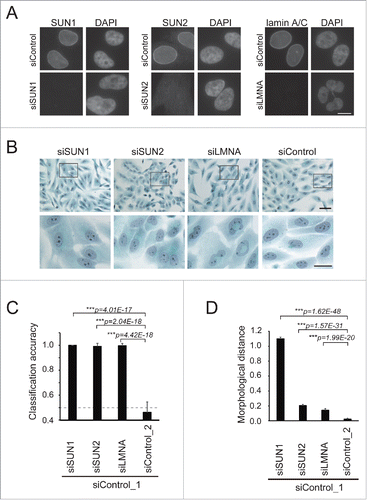
We then subjected the same set of samples to Pap staining for the reasons as follows: first, the Pap staining technique is routinely used for the diagnosis of tumors. Second, Pap is a multichromatic cell stain, and the combination of colors highlights many different features of cellular structures, including chromatin condensation and cytokeratin expression.Citation32-34 In Pap- or DAPI-stained images, aberrant nuclear and chromatin structures were detected in lamin A/C knockdown cells (). To perform quantitative analyses, we collected 20 microscope fields that were randomly selected from classes of control, LINC complex-, or nuclear lamina-depleted MCF10A cells ( upper panel and Fig. S2), and the images were subjected to classification using wndchrm. The software automatically computed 4,008 image feature values derived from 11 algorithms for raw and transforms of images, which were expected to cover general image features.
The most informative features for classification were then extracted automatically based on Fisher discriminant scores and used to construct a classifier.Citation29,35 The software tested the image classifier in multiple rounds of cross-validations using the data sets, which were automatically and randomly split for training and testing. The test results provided class probability matrices with marginal probabilities to compute classification accuracy. Two control image classes, siControl_1 and siControl_2, were created from cells that were treated with the same control siRNA. One served as a reference for pair-wise image classification (siControl_1) and the other as a negative control (siControl_2) with indistinct overall morphologies ().
Classification accuracy (CA) reflects a degree of morphological dissimilarity. In pair-wise classifications, CA = 1.0 in the presence of apparent morphological differences, while CA = 0.5 for random classification between 2 cell types without detectable feature differences. Upon knockdown of NE components, cellular shapes were classified with surprisingly high accuracy (). Thus, the CA values of siControl_1 for SUN1-, SUN2-, and lamin A/C-depleted cells were 1.000 ± 0.000, 0.992 ± 0.025, and 0.996 ± 0.018, respectively, demonstrating significant dissimilarity from cells transfected with the control siRNA (). More sensitive measures for image dissimilarities and pairwise interclass distances were performed using the Euclidean distance formula based on marginal class probabilities computed using wndchrm (see Materials and Methods) and defined here as morphological distance (MD). The MD between classes is the inverse of morphological similarity. The morphological change from control cells was much larger in SUN1-depleted cells (MD = 1.099 ± 0.023) than in SUN2- or lamin-A/C depleted cells (MD = 0.203 ± 0.017 and 0.141 ± 0.021, respectively) (). The most informative image features extracted using the wndchrm test () listed in Supplementary Table S1 show different sets of features with much higher weights associated with siSUN1 compared with those of siSUN2 and siLMNA, suggesting that unique morphologies were computationally recognized in cells transfected with siSUN1. These results indicate that depletions of NE components induced changes in cellular shapes so effectively that they were discriminated with high accuracy using wndchrm. Among the NE components, depleting SUN1 caused a particularly high degree of change in cellular structures.
Depletion of SUN1 affects nucleolar morphology
Morphological changes in the nucleus are hallmarks of cancer cells,Citation6,7 and the LINC complex and nuclear lamina act to maintain nuclear structure.Citation36 Therefore, we focused on the shapes of the nuclei of cells with decreased levels of LINC components. To measure morphology, 60 regions, including the nucleus, were extracted from Pap-stained images of siRNA-treated cells and analyzed using wndchrm. Representative images are shown in , and each image is shown in Fig. S3. The morphological distance indicated that nuclear shapes following SUN1 knockdown were significantly different from those of control siRNA-treated cells (siControl_1 vs siSUN1, MD = 0.566 ± 0.046). In contrast, changes in nuclear morphology of SUN2- or lamin A/C-knockdown cells were less apparent (siControl_1 vs siSUN2, MD = 0.067 ± 0.022 and siControl_1 vs siLMNA, MD = 0.055 ± 0.018, ).
Figure 2. Depletion of SUN1 alters nucleolar structure. (A) Representative images for nuclear regions of the knockdown cells extracted from the Pap-stained images. Scale bar = 25 µm. (B) Morphological distances of the knockdown classes from the control (siControl_1) were measured using wndchrm. Sixty images (Fig. S3) were applied. Knockdown of SUN1 resulted in significant changes in the nucleus. (C) Fisher discriminant scores assigned for each test in . Fisher scores were computed for 4,008 features that were grouped as follows: ChFT, Chebyshev-Fourier transform; Ch, Chebyshev Statistics; Cf4M, Combined First Four Moments; Fra, Fractal Statistics; Har, Haralick Texture; MSH, Multiscale Histogram; Rad, Radon; Zer, Zernike; etc, others. Fisher score values for each individual feature are listed in Supplementary Table S2. In the bottom four panels, relative scores were calculated from the top panels. The maximum Fisher score in each test was defined as 1. (D) The region corresponding to the nucleolus (left, red box) was extracted from the Pap-stained images. If the cells contained more than two nucleoli, all were extracted. Representative images for each class are shown. Scale bar = 2 µm. (E) Morphological dissimilarities of the knockdown classes from control (siControl_1) were measured using wndchrm. Seventy-five images (Fig. S4) were applied. Knockdown of SUN1 resulted in significant changes in the nucleolus. For (B) and (E), the values represent the mean ± SD of 20 independent cross-validation tests. P values were calculated using the Student t test (***p < 0.005, n.s. not significant).
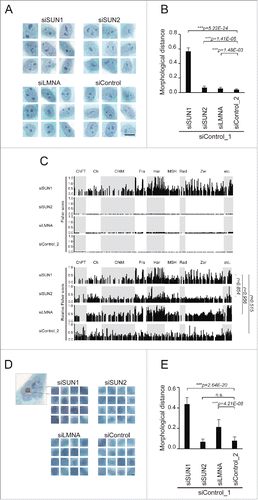
The Fisher scores computed during classification indicate the degrees of discrimination for each feature's value in each classification. Consistent with the high MD value, Fisher scores for SUN1-depleted cells were remarkably higher than were those of SUN2- or lamin A/C-depleted cells ( and Supplementary Table S2). When we compared the patterns of relative Fisher scores with maximum values in each test set to 1, we found that gross informative features were similar between siSUN1 and siSUN2, or siSUN1 and siLMNA (r = 0.852 and 0.956, where r is the correlation coefficient). For example, feature values that were computed using Haralick algorithms and Fractal statistics yielded high discriminant scores, while those for the combined first Four Moments were low, indicating that there was a greater change in nuclear shapes in MCF10A cells transfected with the SUN1 siRNA, although common morphological changes may occur in cells depleted for the NE components SUN1, SUN2, and LMNA.
Nucleoli are visible as densely stained spherical mass in Pap-stained cells and frequently become more prominent in specific tumor cells, including those of the breast.Citation17,18 We therefore focused on nucleolar structural changes caused by the depletion of NE components. Seventy-five images containing nucleoli were subjected to wndchrm analysis. Representative and all images are shown in and S4, respectively. Depletion of SUN1 led to changes in nucleolar morphology compared with control siRNA-transfected cells (siControl_1 vs siSUN1, MD = 0.438 ± 0.063) while no significant differences were observed between siSUN2- and control siRNA-treated cells (siControl_1 vs siSUN2, MD = 0.070 ± 0.027 (). We were interested to find that lamin A/C-depleted cells were discriminated from control cells (siControl_1 vs siLMNA, MD = 0.214 ± 0.073) (). These morphological analyses revealed quantitatively and qualitatively that depletion of NE components caused similar alterations of nuclear shapes. Lower levels of the LINC component SUN1 exerted the strongest effect on the nucleus, particularly on the nucleolus.
SUN1 depletion affects the distribution of nucleoli and chromatin
The nucleolus comprises the subcompartments FC, DFC, and GC. To examine the effects of depleting SUN1 on the nucleolus, we performed immunofluorescence analysis using the marker antibodies as follows: anti-upstream binding factor (UBF) for the FC, anti-fibrillarin (FBL) for the DFC, and anti-nucleophosmin (NPM) (also known as B23) for the GC, respectively. Representative images show that SUN1 knockdown caused common changes in each compartment; larger in their size and concomitant decrease in their number (). The enlarged nucleolus was similar to that often observed in higher nuclear-grade breast cancer cells.Citation17,18 Using algorithms that recognize and measure a specific object, we quantified several aspects of the FBL-stained nucleolus, including their numbers, areas, and intensities. Upon depletion of SUN1, each nucleolar area increased by approximately 50% (), and the number of nucleoli per nucleus significantly decreased (). Further, depletion of SUN1 did not influence the total area of the nucleolus in a nucleus (), and there were no significant differences in the average fluorescence intensity of a pixel in the nucleolar region between SUN1-knockdown cells and control cells (). These data suggest that multiple nucleoli were fused or merged in the nucleus in the absence of SUN1.
Figure 3. The larger and reduced number of nucleoli were formed in the SUN1-depleted nucleus. (A-C) Immunofluorescence analysis of SUN1-depleted MCF10A cells. Subnucleolar regions of FC, DFC, and GC were visualized using anti-UBF (A), anti-FBL (B), and anti-NPM antibodies (C), respectively (green), and chromatin DNA was counterstained with DAPI (red). Scale bar = 10 µm. (D-G) Quantitation of FBL-labeled nucleolar regions. Area of each nucleolus (D), number of nucleoli per nucleus (E), total nucleolar area per nucleus (F), average signal intensity of the nucleolus (G). The values represent the means ± SD (n >25 cells). P values were calculated using the Student t test (**p < 0.01, n.s. not significant). For (D), (F) and (G), the relative values are shown in arbitrary units (a.u.). The value for the siControl was defined as 1. (H) Gallery of nuclear images used for analysis in . DAPI-stained nuclear regions of SUN1-depleted MCF10A cells. Bar, 10 µm. (I) Morphological distance of knockdown classes from the control (siControl_1) were measured using wndchrm. The values represent the mean ± SD of 20 independent cross-validation tests. P values were calculated using the Student t test (***p < 0.005). (J) The dendrogram reflects the morphological similarity between siControl- and siSUN1-transfected cells. The dendrogram was constructed from 20 cross-validation tests using wndchrm (n = 13 images).
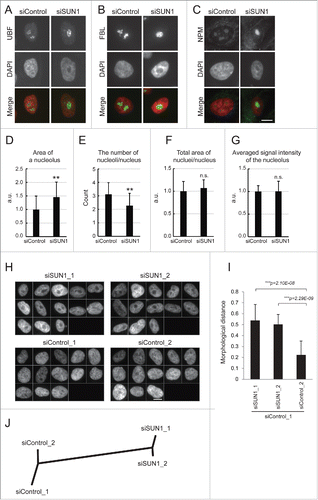
Chromatin distribution in the nucleus is sustained, in part, by the nuclear membrane. Specific chromatin domains called lamina-associated domains (LADs) associate with the inner nuclear membrane through lamins,Citation37,38 and SUN1 associates with A- and B-type lamins.Citation1 We reasoned that the absence of SUN1 may release some part of the chromatin from the edge of the nucleus and influence chromatin distribution within the nucleus. Therefore, to investigate the effects of SUN1-depletion on the morphology of chromatin DNA, using wndchrm, we performed a similar analysis of images of DAPI-stained samples. We collected 26 DAPI-stained images of SUN1-depleted cells, assigned them randomly into siSUN1_1 and siSUN1_2 groups, and subjected them to wndchrm analysis (). The morphological distance () and phylogenetic tree () shows that depleting SUN1 (siSUN1) induced changes, compared with control cells (siControl), in global chromatin morphology (MD = 0.538 ± 0.147 and 0.503 ± 0.091 for siSUN1_ 1 and _2, relative to MD = 0.222 ± 0.129 for siControl_2). These data indicate that SUN1 is involved in the maintenance of chromatin structure in the nucleus. Aberrant nucleolar formation in the absence of SUN1 may reflect altered distribution of chromatin, including LADs that are associated with the NE and nucleolar-associated domains (NADs) near where the nucleolus is formed.Citation39
rRNA transcription is decreased in SUN1 depleted cells
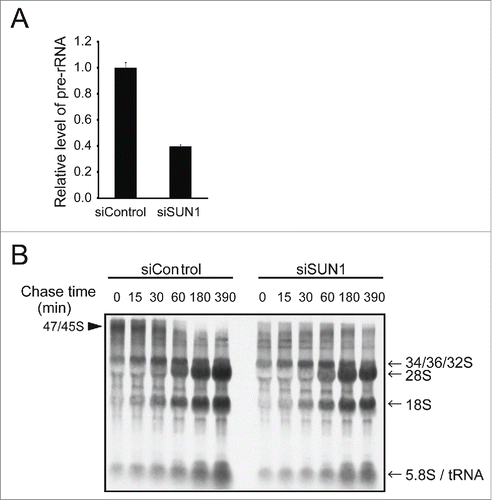
SUN1-depleted cells exhibited nuclei with fewer but larger nucleoli. Because structural alteration of the nucleolus is often linked to altered ribosomal biogenesis,Citation19-24 expression of the 45S precursor rRNA (pre-rRNA), which is very short lived and represents the rate of rRNA transcription, was quantified using real-time PCR. SUN1-depleted cells reproducibly exhibited a 40–60% decrease in pre-rRNA synthesis (). Further, pulse-chase analyses using 3H-uridine demonstrated that the amount of the 47S/45S rRNA precursor () was significantly lower in SUN1-depleted cells, consistent with the real-time PCR analysis (). However, subsequent processing to the 32S precursor, 28S rRNA, and 18S rRNAs was not significantly inhibited when SUN1 was depleted (), causing the amounts of 28S and 18S rRNAs to decrease to ˜75% after a 390 min chase because of reduced expression of the 47/45S precursor. Therefore, we concluded that depletion of SUN1 affected rRNA transcription but not rRNA processing.
Figure 4. Depleting SUN1 suppresses rRNA synthesis but not rRNA processing. (A) The levels of pre-rRNAs in the indicated MCF10A cells were quantitated using real-time PCR with primers specific for the 5′ external transcribed spacer region of pre-rRNA. Values represent the mean ± SD for triplicates. (B) Cellular RNAs were pulse-labeled with 3H-UTP for 2 h and chased with nonradioactive UTP for the indicated period. Total RNAs were isolated and separated on the agarose gel. Positions of the nascent (47S/45S), intermediate (32S) and 28S and 18S rRNAs are indicated next to the gel.
Analysis of nucleoli in tissues with decreased expression of SUN1 from patients with breast cancer
Morphological analysis of the human mammary epithelial cell line MCF10A described above suggested that loss of SUN1 expression induced the formation of enlarged nucleoli. We recently reported that greater than 80% of human breast cancer tissues exhibit decreased expression of SUN1.Citation14 To investigate the relationship between the loss of SUN1 expression and the sizes of nucleoli, we reanalyzed human breast cancer tissues reacted with an anti-SUN1 polyclonal antibody (pAb). Here we used tissues from patients with scirrhous carcinoma of the breast, which is the most common breast cancer subtype that typically exhibits enlarged nucleoli. Normal mammary epithelial cells form a duct surrounded by myoepithelial cells, and this structure is disrupted in cancer. Thus, intact duct is often observed in an adjacent cancer region in the same tissue and is defined as a cancer-associated noncancerous region. SUN1 expression was detected in persistent duct structures in cancer tissues () and was decreased in cancerous regions ( and S5A).Citation14 Further, cancer cells with faint SUN1 staining possessed more prominent nucleoli ( and S5A a) compared with SUN1-positive cells in the same tissue ().
Figure 5. Nucleolar size correlates negatively with SUN1 expression levels in human breast cancer tissues. (A) Breast tumor specimens from patients were stained using anti-SUN1 pAbs (brown), and cells were counterstained with hematoxylin (blue). A representative example both noncancerous and cancerous regions is shown. The left part of this panel shows the cancer-associated noncancerous region maintaining persistent ducts, and the majority of the cells were SUN1 positive. The right part of the panel shows cancerous regions with reduced SUN1 staining. Scale bar = 50 µm. Representative images of SUN1-positive cells with small nucleoli (a) and SUN1-negative cells with enlarged nucleoli (b) are enlarged at the bottom. The areas of the nucleoli in SUN1-positive or in SUN1-negative cells were 118 ± 39 and 37 ± 19, respectively (n >10 cells). (B) Cancer-associated non-cancerous mammary ducts composed of heterogenous population of cells are shown. Small inflammatory cells surround the SUN1-positive mammary duct. Scale bar = 50 µm. A cell with strong SUN1-staining (a) localized to the periphery of the duct and has small nucleolus, while one with faint SUN1-staining (b) is inside of the duct and harbors a large nucleolus.
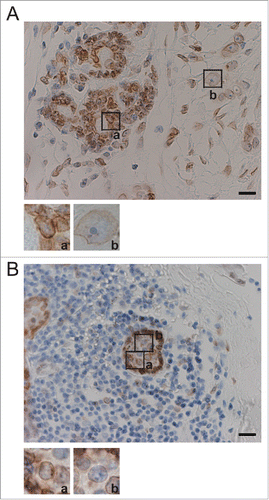
Persistent ducts in cancer-associated noncancerous regions were composed of heterogenous cells. Cells with lower SUN1-staining intensity were sometimes localized inside of the duct, which were surrounded by SUN1-positive cells ( and S5B). Within the duct, cells with decreased SUN1 staining consistently exhibited enlarged nucleoli ( and S5B b). These results suggest that decreased SUN1 expression and nucleolar enlargement occur inside the mammary duct at an early stage in the pathogenesis of breast cancer.
Discussion
In the present study, we used the supervised machine learning algorithm wndchrm to perform quantitative analyses of the morphological changes that occurred upon depletion of NE components. We reveal that depletion of SUN1 induced nucleolar enlargement and simultaneously suppressed rRNA synthesis, which is consistent with findings that SUN1 levels are reduced in more than 80% of breast cancer tissues, which often exhibit nucleolar hypertrophy. Moreover, we discovered a negative correlation between SUN1 expression and nucleolar size in human breast cancer tissues. Our morphological study discovered a novel function of the NE-protein SUN1 that contributes to the maintenance of nucleolar morphology and function.
Unbiased image screening to develop potential diagnostic tools
Despite recent progress in our understanding of the molecular and epigenetic changes that occur in cancer cells, assessment of biopsy samples using light microscopy is required to diagnose cancers, and these observations do not directly reveal the differences between benign and malignant cells at the molecular level. Therefore, identification of the link between specific molecules and cancer cell morphology is critical to develop novel diagnostic tools and therapies.
The phenotype-specific image classification strategy may be limited when image features change under different conditions such as in cells transfected with specific and control siRNAs. However, the classification method provided by wndchrm is simple to perform if a sufficient number of images is available to define a “class,” which is distinct from the common approach that defines, extracts, and analyzes certain objects and features.
Here we used the machine learning algorithm wndchrm to measure and classify the degree of morphological differences captured by imaging. Depletion of SUN1, SUN2, and lamin A/C caused changes that were sufficiently significant to classify features with high accuracy (e.g. 100% for siSUN1, 99.2% for siSUN2, and 99.6% for siLMNA) (). Image quantification technologies using machine learning algorithms such as wndchrm may be applied as unbiased screening tools to measure objectively the morphological changes in siRNA or in CRISPR/Cas9 screening and to validate the transformation of normal cells to the malignant phenotype. Our present findings highlight the novel function of the LINC complex that specifies the properties of nucleolar structures and the potential of this new knowledge to facilitate the development of novel diagnostic tools.
How does depletion of SUN1 alter the nucleolar structure?
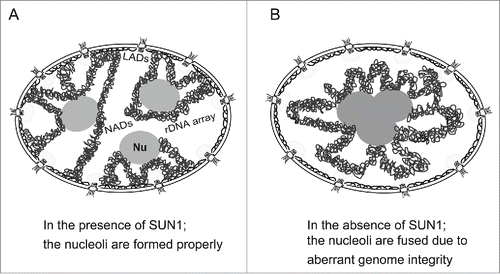
We show here that depleting SUN1 from human mammary epithelial cells led to the enlargement of nucleoli and a reduction in their number without altering the total area of the nucleoli in the nucleus. We assume that nucleolar enlargement was caused by nucleolar fusion, and we envisage several possible mechanisms underlying the effect of depleting SUN1 on nucleolar morphology. First, the nucleoli may fuse because of the loss of appropriate chromosomal distribution in the nucleus (). Nucleoli may tend to fuse intrinsically, which may be inhibited because of chromosomal tensions derived from local chromosomal anchoring (). Under normal conditions, a portion of the chromosomes are anchored at the nuclear periphery through lamin A/C and the lamin B receptor (LBR).Citation38 SUN1 interacts with lamins A/C and B1/B2.Citation1 Upon depletion of NE components, chromosomes tethered at the nuclear periphery may be released from the nuclear membrane, the chromosomal tension is lost, and the nucleoli are free to fuse and enlarge (). Nucleoli changed similarly in lamin A/C- and SUN1-depleted cells, although the extent was greater in SUN1-depleted cells (). It is possible that depletion of SUN1 substantially affected chromatin organization via the lamin A/C and LBR pathways. In contrast, depletion of lamin A/C maintains LBR intact and had diminished effects on chromatin and nucleoli.
Figure 6. Proposed model for nucleolar fusion upon depleting SUN1. (A) Nucleoli are properly formed in the presence of chromatin associated with the nuclear membrane through SUN1. (B) The nucleoli are fused in the absence of chromatin anchoring at the NE through SUN1. Nu, the nucleolus; LADs, lamina-associated domains; NADs, nucleolus-associated chromatin domains.
Second, loss of SUN1 may prevent proper formation of the nucleolar core, the number of FC regions, or both via association with chromatin, leading to the formation of the enlarged nucleolus. Recent studies found that NADs associate with the nucleolus and the nuclear membrane and reposition after cell division.Citation40 SUN1 interacts with telomeres during meiosis and after mitosis,Citation41,42 and NAD overlaps the telomere. Thus, SUN1 may interact with NADs and influence the formation of the nucleolus. Third, SUN1 may sequester certain nucleolar proteins and influence the formation of the nucleolus. The nucleolus contains many proteins that possess functions other than that required to produce ribosomes. Examples include DNA replication, telomere metabolism, cell-cycle progression, and cell polarity.Citation43-49 Several nucleolar proteins shuttle between the nucleolus and the NE.Citation50,51 SUN1 interacts with various nucleolar proteins such as the yeast SUN1 homolog MPS3 that interacts with EBP2 and RES1 at the NECitation50 and could therefore affect the formation of the nucleolus. Last, the LINC complex may influence nucleolar fusion via the cytoskeleton, and the loss of SUN1 induces the formation of enlarged nucleoli. This seems likely, because the cytoskeleton regulates the fusion of nucleoli,Citation52 and SUN proteins interact with actin filaments via members of the nesprin family.
How does the depletion of SUN1 suppress rRNA production?
Tumor cells often show nucleolar hypertrophy that may represent a morphological counterpart of up-regulated ribosome biogenesis.Citation19-24 However, the presence of enlarged nucleoli does not always correlate with activated rRNA synthesis, and the causal relationship between nucleolar enlargement and activated rRNA synthesis is unclear.Citation6,53,54 Therefore, we hypothesize that, in addition to the enlarged nucleoli induced by activated rRNA synthesis, other factors may induce nucleolar hypertrophy.
SUN1 contributes to the DNA damage response (DDR),Citation55 and rRNA synthesis is inhibited following DNA damage.Citation56,57 Because γ-H2AX, a marker for DNA damage, accumulates when SUN1 expression is inhibited in HeLa cells,Citation42 loss of SUN1 function may halt the DDR, leading to the suppression of rRNA synthesis. However, in MCF10A cells, depleting SUN1 did not induce the accumulation of γ-H2AX (data not shown). Therefore, the suppression of rRNA synthesis in SUN1-depleted MCF10A cells is independent of the DDR. There are several possible alternative explanations for decreased rRNA synthesis in SUN1-depleted cells. First, in yeast, the SUN1 homolog, MPS3 interacts with Sir4, which is a member of the Sir2 family of NAD+-dependent histone deacetylases, and suppresses rRNA synthesis.Citation58 Therefore, SUN1 may interact with the mammalian ortholog of the Sir2 family SIRT1, and SIRT1 may be released from the NE in the absence of SUN1 to suppress rRNA synthesis. Second, altered gene positioning in SUN1-depleted cells may increase perinucleolar heterochromatin and modify gene expression, including that of rRNA gene. Alternatively, the decrease in rRNA synthesis may be caused by fewer and larger nucleoli that reduce the surface area of the nucleolus, which serves as the platform for rRNA gene transcription.
Materials and methods
Cell culture
The human mammary epithelial cell line MCF10A (ER−, PgR−, HER2–) (ATCC CRL-10317) was cultured as previously described.Citation59
Pap stain
MCF10A cells were seeded into a two-well chamber (SCS-002, Matsunami Glass), and after 72 h incubation, cells were fixed with 99% ethanol. The slides were then sequentially dipped in 80% and 70% ethanol (10 times each) and washed with distilled water. Nuclei were stained with Gill hematoxylin (Muto Pure Chemical, Ltd.). The slides were then washed with distilled water and dipped in 70% ethanol (10 times) and 70% ethanol containing 1% hydrochloric acid (five times). Slides were washed with distilled water and then sequentially with 70% and 99% ethanol (10 times). The cytoplasm was stained with OG-6 (Muto Pure Chemicals, Ltd.) and EA-50 (Muto Pure Chemicals, Ltd.). Each process was followed by two washes with 99% ethanol to remove excess stain, and the slides were dehydrated with 99% ethanol, cleared with xylene, and mounted ().
siRNA transfection
siRNAs specific for the SUN1 coding region (siGENOME SMARTpool siRNAs, a mixture of #1, GCACAAACAAAUCAGCUUU; #2, GGUAACUGCUGGGCAUUUA; #3, GAACACAGCGGGUGGAUGA; and #4, CGACACAGCUUUCCAAAUA), the SUN2 coding region (siGENOME SMARTpool siRNAs, a mixture of #1, CCACAGCCGUUACCUUAGA; #2, CCUAUGGGCUGCAGACAUU; #3, GCAAGAUCCUCACCCAUGU; and #4, GCACACACCUCCUACUACA) and a nontargeting siRNA pool (siGENOME, mixture of four nontargeting siRNAs) were obtained from Thermo Fisher Scientific. siRNAs specific for sequences encoding lamin A/C (CUGGACUUCCAGAAGAACA) were purchased from Santa Cruz Biotechnology, Inc. MCF10A cells were seeded in dish at 0.5–2 × 10⁵ cells per two-well chamber (Matsunami Glass) for immunofluorescence and real-time PCR assays. The cells were transfected with siRNAs using Lipofectamine RNAiMAX (Life Technologies) according to the manufacture's protocol. The cells were incubated for 72 h before analysis.
Imaging pap-stained cells
Images of Pap-stained cells were obtained using a Nikon Plan Apo 40× objective lens. Colored images were used, because they required fewer images than gray-scale images to equalize the quality of image analyses (data not shown). The background of captured images was subtracted using Image J (http://imagej.nih.gov/ij/).
Quantitation of morphological differences
To measure morphological differences and classify images, we performed supervised machine learning using the pattern recognition software wndchrm ver1.31.Citation35,60,61 The sizes of images used for the analyses were 1280 × 960 pixels ( and S2), 80 × 80 pixels ( and S3), 10 × 10 pixels ( and S4) and 200 × 200 pixels (). Numbers of training/test images were 14/6 (), 48/12 (), 60/15 () and 10/3 (). Images were tiled as follows; −t6 (into 36 images) for , −t4 (into 16 images) for , −t2 (into 4 images) for , and −t0 (no tiling) for . Cross-validation tests were automatically repeated 20 times. Phylogenies were computed using the Fitch–Margoliash method implemented in the PHYLIP package,Citation62 according to class similarity values reported by wndchrm. Morphological distances were calculated as the Euclidian distances (d = √Σ(A–B)Citation2) from the values in the class probability matrix obtained from cross-validations.Citation28 Fisher scores were computed frm 4,008 feature variables that were derived from followings: Chebyshev-Fourier transform, Chebyshev Statistics, Combined First Four Moments, Fractal Statistics, Haralick Texture, Multiscale Histogram, Radon Transform Statistics, Zernike Polynominals, Edge Statistics, Gabor Textures, Object Statistics and Tamura Textures.Citation31
Antibodies
Rabbit anti-SUN1 and anti-SUN2 pAbs were purchased from Sigma-Aldrich and Millipore, respectively. Goat anti-lamin A/C pAbs and a mouse anti-lamin A/C mAb were from Santa Cruz. Biotechnology, Inc. Antibodies used to detect markers for each subcompartment of the nucleolus were as follows: mouse anti-UBF monoclonal antibody (mAb) (clone #F-9, sc-13125, Santa Cruz Biotechnology, Inc.) for the FC, mouse anti-FBL mAb (clone #38F3, ab4566, Abcam) for the DFC, and rabbit anti-NPM pAb (sc-6013-R, Santa Cruz Biotechnology, Inc.) for the GC.
Immunofluorescence analysis
Cells grown on glass coverslips were fixed with 4% paraformaldehyde in PBS and permeabilized with 0.5% Triton X-100 for 5 min. Cells were then blocked and reacted with the appropriate primary antibody followed by secondary antibodies, Cy3 or FITC conjugated donkey anti-rabbit IgG and Cy3 or FITC conjugated donkey anti-mouse IgG (Jackson ImmunoResearch Laboratories, UK) and viewed with an epifluorescence microscope Olympus IX81 (Olympus).
Real-time reverse transcription PCR
Total RNA was isolated from cultured cells using the Pure Link RNA mini kit (Ambion) and was reverse transcribed using the Prime Script RT reagent (Takara, Japan). The levels of pre-rRNA were quantitated using real-time PCR using a LightCycler 480 System (Roche Diagnostics, Switzerland) and normalized to those of GAPDH mRNA. Experiments were performed at least three times. The sequences of the primer sets used were as follows: GAPDH, 5′-CCCATCACCATCTTCC-3′, and 5′,-CAGAGATGATGACCCTTT-3′; 45S pre-rRNA, 5′,-GAACGGTGGTGTGTCGTTC-3′, and 5′,-GCGTCTCGTCTCGTCTCACT-3′.Citation63
Quantitative image analysis of the nucleolus
Cells were transfected with an siRNA specific for SUN1 mRNA or nontargeted siRNAs and incubated for 72 h. Cells were then fixed and stained with anti-FBL and DAPI. Images were acquired using an Olympus IX81 epifluorescence microscope and subsequently analyzed using a HCS Studio program equipped for cell image analyzer and (Cell Insight, Thermo Fisher Scientific). To recognize the FBL-labeled nucleolus, we used the spot detector algorithm of the bioapplication protocol (Thermo Fisher Scientific). First, nuclei stained with DAPI were identified as main objects, the nucleoli in the segmented nucleus were identified as spots, and the areas and signal intensities of the spots were measured. The signal intensity per unit area of the nucleolus was calculated as follows: total signal intensity per nucleus/total nucleolar area.
Metabolic labeling of rRNA
Pre-rRNA was labeled using 3H-UTP as described previously.Citation64 Briefly, cells were transfected with siRNA specific for SUN1 mRNA and incubated for 72 h. The cells were pulse-labeled with [3H]-uridine for 30 min and further incubated with fresh medium containing cold uridine (0.5 mM) for the indicated period. Total RNA (9 µg) was analyzed using gel electrophoresis and fluorography.
Immunohistochemical analysis of tissues
Immunohistochemistry was performed as previously described.Citation14 Formalin-fixed paraffin-embedded specimens were stained as previously described.Citation14 Briefly, samples were obtained from patients with breast cancer who underwent surgery between 2000 and 2004 at the Osaka Police Hospital (Osaka, Japan). The study commenced after patients granted their informed consent and the Osaka Police Hospital Ethics Committee approved our study, which was conducted according to institutional ethical and legal guidelines.
Abbreviations
| CA | = | classification accuracy |
| DFC | = | dense fibrillar component |
| FC | = | fibrillar center |
| GC | = | granular component |
| H&E | = | hematoxylin and eosin |
| INM | = | inner nuclear membrane |
| LAD | = | Lamina-associated domain |
| LINC | = | complex, linker of nucleoskeleton and cytoskeleton |
| NAD | = | nucleolar-associated domain |
| NE | = | nuclear envelope |
| ONM | = | outer nuclear membrane |
| Pap stain | = | Papanicolaou stain |
| rDNA | = | rDNA |
| Wndchrm | = | weighted neighbor distances using a compound hierarchy of algorithms representing morphology |
Disclosure of potential conflicts of interest
No potential conflicts of interest were disclosed.
2015NUCLEUS0060R-file004.xlsx
Download MS Excel (136.8 KB)2015NUCLEUS0060R-file003.xlsx
Download MS Excel (10.4 KB)2015NUCLEUS0060R-file002.docx
Download MS Word (28.4 KB)2015NUCLEUS0060R-f07-z-bw.pdf
Download PDF (114.8 KB)2015NUCLEUS0060R-f08-z-4c.pdf
Download PDF (15.2 MB)2015NUCLEUS0060R-f09-z-4c.pdf
Download PDF (4.4 MB)2015NUCLEUS0060R-f10-z-4c.pdf
Download PDF (134.6 KB)2015NUCLEUS0060R-f11-z-4c.pdf
Download PDF (7.3 MB)Acknowledgments
We are grateful to Dr. Sachiko Nagumo (Osaka University) for valuable discussions and microscope equipment, to Drs. Yuhki Yokoyama (The Wistar Institute) and Yasushi Hiraoka (Osaka University) for valuable discussions, and to Mitsuru Kumabe and Tatsuro Yamamoto (Kumamoto University), Kumiyo Hirai (Osaska University) and Junko Imada (Osaka University) for technical assistance. This study was performed as part of a joint research program with Wako Pure Chemical Industries Ltd.
Funding
This work was supported by the Joint Usage/Research Center for Developmental Medicine, Institute of Molecular Embryology and Genetics, Kumamoto University, by a Grant-in-Aid for Scientific Research from the Japan Society for the Promotion of Science to MH and NS, and by a Grant-in-Aid for Scientific Research on Innovative Areas from the Ministry of Education, Culture, Sports, Science and Technology of Japan to NS.
References
- Crisp M, Liu Q, Roux K, Rattner JB, Shanahan C, Burke B, Stahl PD, Hodzic D. Coupling of the nucleus and cytoplasm: role of the LINC complex. J Cell Biol 2006; 172:41-53; PMID:16380439; http://dx.doi.org/10.1083/jcb.200509124
- Starr DA, Fridolfsson HN. Interactions between nuclei and the cytoskeleton are mediated by SUN-KASH nuclear-envelope bridges. Annu Rev Cell Dev Biol 2010; 26:421-44; PMID:20507227; http://dx.doi.org/10.1146/annurev-cellbio-100109-104037
- Hiraoka Y, Dernburg AF. The SUN rises on meiotic chromosome dynamics. Dev Cell 2009; 17:598-605; PMID:19922865; http://dx.doi.org/10.1016/j.devcel.2009.10.014
- Wang N, Tytell JD, Ingber DE. Mechanotransduction at a distance: mechanically coupling the extracellular matrix with the nucleus. Nat Rev Mol Cell Biol 2009; 10:75-82; PMID:19197334; http://dx.doi.org/10.1038/nrm2594
- Guilluy C, Osborne LD, Van Landeghem L, Sharek L, Superfine R, Garcia-Mata R, Burridge K. Isolated nuclei adapt to force and reveal a mechanotransduction pathway in the nucleus. Nat Cell Biol 2014; 16:376-81; PMID:24609268; http://dx.doi.org/10.1038/ncb2927
- Fischer AH, Bardarov S, Jr, Jiang Z. Molecular aspects of diagnostic nucleolar and nuclear envelope changes in prostate cancer. J Cell Biochem 2004; 91:170-84; PMID:14689589; http://dx.doi.org/10.1002/jcb.10735
- Jevtic P, Levy DL. Mechanisms of nuclear size regulation in model systems and cancer. Adv Exp Med Biol 2014; 773:537-69; PMID:24563365; http://dx.doi.org/10.1007/978-1-4899-8032-8_25
- Fischer AH. The diagnostic pathology of the nuclear envelope in human cancers. Adv Exp Med Biol 2014; 773:49-75; PMID:24563343; http://dx.doi.org/10.1007/978-1-4899-8032-8_3
- Capo-chichi CD, Cai KQ, Smedberg J, Ganjei-Azar P, Godwin AK, Xu XX. Loss of A-type lamin expression compromises nuclear envelope integrity in breast cancer. In: Chin J Cancer 2011; 30:415-25
- Wazir U, Ahmed MH, Bridger JM, Harvey A, Jiang WG, Sharma AK, Mokbel K. The clinicopathological significance of lamin A/C, lamin B1 and lamin B receptor mRNA expression in human breast cancer. Cell Mol Biol Lett 2013; 18:595-611; PMID:24293108; http://dx.doi.org/10.2478/s11658-013-0109-9
- Wu Z, Wu L, Weng D, Xu D, Geng J, Zhao F. Reduced expression of lamin A/C correlates with poor histological differentiation and prognosis in primary gastric carcinoma. J Exp Clin Cancer Res 2009; 28:8; PMID:19144202; http://dx.doi.org/10.1186/1756-9966-28-8
- Broers JL, Raymond Y, Rot MK, Kuijpers H, Wagenaar SS, Ramaekers FC. Nuclear A-type lamins are differentially expressed in human lung cancer subtypes. Am J Pathol 1993; 143:211-20; PMID:8391215
- Agrelo R, Setien F, Espada J, Artiga MJ, Rodriguez M, Perez-Rosado A, Sanchez-Aguilera A, Fraga MF, Piris MA, Esteller M. Inactivation of the lamin A/C gene by CpG island promoter hypermethylation in hematologic malignancies, and its association with poor survival in nodal diffuse large B-cell lymphoma. J Clin Oncol 2005; 23:3940-7; PMID:15867203; http://dx.doi.org/10.1200/JCO.2005.11.650
- Matsumoto A, Hieda M, Yokoyama Y, Nishioka Y, Yoshidome K, Tsujimoto M, Matsuura N. Global loss of a nuclear lamina component, lamin A/C, and LINC complex components SUN1, SUN2, and nesprin-2 in breast cancer. Cancer Med 2015; 4:1547-57; PMID:26175118; http://dx.doi.org/10.1002/cam4.495
- Henderson AS, Warburton D, Atwood KC. Location of ribosomal DNA in the human chromosome complement. Proc Natl Acad Sci U S A 1972; 69:3394-8; PMID:4508329; http://dx.doi.org/10.1073/pnas.69.11.3394
- Lam YW, Trinkle-Mulcahy L, Lamond AI. The nucleolus. J Cell Sci 2005; 118:1335-7; PMID:15788650; http://dx.doi.org/10.1242/jcs.01736
- Quin JE, Devlin JR, Cameron D, Hannan KM, Pearson RB, Hannan RD. Targeting the nucleolus for cancer intervention. Biochim Biophys Acta 2014; 1842:802-16; PMID:24389329; http://dx.doi.org/10.1016/j.bbadis.2013.12.009
- Hein N, Hannan KM, George AJ, Sanij E, Hannan RD. The nucleolus: an emerging target for cancer therapy. Trends Mol Med 2013; 19:643-54; PMID:23953479; http://dx.doi.org/10.1016/j.molmed.2013.07.005
- Kurata S, Koga K, Sakaguchi B. Nucleolar size in parallel with ribosomal RNA synthesis at diapause termination in the eggs of Bombyx mori. Chromosoma 1978; 68:313-7; PMID:710235; http://dx.doi.org/10.1007/BF00327166
- Kurata S, Misumi Y, Sakaguchi B, Shiokawa K, Yamana K. Does the rate of ribosomal RNA synthesis vary depending on the number of nucleoli in a nucleus? Exp Cell Res 1978; 115:415-9; PMID:689098; http://dx.doi.org/10.1016/0014-4827(78)90297-5
- Derenzini M, Trere D, Pession A, Govoni M, Sirri V, Chieco P. Nucleolar size indicates the rapidity of cell proliferation in cancer tissues. J Pathol 2000; 191:181-6; PMID:10861579; http://dx.doi.org/10.1002/(SICI)1096-9896(200006)191:2%3c181::AID-PATH607%3e3.0.CO;2-V
- Warner JR. The economics of ribosome biosynthesis in yeast. Trends Biochem Sci 1999; 24:437-40; PMID:10542411; http://dx.doi.org/10.1016/S0968-0004(99)01460-7
- Tsang CK, Bertram PG, Ai W, Drenan R, Zheng XF. Chromatin-mediated regulation of nucleolar structure and RNA Pol I localization by TOR. EMBO J 2003; 22:6045-56; PMID:14609951; http://dx.doi.org/10.1093/emboj/cdg578
- Rudra D, Warner JR. What better measure than ribosome synthesis? Genes Dev 2004; 18:2431-6; PMID:15489289; http://dx.doi.org/10.1101/gad.1256704
- Tokunaga K, Saitoh N, Goldberg IG, Sakamoto C, Yasuda Y, Yoshida Y, Yamanaka S, Nakao M. Computational image analysis of colony and nuclear morphology to evaluate human induced pluripotent stem cells. Sci Rep 2014; 4:6996; PMID:25385348; http://dx.doi.org/10.1038/srep06996
- Shamir L, Ling SM, Scott W, Hochberg M, Ferrucci L, Goldberg IG. Early detection of radiographic knee osteoarthritis using computer-aided analysis. Osteoarthritis Cartilage 2009; 17:1307-12; PMID:19426848; http://dx.doi.org/10.1016/j.joca.2009.04.010
- Shamir L, Ling SM, Scott WW, Jr, Bos A, Orlov N, Macura TJ, Eckley DM, Ferrucci L, Goldberg IG. Knee x-ray image analysis method for automated detection of osteoarthritis. IEEE Trans Biomed Eng 2009; 56:407-15; PMID:19342330; http://dx.doi.org/10.1109/TBME.2008.2006025
- Johnston J, Iser WB, Chow DK, Goldberg IG, Wolkow CA. Quantitative image analysis reveals distinct structural transitions during aging in Caenorhabditis elegans tissues. PLoS One 2008; 3:e2821; http://dx.doi.org/10.1371/journal.pone.0002821
- Shamir L, Orlov N, Mark Eckley D, Macura TJ, Goldberg IG. IICBU 2008: a proposed benchmark suite for biological image analysis. Med Biol Eng Comput 2008; 46:943-7; PMID:18668273; http://dx.doi.org/10.1007/s11517-008-0380-5
- Kitamura H, Matsumori H, Kalendova A, Hozak P, Goldberg IG, Nakao M, Saitoh N, Harata M. The actin family protein ARP6 contributes to the structure and the function of the nucleolus. Biochem Biophys Res Commun 2015; 464:554-60; PMID:26164235; http://dx.doi.org/10.1016/j.bbrc.2015.07.005
- Shamir L, Orlov N, Eckley DM, Macura T, Johnston J, Goldberg IG. Wndchrm - an open source utility for biological image analysis. Source Code Biol Med 2008; 3:13; PMID:18611266; http://dx.doi.org/10.1186/1751-0473-3-13
- Imbalzano KM, Cohet N, Wu Q, Underwood JM, Imbalzano AN, Nickerson JA. Nuclear shape changes are induced by knockdown of the SWI/SNF ATPase BRG1 and are independent of cytoskeletal connections. PLoS One 2013; 8:e55628; PMID:23405182; http://dx.doi.org/10.1371/journal.pone.0055628
- Marshall PN. Papanicolaou staining–a review. Microsc Acta 1983; 87:233-43; PMID:6195507
- Feoli F, Paesmans M, Van Eeckhout P. Fine needle aspiration cytology of the breast: impact of experience on accuracy, using standardized cytologic criteria. Acta Cytol 2008; 52:145-51; PMID:18499986; http://dx.doi.org/10.1159/000325472
- Orlov N, Shamir L, Macura T, Johnston J, Eckley DM, Goldberg IG. WND-CHARM: Multi-purpose image classification using compound image transforms. Pattern Recognit Lett 2008; 29:1684-93; PMID:18958301; http://dx.doi.org/10.1016/j.patrec.2008.04.013
- Jevtic P, Edens LJ, Vukovic LD, Levy DL. Sizing and shaping the nucleus: mechanisms and significance. Curr Opin Cell Biol 2014; 28:16-27; PMID:24503411; http://dx.doi.org/10.1016/j.ceb.2014.01.003
- Guelen L, Pagie L, Brasset E, Meuleman W, Faza MB, Talhout W, Eussen BH, de Klein A, Wessels L, de Laat W, van Steensel B. Domain organization of human chromosomes revealed by mapping of nuclear lamina interactions. Nature 2008; 453:948-51; PMID:18463634; http://dx.doi.org/10.1038/nature06947
- Solovei I, Wang AS, Thanisch K, Schmidt CS, Krebs S, Zwerger M, Cohen TV, Devys D, Foisner R, Peichl L, Herrmann H, Blum H, et al. LBR and lamin A/C sequentially tether peripheral heterochromatin and inversely regulate differentiation. Cell 2013; 152:584-98; PMID:23374351; http://dx.doi.org/10.1016/j.cell.2013.01.009
- Bickmore WA, van Steensel B. Genome architecture: domain organization of interphase chromosomes. Cell 2013; 152:1270-84; PMID:23498936; http://dx.doi.org/10.1016/j.cell.2013.02.001
- van Koningsbruggen S, Gierlinski M, Schofield P, Martin D, Barton GJ, Ariyurek Y, den Dunnen JT, Lamond AI. High-resolution whole-genome sequencing reveals that specific chromatin domains from most human chromosomes associate with nucleoli. Mol Biol Cell 2010; 21:3735-48; PMID:20826608; http://dx.doi.org/10.1091/mbc.E10-06-0508
- Ding X, Xu R, Yu J, Xu T, Zhuang Y, Han M. SUN1 is required for telomere attachment to nuclear envelope and gametogenesis in mice. Dev Cell 2007; 12:863-72; PMID:17543860; http://dx.doi.org/10.1016/j.devcel.2007.03.018
- Crabbe L, Cesare AJ, Kasuboski JM, Fitzpatrick JA, Karlseder J. Human telomeres are tethered to the nuclear envelope during postmitotic nuclear assembly. Cell Rep 2012; 2:1521-9; PMID:23260663; http://dx.doi.org/10.1016/j.celrep.2012.11.019
- Boisvert FM, van Koningsbruggen S, Navascues J, Lamond AI. The multifunctional nucleolus. Nat Rev Mol Cell Biol 2007; 8:574-85; PMID:17519961; http://dx.doi.org/10.1038/nrm2184
- Olson MO, Hingorani K, Szebeni A. Conventional and nonconventional roles of the nucleolus. Int Rev Cytol 2002; 219:199-266; PMID:12211630; http://dx.doi.org/10.1016/S0074-7696(02)19014-0
- Pederson T, Tsai RY. In search of nonribosomal nucleolar protein function and regulation. J Cell Biol 2009; 184:771-6; PMID:19289796; http://dx.doi.org/10.1083/jcb.200812014
- Raska I, Shaw PJ, Cmarko D. New insights into nucleolar architecture and activity. Int Rev Cytol 2006; 255:177-235; PMID:17178467; http://dx.doi.org/10.1016/S0074-7696(06)55004-1
- Yamada H, Horigome C, Okada T, Shirai C, Mizuta K. Yeast Rrp14p is a nucleolar protein involved in both ribosome biogenesis and cell polarity. RNA 2007; 13:1977-87; PMID:17804645; http://dx.doi.org/10.1261/rna.553807
- Scherl A, Coute Y, Deon C, Calle A, Kindbeiter K, Sanchez JC, Greco A, Hochstrasser D, Diaz JJ. Functional proteomic analysis of human nucleolus. Mol Biol Cell 2002; 13:4100-9; PMID:12429849; http://dx.doi.org/10.1091/mbc.E02-05-0271
- Warner JR, McIntosh KB. How common are extraribosomal functions of ribosomal proteins? Mol Cell 2009; 34:3-11; PMID:19362532; http://dx.doi.org/10.1016/j.molcel.2009.03.006
- Horigome C, Mizuta K. Ribosome biogenesis factors working with a nuclear envelope SUN domain protein: new players in the solar system. Nucleus 2012; 3:22-8; PMID:22156743; http://dx.doi.org/10.4161/nucl.18930
- Horigome C, Okada T, Shimazu K, Gasser SM, Mizuta K. Ribosome biogenesis factors bind a nuclear envelope SUN domain protein to cluster yeast telomeres. EMBO J 2011; 30:3799-811; PMID:21822217; http://dx.doi.org/10.1038/emboj.2011.267
- Lian HY, Jiao GZ, Wang HL, Tan XW, Wang TY, Zheng LL, Kong QQ, Tan JH. Role of cytoskeleton in regulating fusion of nucleoli: a study using the activated mouse oocyte model. Biol Reprod 2014; 91:56; PMID:25061094; http://dx.doi.org/10.1095/biolreprod.114.120188
- Frank DJ, Edgar BA, Roth MB. The Drosophila melanogaster gene brain tumor negatively regulates cell growth and ribosomal RNA synthesis. Development 2002; 129:399-407; PMID:11807032
- Nierras CR, Liebman SW, Warner JR. Does Saccharomyces need an organized nucleolus? Chromosoma 1997; 105:444-51; PMID:9211972
- Lei K, Zhu X, Xu R, Shao C, Xu T, Zhuang Y, Han M. Inner nuclear envelope proteins SUN1 and SUN2 play a prominent role in the DNA damage response. Curr Biol 2012; 22:1609-15; PMID:22863315; http://dx.doi.org/10.1016/j.cub.2012.06.043
- Jackson SP, Bartek J. The DNA-damage response in human biology and disease. Nature 2009; 461:1071-8; PMID:19847258; http://dx.doi.org/10.1038/nature08467
- Lagerwerf S, Vrouwe MG, Overmeer RM, Fousteri MI, Mullenders LH. DNA damage response and transcription. DNA Repair (Amst) 2011; 10:743-50; http://dx.doi.org/10.1016/j.dnarep.2011.04.024
- Zimmer C, Fabre E. Principles of chromosomal organization: lessons from yeast. J Cell Biol 2011; 192:723-33; PMID:21383075; http://dx.doi.org/10.1083/jcb.201010058
- Yokoyama Y, Matsumoto A, Hieda M, Shinchi Y, Ogihara E, Hamada M, Nishioka Y, Kimura H, Yoshidome K, Tsujimoto M, Matsuura N. Loss of histone H4K20 trimethylation predicts poor prognosis in breast cancer and is associated with invasive activity. Breast Cancer Res 2014; 16:R66; PMID:24953066; http://dx.doi.org/10.1186/bcr3681
- Shamir L, Delaney JD, Orlov N, Eckley DM, Goldberg IG. Pattern recognition software and techniques for biological image analysis. PLoS Comput Biol 2010; 6:e1000974; PMID:21124870; http://dx.doi.org/10.1371/journal.pcbi.1000974
- Eliceiri KW, Berthold MR, Goldberg IG, Ibanez L, Manjunath BS, Martone ME, Murphy RF, Peng H, Plant AL, Roysam B, Stuurman N, Swedlow JR, et al. Biological imaging software tools. Nat Methods 2012; 9:697-710; PMID:22743775; http://dx.doi.org/10.1038/nmeth.2084
- Felsenstein J. PHYLIP—Phylogeny Inference Package (Version 3.2). Cladistics 1989; 5:164-6
- Koh CM, Gurel B, Sutcliffe S, Aryee MJ, Schultz D, Iwata T, Uemura M, Zeller KI, Anele U, Zheng Q, Hicks JL, Nelson WG, et al. Alterations in nucleolar structure and gene expression programs in prostatic neoplasia are driven by the MYC oncogene. Am J Pathol 2011; 178:1824-34; PMID:21435462; http://dx.doi.org/10.1016/j.ajpath.2010.12.040
- Pestov DG, Lapik YR, Lau LF. Assays for ribosomal RNA processing and ribosome assembly. Curr Protoc Cell Biol 2008; 39:22.11, 1–22; PMID:18551418