
ABSTRACT
Nucleoli are formed on the basis of ribosomal DNA (rDNA) clusters called Nucleolus Organizer Regions (NORs). Each NOR contains multiple genes coding for RNAs of the ribosomal particles. The prominent components of the nucleolar ultrastructure, fibrillar centers (FC) and dense fibrillar components (DFC), together compose FC/DFC units. These units are centers of rDNA transcription by RNA polymerase I (pol I), as well as the early processing events, in which an essential role belongs to fibrillarin. Each FC/DFC unit probably corresponds to a single transcriptionally active gene. In this work, we transfected human-derived cells with GFP-RPA43 (subunit of pol I) and RFP-fibrillarin. Following changes of the fluorescent signals in individual FC/DFC units, we found two kinds of kinetics: 1) the rapid fluctuations with periods of 2–3 min, when the pol I and fibrillarin signals oscillated in anti-phase manner, and the intensities of pol I in the neighboring FC/DFC units did not correlate. 2) fluctuations with periods of 10 to 60 min, in which pol I and fibrillarin signals measured in the same unit did not correlate, but pol I signals in the units belonging to different nucleoli were synchronized. Our data indicate that a complex pulsing activity of transcription as well as early processing is common for ribosomal genes.
Introduction
Nucleoli are formed on the basis of ribosomal DNA (rDNA) clusters called Nucleolus Organizer Regions (NORs). In human cells these clusters are situated on the short arms of chromosomes 13, 14, 15, 21, 22. Each NOR contains multiple genes, transcriptionally active and silent,Citation1-6 coding for 18S, 5.8S and 28S RNAs of the ribosomal particles.Citation7-11 The prominent components of the nucleolar ultrastructure, fibrillar centers (FC) and dense fibrillar components (DFC), together compose FC/DFC units. These units provide the stage for rDNA transcription by RNA polymerase I (pol I),Citation12-27 as well as the first steps of rRNA processing, in which an essential role belongs to C/D snoRNAs associated protein fibrillarin.Citation28-34 Remarkably, there are reasons to believe that each FC/DFC unit typically accommodates a single transcriptionally active gene,Citation35-38 but this gene apparently forms several coils within DFC and adjacent FC area.Citation9,37,39-41 NORs appear in light microscopy as beads on a string, or nucleolar necklaces.Citation35-37,43,46
In our previous study,Citation42 using specially produced cell lines and correlative light and electron microscopy (CLEM), we found that FC/DFC units correspond to the nucleolar beads positive for the signals of rDNA transcription, pol I, its transcription factors, and components of early rRNA processing machinery. Following the dynamics of the units in the cell cycle, we found that pol I and fibrillarin colocalize in the FC/DFC units for the most part of interphase. But during early S phase, when transcriptionally active ribosomal genes are replicated,Citation44,45 pol I, though not fibrillarin, may transiently disappear from some units. This agreed with our earlier suppositionCitation46 that the transcription machinery withdraws from those FC/DFC units in which DNA is to be replicated, whereas fibrillarin, being not bound to DNA directly, may remain in the units throughout S phase. Since the finding about pol I and fibrillarin was obtained when the signals of these two proteins were observed independently, it also raised a more general question about dynamic relations between the components of rDNA transcription and early rRNA processing machineries in the nucleolus.
In this work, by measuring intensities of pol I and fibrillarin signals in individual FC/DFC units or whole nucleoli in transfected cells, we found that these proteins are engaged in at least two kinds of fluctuations. One may be characterized as intrinsic and relatively quick (with periods of about 2–3 min); the other, as extrinsic and relatively slow (with periods of 10 to 60 min). Both kinds seem to be based upon changing status of rDNA promoter.
Methods
Cell culture, plasmids, and cell lines
Human derived HEP2 (HeLa derivative), HT-1080 (human fibrosarcoma), and HeLa cells were cultivated at 37°C in Dulbecco modified Eagle's medium (DMEM, Sigma, #D5546) containing 10% fetal calf serum, 1% glutamine, 0.1% gentamicin, and 0.85g/l NaHCO3 in standard incubators.
The plasmid constructs for RFP-fibrillarin and RFP-PCNA were received from the Max Planck Institute for Molecular Cell Biology and Genetics, Dresden. GFP-RPA43 and GFP-fibrillarin vectors were received from Laboratory of Receptor Biology and Gene Expression Bethesda, MD.Citation47 The constructs were transfected into HT-1080 cells using Fugene (Qiagen, #E2312), and G418 (GIBCO, #11811031) was used for selection of stable clones with two-colored fluorescence.
We also used two earlier produced cell lines stably expressing: 1) GFP-RPA43 and RFP-PCNA;Citation46 2) GFP-fibrillarin and RFP-PCNA.Citation42
Incorporation of RNA nucleotides
For labeling of transcription sites, sub-confluent cells were incubated for 5 min with 5-fluorouridine (FU) (Sigma, #F5130) at a concentration of 100 μM. The cells were fixed in 2% formaldehyde freshly prepared from paraformaldehyde, permeabilized with Triton X-100, and processed for FU immunocytochemistry.
Immunocytochemistry
Incorporated FU signal was visualized by a mouse monoclonal anti-BrdU antibody (Sigma, #B8434). Primary antibodies against human rRNA polymerase (pol I) and human fibrillarin were kindly provided by Dr. U. Scheer (Biocenter of the University of Wurzburg). We also used polyclonal (rabbit) anti-RPA43 (Thermo Scientific, # PIPA525184). Secondary anti-human and anti-mouse antibodies were conjugated with Alexa 488 (Invitrogen, #H10120) Alexa 532 (Invitrogen, #A-11002), Cy3 (Jackson ImmunoResearch Laboratories, #109-165-088, #111-165-003, #115-025-062,), or DyLight 488 (Jackson ImmunoResearch Laboratories, #109-005-044, #111-475-003, #115-475-003). Coverslips with the cells were then mounted in Mowiol.
Light microscopy
Confocal images were acquired using SP5 (Leica) confocal laser scanning microscope equipped with a 63×/1.4NA oil immersion objective. For in vivo cell imaging we used a spinning disk confocal system based on Olympus IX81 microscope equipped with Olympus UPlanSApo 100×/1.4NA oil immersion objective, CSU-X spinning disk module (Yokogawa) and Ixon Ultra EMCCD camera (Andor). The live cells were maintained in glass bottom Petri dishes (MatTek) at 37°C and 5% CO2 using a microscope incubator (Okolab). For assessment of the technical error during the image acquisition, control measurements of signal intensity dynamics were performed on 170 nm carboxylate yellow-green microspheres (Invitrogen, #P7220).
Software and data analysis
For measurement of FC/DFC units in 3D confocal images, we developed a MatLab based software. The program identifies each unit by creating a maximum intensity projection of the confocal stack and blurring the projection with a Gaussian filter (σ = 8–10 pixels), thresholding the blurred image with a value obtained by Otsu's method for automatic threshold selection. After that, the optical section whereupon the unit had maximum intensity was identified. The final result contains 3D coordinates of each unit, its size (full-width half-maximum), the value of χ2, and integral intensities in the spheres with radii 1.0, 1.5, 2.0, 2.5, 3.0, 3.5, and 4.0 pixels respectively. FC/DFC units were counted after deconvolution with Huygens software.
For measuring signals in the entire nucleoli we used a custom ImageJ pluginCitation46 available at https://github.com/vmodrosedem/segmentation-correlation. Based on the confocal stacks in two channels, the program identifies the regions occupied by nucleoli, measures their areas (in pixels), and the average intensities of both signals within these areas. Additionally it calculates Pearson's correlation coefficient and Spearman's rank coefficient between the signals corresponding to the two channels within the volume of nucleoli.
MatLab software was used for Fourier analysis of the time series.
Results
Quick fluctuations of pol I and fibrillarin signal intensities in the FC/DFC units
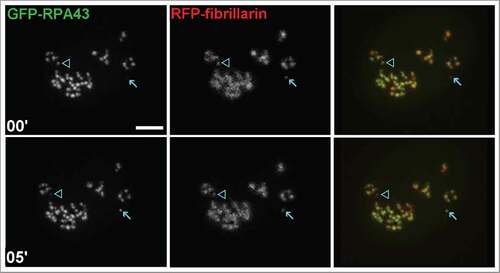
HEP2 and HT1080 cells were transfected with GFP-RPA43 and RFP-fibrillarin, and 3D confocal images of the entire nuclei in two channels were acquired in vivo every 1 or 2 minutes for 10–15 min. The fluorescent signals in both channels appeared mostly in the form of nucleolar beads which correspond to the FC/DFC units.Citation42 Remarkably, in a few beads the RPA43 signal became invisible or scarcely visible, but was restored in several minutes, while the fibrillarin signal remained intensive (). These observations confirm our earlier hypothesisCitation46 about a transient withdrawal of pol I processing machinery, from the FC/DFC units involved in DNA replication.
Figure 1. HEP2 cells transfected with GFP-RPA43 (green) and RFP-fibrillarin (red). One unit (arrow) had very weak pol I signal, at the beginning of observation, but after 5 minutes it was restored. In contrast, another unit (arrowhead) originally had pol I signal, but lost it after 5 min (compare top left and bottom left images). Both marked units preserved their fibrillarin signals (top middle and bottom middle images). Scale bar: 3 µm
In the images of the transfected cells, we measured the intensity of GFP-RPA43 and RFP-fibrillarin signals in individual FC/DFC units in one central pixel of each unit, or within a circular region of interest with total area of 9 square pixels. These two methods provided similar results, but the latter seemed more precise. The measurements were based on pol I signal, since it reveals the units more distinctly than fibrillarin signal. In both HEP2 and HT1080 cells, we found that the intensities of pol I and fibrillarin fluctuated in anti-phase manner (). In other words, increase of one signal was usually attended by decrease in the other and vice versa. The values of Pearson correlation of the sequential differences (RΔ), which we selected as a measure of synchrony for the quickly changing signals, had variable, but always negative, values ranging between −0.25 and −0.98. Relative Standard Deviation (RSD) of the fluctuations for both fibrillarin and pol I was about 10%. In control measurements of synthetic yellow-green microspheres (see Methods, section Light microscopy) the RSD ranged between 1% and 3% (). Spectral analysis based on Fourier transformation of the time series with 1 min intervals revealed two maxima: at about 2 and 3 min (). Similar fluctuations were recorded in the cell lines with stable expression of GFP-RPA43/RFP-PCNACitation46 and GFP-fibrillarin/RFP-PCNACitation42 at all stages of interphase ().
Figure 2. Rapid anti-phase fluctuations of signal intensities measured in FC/DFC units of HEP2 (A) and HT1080 (B) cells transfected with GFP-RPA43 (green) and RFP-fibrillarin (red). Each graph represents measurements with 2 min interval in an individual unit. Correlations of the sequential differences (RΔ) have negative values in all cases. C: control measurements of intensity of green (graphs 1, 2) and yellow (graphs 3, 4) 170 nm carboxylate fluorescent microspheres
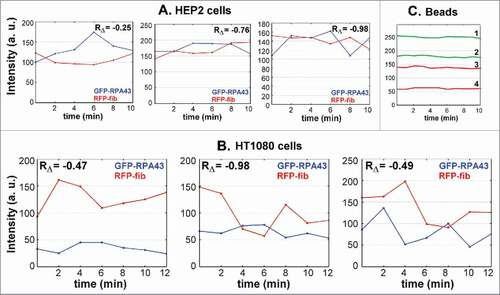
Figure 3. Characteristics of the rapid fluctuations of pol I and fibrillarin signal in FC/DFC units. (A) Fourier analysis of the time series for transfected HEP2 cells. The averaged periodogram shows two peaks at about 2 and 3 min. The data are obtained from 20 records with 1 min intervals. (B) Quick fluctuations of pol I (top) and fibrillarin (bottom) signals in the stable cell lines expressing GFP-RPA43/RFP-PCNA and GFP-fibrillarin/RFP-PCNA respectively. Examples of individual units showing that the fluctuations appear in G1, early S (S1) and late S (S4) phases of cell cycle. (C) Simultaneous signal in eight units (numbers and arrows on the left panel) belonging to one nucleolar necklace of the transfected HT1080 cell. Records of pol I signal intensities measured with interval of 1 min (graph on the right) show absence of correlation between the neighboring units. Occasional correlations at certain time points may be random events; alternatively they may result from the slower fluctuations which have a tendency to synchrony (see ). (D, E) Mutual independence of the signal variations in 10 neighboring FC/DFC units belonging to one nucleolar necklace. (D) Variations of the intensity of GFP-RPA43 signal in one unit (ΔI) do not correlate with variations of the average distance to its 2 nearest neighbors (ΔD). (E) Variations in the intensity of GFP-RPA43 signal in one unit (ΔI) do not correlate with summed up variations of intensity in the two nearest neighbors, calculated as: ΔI(S) = ΔIp + ΔIf, i.e., sum of variations of signal intensity in the preceding (p) and following (f) unit. The order of the units in the necklace was selected arbitrarily. Scale bar: 2 µm
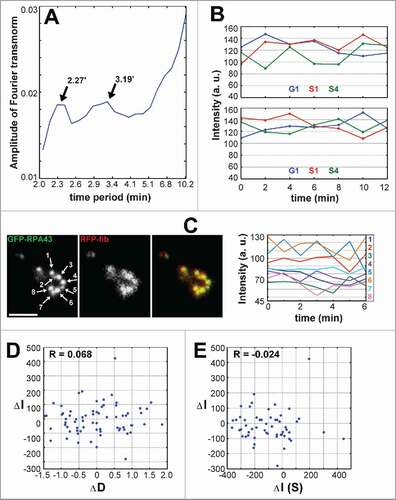
Remarkably, the fluctuations of pol I signal in the FC/DFC units belonging to the same nucleolus, even to the same nucleolar necklace (), usually did not correlate. This lack of synchrony indicates that the observed quick fluctuations could not be caused by the technical errors of microscopy, but reflected variations of functional state in the individual units.
On the other hand, the fluctuations must be based on an exchange of the proteins between FC/DFC units and their near environment, i.e. the granular component of the nucleoli. Besides, as we found earlier, the units are involved in permanent motion, the distances between them significantly changeCitation42 (Smirnov et al, 2016). This implies that fluctuations in the neighboring units may influence one another. To explore this possibility, we measured 3D distances between the centers of closely situated FC/DFC units, as well as the intensities of their GFP-RPA43 signal, in series of observations with 1 min interval. In these experiments we found that mere lengthening/shortening distances between the units did not correlate with the intensities of their signals (). We also could not detect any effect of variation (increase or decrease) of pol I signal in the neighboring units ().
Thus our observations revealed quick anti-phase fluctuations of pol I/fibrillarin levels, which seemed to occur in each individual FC/DFC unit more or less independently.
Slower fluctuations of pol I and fibrillarin signal intensities in the nucleoli
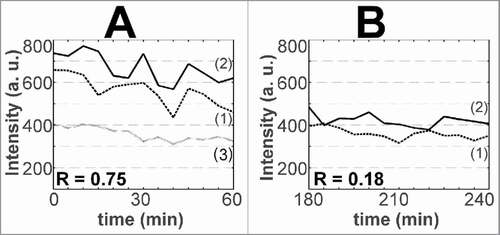
Observations during 1–2 hrs with intervals of 5 min revealed other fluctuations in the intensities of GFP-RPA43 and RFP-fibrillarin signals in the FC/DFC units. The corresponding periodogram had a larger peak at about 60 min, and two other peaks at about 20 and 10 min (). At this time scale, the pol I and fibrillarin signals in the units seemed to fluctuate independently. The Pearson correlation (R) of the signals could take both positive and negative values, and on average did not significantly differ from 0 (). But when the signal intensities were measured in the whole nucleolar areas defined by a software (see “Methods”) the GFP-RPA43 and RFP-fibrillarin signals correlated positively, with R about +0.5. This synchrony probably reflects a periodicity in the exchange of proteins between the nucleoli, in which granular component is predominant, and nucleoplasm.
Figure 4. Fluctuations of pol I and fibrillarin signal intensities in FC/DFC units observed with 5 min intervals. (A) Fourier analysis of the time series for transfected HEP2 cells. The averaged periodogram shows three peaks at about 10, 20, and 60 min. The data are obtained from 20 records with 5 min intervals. (B) Fluctuations of GFP-RPA43 (continuous line) and RFP-fibrillarin (dotted line) signals measured in the same unit do not correlate significantly. The graphs represent the records of three units. (C) Synchrony of GFP-RPA43 signals in three FC/DFC units measured in different nucleoli of the same cell (left graph). The mean value of the correlation (R) is increased after removal of the trends (right graph), which suggests presence of low frequency components in the time series
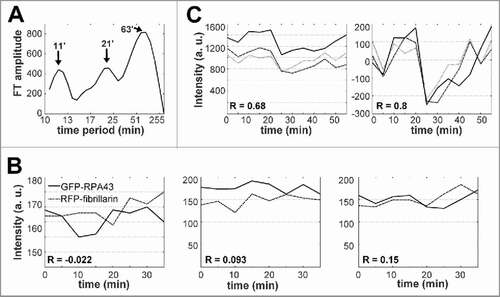
The fluctuations of the pol I signals in the different units belonging to the same nucleolar necklace, or even to different nucleoli of the same cell, were synchronous: the correlation (R) always took positive values; the average for 20 pairs of nucleoli was +0.66 ± 0.21. RSD of the fluctuations (used as a measure of their amplitude) was 9.1 ± 0.9%. After removing trends and normalizing the time series, the values of R significantly increased (). This suggests a contribution of still lower frequencies which could not be detected in our observations.
The signal intensities measured in the whole nucleoli also fluctuated, but less distinctly than in the individual FC/DFC units; RSD was 1.5 ± 0.2%. The fluctuations of the signal in different nucleoli within the same cell nucleus showed signs of synchrony with variable correlation ranging from +0.1 to +0.6.
Treatment of the cells with 0.05 g/ml ActD for 10 min inhibited incorporation of 5-fluorouridine (FU)Citation48 and caused subsequent disintegration of the nucleoli even if the cells were transferred to the fresh cultivation medium. But during the first hour of the treatment, the pol I signal in the FC/DFC units remained intensive, and its fluctuations in the neighboring units still positively correlated (). Fibrillarin signal in the cells was preserved, but its fluctuations were reduced (), and after removal of the trend caused by fluorescence bleaching, correlation of the signal intensity in the neighboring units did not significantly differ from 0. This disappearance of synchrony in the presence of Act D indicates that the fluctuations of the fibrillarin signal depend on elongation of rRNA. After 3 h in fresh medium, when the structure of the nucleoli was ruined, and the units fused into larger structures resembling NORs, the fluctuations of pol I signal intensity also became asynchronous, and their amplitudes were decreased ().
Figure 5. Fluctuations of pol I and fibrillarin signal intensity in FC/DFC units in HT1080 cells after inhibition of rRNA transcription with 0.05 µg/ml ActD for 10 min. (A) During the first 1 h after the treatment, fluctuations of GFP-RPA43 signal in two neighboring units (1) and (2) still correlate positively, but fluctuations of RFP-fibrillarin signal (3) are reduced to a low amplitude noise. (B) 3 h after the treatment. The fluctuations of intensity measured in GFP-RPA43 foci decline and lose their synchrony. The foci do not correspond to individual FC/DFC units, but were produced by their fusion after inhibition of pol I activity
Thus the observations of FC/DFC units during 1–2 h revealed other fluctuations of pol I signal characterized by longer periods, general synchrony of all nucleoli in the cell nucleus, and no pronounced correlation with fibrillarin signal.
Correlation of pol I and fibrillarin signals with transcription signal in the nucleoli
To correlate our data on the intensity of protein constructs with the nucleolar transcription, we incubated HT 1080 cells with FU; after fixation of the cells, we visualized FU, pol I and fibrillarin by the respective antibodies (). In such preparations, the intensity of signals was measured either for the entire nucleolar areas defined by the software or in all (pol I or fibrillarin positive) FC/DFC units. Intensities of anti-pol I and anti-fibrillarin signals always positively correlated with intensity of transcription signal. When the measurements included the entire nucleoli (), correlation between pol I and FU signals did not differ significantly from the correlation between fibrillarin and FU signals (0.77 ± 0.03 and 0.76 ± 0.03 respectively). This is not surprising, since both proteins are accumulated within FC/DFC units. But when the correlation was measured within the units, it was higher between pol I and FU signals (0.85 ± 0.03), and considerably lower between fibrillarin and FU signals (0.34 ± 0.02) (). Comparing parameters of the intensity distributions, we found further similarities between pol I and the transcription signals. Both distributions showed asymmetry with positive skewness (+0.29 and +0.30 respectively); the values of RSD were 0.22 for pol I and 0.25 for FU. RSD for the values of GFP-RPA43 signal intensity measured in one unit at different time points was lower, i.e., about 0.1 (see section 2 of the Results), apparently because FC/DFC units are more precisely defined by GFP signal than by immunofluorescence.
Figure 6. Correlation of pol I and fibrillarin signal intensity with intensity of transcription signal in HeLa cells. (A, B) Anti-pol I (green, A) and anti-fibrillarin (green, B) signals show similar correlation with the signal of incorporated 5′ fluorouridine (FU) (red), when the signal intensities are measured in the entire nucleoli. Contours of the nucleoli determined by a software (see Methods) are shown by blue line. (C, D) The signal intensities measured within FC/DFC units. (C) The positive correlation between anti-pol I and anti-FU signals is higher than in A. (D) Correlation between anti-fibrillarin and anti-FU signals is much lower than in B. Scale bar: 5 µm
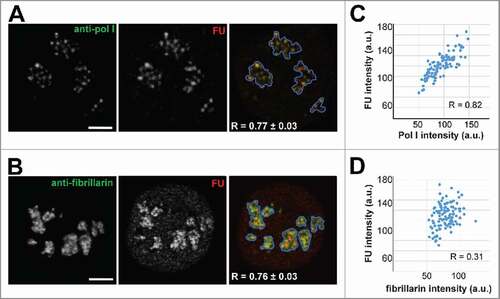
Together the data presented in this section indicate that the observed fluctuations of pol I signal in FC/DFC units are closely related to fluctuations of their transcription intensity.
Exchange rates of fibrillarin and pol I are related to their fluctuations in FC/DFC units
We studied recovery of GFP-RPA43 and RFP-fibrillarin signals in the transfected cells after photobleaching of single FC/DFC units with two lasers (405 nm and 560 nm) (). On average, the mobile fraction was higher for fibrillarin than for pol I (), but the mean value of the half-life time for both proteins was about 20 sec. This indicates that the mobile fractions of pol I and fibrillarin could undergo multiple cycles of exchange during one period of fluctuations described in the first two sections of our Results.
Figure 7. Double-channel FRAP analysis of pol I and fibrillarin signals in individual FC/DFC units. (A) GFP-RPA43 (top panel) and RFP-fibrillarin (mid panel) signals were bleached in one unit defined by broken line. Bottom panel shows overlay of the two channels. (B) FRAP kinetics for the units shown in A. Table at the bottom shows averaged parameters. The mean values of half-life for pol I and fibrillarin do not differ significantly, but fibrillarin has larger mobile fraction within the units. (C) FRAP experiment as in A and B, but with extended pre-bleach period. Selected are assays in which the anti-phase dynamic (see ) appeared clearly during the 60″ pre-bleach period. When intensity of pol I signal is at its higher values (left graph), the half-life of its subsequent recovery proves to be shorter than the half-life of the fibrillarin signal in the same FC/DFC unit. The right graph represents the reverse situation. Values of half-life (t1/2) are indicated over the respective curves. These data suggest a correlation between anti-phase fluctuations of the signal intensity and the exchange rates of pol I and fibrillarin in FC/DFC units. Scale bar: 2 µm
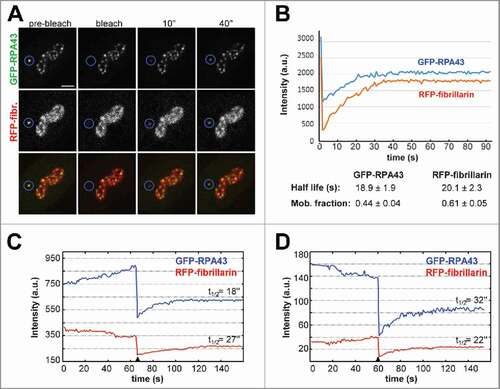
Since the value of half-time varied considerably among individual FC/DFC units, we supposed that this variability may be linked to the anti-phase fluctuations of pol I and fibrillarin intensities. To examine this possibility, we conducted FRAP experiments with extended pre-bleach period and selected the cases in which the anti-phase dynamic was noticeable before the bleaching (), i.e., pol I and fibrillarin signals appeared to reach or approach the opposite extremes of their variations. In such cases, when intensity of one of the signals was at its higher/lower values, the half-life of its subsequent recovery proved to be shorter/longer than the half-life of the other signal in the same FC/DFC unit.
These data suggest that the described fluctuations of fibrillarin and pol I signals, as well as the intensity of transcription in individual FC/DFC units, may indeed correlate with the exchange rates of those proteins
Discussion
In the present study we followed in real time the fluorescent signals of RPA43 subunit of pol I and fibrillarin in the nucleoli of human derived cells. Since intensity of such signals positively correlates with the actual number of the fusion protein molecules within the region of interest,Citation49 our data refer to the changing contents of nucleoli. Measuring the signal intensities of GFP-RPA43 and RFP-fibrillarin in the FC/DFC units, we observed specific fluctuations of two kinds. Firstly, in the short term experiments, when images were taken every 1–2 min, the pol I and fibrillarin signals fluctuated in anti-phase manner (), and the intensities of pol I in the neighboring FC/DFC units belonging to the same NOR did not correlate (), which shows that these rapid fluctuations cannot be attributed to artifacts or technical errors. Secondly, in the longer observations with intervals of 5 min, correlation of pol I and fibrillarin signals measured in the same unit became uncertain; but we found well defined synchrony of pol I signals in the units belonging to different nucleoli (). Here again technical error could not be the chief source of the fluctuation, since the intensities of fibrillarin signal in different FC/DFC units were not synchronized.
Our work seems to be related to the recent studies of discontinuous, bursting, or pulsing expression of various genes in the nucleoplasm.Citation49-52 Irregular pulses of activity, alternated with pulses of silence, were visualized in living cells by inserting into genome, downstream of the promoter, sequences encoding stem loops of RNA, which could be detected with fluorescent bacteriophage coat proteins, such as MS2 or PP7.Citation50,55 Alternatively, transcription output has been monitored by single molecule RNA fluorescence in situ hybridization (smFISH).Citation56,57 Our work provides an approach to the study of irregular activity of ribosomal genes. Indeed, since we found high correlation of pol I and incorporated FU signals within FC/DFC units (), which probably correspond to individual transcriptionally active units of rDNA,Citation35,36,38 the observed fluctuations of RPA43 signal follow pulsing activity of ribosomal genes. Remarkably, distribution of pol I and FU signal intensities measured in FC/DFC units showed considerable positive skewness (see Results, section 3), and this agrees with the models of pulse-like, rather than continuous, activity of the promoters.Citation53
Different kinetics of the transcription output is peculiar to a specific sort of gene or current status of the cell. Our study indicates that each ribosomal gene may be engaged simultaneously in at least two kinds of fluctuations. In the first kind, which is characterized by periods about 2–3 min (, ), the pol I signals, as well as the corresponding transcription rates, in the neighboring FC/DFC units fluctuated independently. Such behavior, supposedly caused by inherent stochasticity of the transcription, was termed “intrinsic”.Citation58-64 But the second kind of fluctuations, in which the units belonging to different nucleoli showed a pronounced synchrony (), apparently depends on variations in the state of cell nucleus, especially in the levels of pol I, its co-enzymes, and RNA nucleotides. Such kind of pulsation may be related to the “extrinsic.”Citation58,59,64 Our data about the synchronous fluctuations of pol I signal seem to agree with the results of direct measurements of rDNA transcription in the entire nucleoli by label-free confocal Raman microspectrometry.Citation65 Notably, in this work, as well as in ours, the extended periods of silence known from the studies of other genesCitation50 were not detected. Perhaps such periods just cannot be discovered without monitoring transcription of individual rDNA units. But it is also likely that production of rRNA molecules pauses for no longer than 1–2 min.
Several models were devised in effort to understand the nature of transcription bursting discovered in cell populations. Some authors analyzing the results of smFISHCitation56,57,66 postulate one state of promoter, whose activity is well characterized by a Poisson distribution. In other models,Citation67-69 the promoter switches stochastically between an active state, in which mRNA is produced with constant probability, and an inactive state, in which transcription does not occur. The extra state increases the potential variability of output from different cells in population or tissue. A still more complicated model of the bursting gene expression is suggested in recent study of actin gene in myxamoeba Dictyostelium.Citation70 The authors interpreted their data as produced by a wide „spectrum” of activity states with variable rates of initiation. Such kind of model may agree with the complex kinetics of pol I signal intensity in FC/DFC units observed in our work (), although in the case of rDNA the multiple genes of similar structure are situated in the same cell nucleus, where some aspects of their activity may be synchronized.
Since the observed fluctuations did not depend on rRNA elongation (), and their amplitudes were relatively low, we suppose that the fluctuating components of transcription machinery are accumulated around the promoters, and the observed variations of the gene output depend on a complex periodicity in the assembly of pre-initiation complex. Moreover, the observed correlation between the exchange rate of pol I and the phase of fluctuation in individual FC/DFC units () indicates that the rDNA promoter may exist in multiple states with different probabilities of initiation.
Thus, our in vivo measurements of pol I and fibrillarin signals in FC/DFC units of mammalian cells show that a complex pulsing or bursting activity of transcription as well as early processing is common for ribosomal genes.
Disclosure of potential conflicts of interest
No potential conflicts of interest were disclosed.
Funding
This work was supported by the Grant Agency of Czech Republic (P302/12/G157), by Charles University (PRVOUK P27/LF1/1 and UNCE 204022), and by OPPK (CZ.2.16/3.1.00/24010).
Related Research Data
References
- Conconi A, Widmer RM, Koller T, Sogo JM. Two different chromatin structures coexist in ribosomal RNA genes throughout the cell cycle. Cell 1989; 57:753-61; PMID:2720786
- Warner JR. The economics of ribosome biosynthesis in yeast. Trends Biochem Sci 1999; 24:437-40; PMID:10542411
- Grummt I, Pikaard CS. Epigenetic silencing of RNA polymerase I transcription. Nat Rev Mol Cell Biol 2003; 4:641-9; PMID:12923526; https://doi.org/https://doi.org/10.1038/nrm1171
- Santoro R, De Lucia F. Many players, one goal: how chromatin states are inherited during cell division. Biochem Cell Biol 2005; 83:332-43; PMID:15959559; https://doi.org/https://doi.org/10.1139/o05-021
- Santoro R. Analysis of chromatin composition of repetitive sequences: the ChIP-Chop assay. Methods Mol Biol 2014; 1094:319-28; PMID:24162999; https://doi.org/https://doi.org/10.1007/978-1-62703-706-8_25
- Zillner K, Komatsu J, Filarsky K, Kalepu R, Bensimon A, Nemeth A. Active human nucleolar organizer regions are interspersed with inactive rDNA repeats in normal and tumor cells. Epigenomics 2015; 7:363-78; PMID:26077426; https://doi.org/https://doi.org/10.2217/epi.14.93
- Henderson AS, Warburton D, Atwood KC. Location of ribosomal DNA in the human chromosome complement. Proc Natl Acad Sci USA 1972; 69:3394-8; PMID:4508329
- Long EO, Dawid IB. Repeated genes in eukaryotes. Annu Rev Biochem 1980; 49:727-64; PMID:6996571; https://doi.org/https://doi.org/10.1146/annurev.bi.49.070180.003455
- Puvion-Dutilleul F, Bachellerie JP, Puvion E. Nucleolar organization of HeLa cells as studied by in situ hybridization. Chromosoma 1991; 100:395-409; PMID:1893795
- Raska I. Oldies but goldies: searching for Christmas trees within the nucleolar architecture. Trends Cell Biol 2003; 13:517-25; PMID:14507479
- Raska I, Shaw PJ, Cmarko D. New insights into nucleolar architecture and activity. Int Rev Cytol 2006; 255:177-235; PMID:17178467; https://doi.org/https://doi.org/10.1016/S0074-7696(06)55004-1
- Raska I, Shaw PJ, Cmarko D. Structure and function of the nucleolus in the spotlight. Curr Opin Cell Biol 2006; 18:325-34; PMID:16687244; https://doi.org/https://doi.org/10.1016/j.ceb.2006.04.008
- Cmarko D, Smigova J, Minichova L, Popov A. Nucleolus: the ribosome factory. Histol Histopathol 2008; 23(10):1291-8; PMID:18712681; https://doi.org/https://doi.org/10.14670/HH-23.1291
- Sirri V, Urcuqui-Inchima S, Roussel P, Hernandez-Verdun D. Nucleolus: the fascinating nuclear body. Histochem Cell Biol 2008; 129:13-31; PMID:18046571; https://doi.org/https://doi.org/10.1007/s00418-007-0359-6
- Bartova E, Horakova AH, Uhlirova R, Raska I, Galiova G, Orlova D, Kozubek S. Structure and epigenetics of nucleoli in comparison with non/nucleolar compartments. J Histochem Cytochem 2010; 58(5):391-403; PMID:20026667; https://doi.org/https://doi.org/10.1369/jhc.2009.955435
- Lam YW, Trinkle-Mulcahy L. New insights into nucleolar structure and function. F1000Prime Rep 2015; 7:48; PMID:26097721; https://doi.org/https://doi.org/10.12703/P7-48
- Raska I, Rychter Z, Smetana K. Fibrillar centers and condensed nucleolar chromatin in resting and stimulated human lymphocytes. Zeitschrift fur mikroskopischanatomische Forschung 1983; 97(1):15-32; PMID:6636959
- Raska I, Armbruster BL, Frey JR, Smetana K. Analysis of ring-shaped nucleoli in serially sectioned human lymphocytes. Cell Tissue Res 1983; 234(3):707-11; PMID:6661758
- Raska I, Reimer G, Jarnik M, Kostrouch Z, Raska K Jr. Does the synthesis of ribosomal RNA take place within nucleolar fibrillary centers or dense fibrillary components? Biol Cell 1989; 65(1):79-82.
- Scheer U, Benavente R. Functional and dynamic aspects of the mammalian nucleolus. Bioessays 1990; 12(1):14-21; PMID:2181998; https://doi.org/https://doi.org/10.1002/bies.950120104
- Dundr M, Raska I. Nonisotopic ultrastructural mapping of transcription sites within the nucleolus. Exp Cell Res 1993; 208(1):275-81; PMID:8359221; https://doi.org/https://doi.org/10.1006/excr.1993.1247
- Raska I, Dundr M, Koberna K, Melcak I, Risueno MM, Torok I. Does the synthesis of ribosomal RNA take place within nucleolar fibrillar centres or dense fibrillar components? A critical appraisal. J Struct Biol 1995; 114:1-22; PMID:7772414; https://doi.org/https://doi.org/10.1006/jsbi.1995.1001
- Melcak I, Risueno MC, Raska I. Ultrastructural non-isotopic mapping of nucleolar transcription sites in onion protoplasts. J Struct Biol 1996; 116(2):253-63; PMID:8812981; https://doi.org/https://doi.org/10.1006/jsbi.1996.0040
- Cmarko D, Verschure PJ, Rothblum LI, Hernandez-Verdun D, Amalric F, van Driel R, Fakan S. Ultrastructural analysis of nucleolar transcription in cells microinjected with 5-bromo-UTP. Histochem Cell Biol 2000; 113:181-7; PMID:10817672
- Koberna K, Malinsky J, Pliss A, Masata M, Vecerova J, Fialova M, Bednar J, Raska I. Ribosomal genes in focus: new transcripts label the dense fibrillar components and form clusters indicative of “Christmas trees” in situ. J Cell Biol 2002; 157:743-8; PMID:12034768; https://doi.org/https://doi.org/10.1083/jcb.200202007
- Casafont I, Navascues J, Pena E, Lafarga M, Berciano MT. Nuclear organization and dynamics of transcription sites in rat sensory ganglia neurons detected by incorporation of 5′-fluorouridine into nascent RNA. Neuroscience 2006; 14:453-62; PMID:16563640; https://doi.org/https://doi.org/10.1016/j.neuroscience.2006.02.030
- Shaw PJ, McKeown PC. The structure of rDNA chromatin. Nucl Protein Rev 2011; 15:43-55.
- Tollervey D, Lehtonen H, Jansen R, Kern H, Hurt EC. Temperature-sensitive mutations demonstrate roles for yeast fibrillarin in pre-rRNA processing, pre-rRNA methylation, and ribosome assembly. Cell 1993; 72:443-57; PMID:8431947
- Tollervey D, Kiss T. Function and synthesis of small nucleolar RNAs. Curr Opin Cell Biol 1997; 9:337-42; PMID:9159079
- Reichow SL, Hamma T, Ferre-D Amare AR, Varani G. The structure and function of small nucleolar ribonucleoproteins. Nucleic Acids Res 2007; 35(5):1452-64; PMID:17284456
- Smith CM, Steitz JA. Sno storm in the nucleolus: New roles for myriad small RNPs. Cell 1997; 89:669-72; PMID:9182752; https://doi.org/https://doi.org/10.1016/S0092-8674(00)80247-0
- Ochs RL, Lischwe MA, Spohn WH, Busch H. Fibrillarin: a new protein of the nucleolus identified by autoimmune sera. Biol Cell 1985; 54(2):123-33; PMID:2933102
- Dragon F, Gallagher JE, Compagnone-Post PA, Mitchell BM, Porwancher KA, Wehner KA, Wormsley S, Settlage RE, Shabanowitz J, Osheim Y, et al. A large nucleolar U3 ribonucleoprotein required for 18S ribosomal RNA biogenesis. Nature 2002; 417:967-70; PMID:12068309; https://doi.org/https://doi.org/10.1038/nature00769
- Shubina MY, Musinova YR, Sheval EV. Nucleolar methyltransferase fibrillarin: evolution of structure and functions. Biochemistry2016; 81(9):941-50; PMID:27682166; https://doi.org/https://doi.org/10.1134/S0006297916090030
- Haaf T, Hayman DL, Schmid M. Quantitative determination of rDNA transcription units in vertebrate cells. Exp Cell Res 1991; 193(1):78-86; PMID:1995304
- Haaf T, Ward DC. Inhibition of RNA polymerase II transcription causes chromatin decondensation, loss of nucleolar structure, and dispersion of chromosomal domains. Exp Cell Res 1996; 224(1):163-73; PMID:8612682; https://doi.org/https://doi.org/10.1006/excr.1996.0124
- Cheutin T, O Donohue MF, Beorchia A, Vandelair M, Kaplan H, Defever B, Ploton D, Thiry M, Three-dimensional organization of active rRNA genes within nucleolus. J Cell Sci 2002; 115(16):3297-07; PMID:12140261
- Denissov S, Lessard F, Mayer C, Stefanovsky V, van Driel M, Grummt I, Moss T, Stunnenberg HG. A model for the topology of active ribosomal RNA genes. EMBO Rep 2011; 12(3):231-7; PMID:21331097; https://doi.org/https://doi.org/10.1038/embor.2011.8
- Reeder RH, Lang WH. Terminating transcription in eukaryotes: lessons learned from RNA polymerase I. Trends Biochem Sci 1997; 22:473-7; PMID:9433127
- Derenzini M, Pasquinelli G, O Donohue MF, Ploton D, Thiry M. Structural and functional organization of ribosomal genes within the mammalian cell nucleolus. J Histochem Cytochem 2006; 54:131-145; PMID:16204224; https://doi.org/https://doi.org/10.1369/jhc.5R6780.2005
- McStay B, Grummt I. The epigenetics of rRNA genes: from molecular to chromosome biology. Annu Rev Cell Dev Biol 2008; 24:131-57; PMID:18616426; https://doi.org/https://doi.org/10.1146/annurev.cellbio.24.110707.175259
- Smirnov E, Hornacek M, Kovacik L, Mazel T, Schrofel A, Svidenska S, Skalnikova M, Bartova E, Cmarko D, Raska I. Reproduction of the FC/DFC units in nucleoli. Nucleus 2016; 7(2):203-15; PMID:26934002; https://doi.org/https://doi.org/10.1080/19491034.2016.1157674
- Haaf T, Ward DC. Inhibition of RNA polymerase II transcription causes chromatin decondensation, loss of nucleolar structure, and dispersion of chromosomal domains. Exp Cell Res 1996; 224:163-73; PMID:8612682; https://doi.org/https://doi.org/10.1006/excr.1996.0124
- Berger C, Horlebein A, Gogel E, Grummt F. Temporal order of replication of mouse ribosomal RNA genes during the cell cycle. Chromosoma 1997; 106:479-84; PMID:9426279
- Li J, Santoro R, Koberna K, Grummt I. The chromatin remodeling complex NoRC controls replication timing of rRNA genes. EMBO J 2004; 24(1):120-7; PMID:15577942; https://doi.org/https://doi.org/10.1038/sj.emboj.7600492
- Smirnov E, Borkovec J, Kovacik L, Svidenska S, Schrofel A, Skalnikova M, Svindrych Z, Krizek P, Ovesny M, Hagen GM, et al. Separation of replication and transcription domains in nucleoli. J Struct Biol 2014; 188(3):259-66; PMID:25450594; https://doi.org/https://doi.org/10.1016/j.jsb.2014.10.001
- Dundr M, Hoffmann-Rohrer U, Hu Q, Grummt I, Rothblum LI, Phair RD, Misteli T. A kinetic framework for a mammalian RNA polymerase in vivo. Science 2002; 298(5598):1623-6; PMID:12446911; https://doi.org/https://doi.org/10.1126/science.1076164
- Popov A, Smirnov E, Kovacik L, Raska O, Hagen G, Stixova L, Raska I. Duration of the first steps of the human rRNA processing. Nucleus 2013; 4(2):134-41; PMID:23412654; https://doi.org/https://doi.org/10.4161/nucl.23985
- Golding I, Paulsson J, Zawilski SM, Cox EC. Real-time kinetics of gene activity in individual bacteria. Cell 2005; 123(6):1025-36; PMID:16360033; https://doi.org/https://doi.org/10.1016/j.cell.2005.09.031
- Chubb JR, Trcek T, Shenoy SM, Singer RH. Transcriptional pulsing of a developmental gene. Curr Biol 2006; 16(10):1018-25; PMID:16713960; https://doi.org/https://doi.org/10.1016/j.cub.2006.03.092
- Raj A, Peskin CS, Tranchina D, Vargas DY, Tyagi S. Stochastic mRNA synthesis in mammalian cells. PLoS Biol 2006; 4(10):e309; PMID:17048983; https://doi.org/https://doi.org/10.1371/journal.pbio.0040309
- Suter DM, Molina N, Gatfield D, Schneider K, Schibler U, Naef F. Mammalian genes are transcribed with widely different bursting kinetics. Science 2011; 332:472-74; PMID:21415320; https://doi.org/https://doi.org/10.1126/science.1198817
- Bahar Halpern K, Tanami S, Landen S, Chapal M, Szlak L, Hutzler A, Nizhberg A, Itzkovitz S. Bursty gene expression in the intact mammalian liver. Mol Cell 2015; 58(1):147-56; PMID:25728770; https://doi.org/https://doi.org/10.1016/j.molcel.2015.01.027
- Harper CV, Featherstone K, Semprini S, Friedrichsen S, McNeilly J, Paszek P, Spiller DG, McNeilly AS, Mullins JJ, Davis JRE, et al. Dynamic organisation of prolactin gene expression in living pituitary tissue. J Cell Sci 2010; 123:424-30; PMID:20130141
- Bertrand E, Chartrand P, Schaefer M, Shenoy SM, Singer RH, Long RM. Localization of ASH1 mRNA particles in living yeast. Mol Cell 1998; 2:437-45; PMID:9809065
- Femino AM, Fay FS, Fogarty K, Singer RH. Visualization of single RNA transcripts in situ. Science 1998; 280:585-90; PMID:9554849
- Mueller F, Senecal A, Tantale K, Marie-Nelly H, Ly N, Collin O, Basyuk E, Bertrand E, Darzacq X, Zimmer C. FISH-quant: automatic counting of transcripts in 3D FISH images. Nat Methods 2013; 10:277-78; PMID:23538861; https://doi.org/https://doi.org/10.1038/nmeth.2406
- Elowitz MB, Levine AJ, Siggia ED, Swain PS. Stochastic gene expression in a single cell. Science 2002; 297:1183-186; PMID:12183631; https://doi.org/https://doi.org/10.1126/science.1070919
- Elgart V, Jia T, Fenley AT, Kulkarni R. Connecting protein and mRNA burst distributions for stochastic models of gene expression. Phys Biol 2011; 8:046001; PMID:21490380; https://doi.org/https://doi.org/10.1088/1478-3975/8/4/046001
- Gillespie DT. A general method for numerically simulating the stochastic time evolution of coupled chemical reactions. J Comput Phys 1976; 22:403-34.
- Paulsson J. Models of stochastic gene expression. Phys Life Rev 2005; 2:157-75.
- Shahrezaei V, Ollivier JF, Swain PS. Coloured extrinsic fluctuations and stochastic gene expression. Mol Syst Biol 2008; 4:196; PMID:18463620; https://doi.org/https://doi.org/10.1038/msb.2008.31
- Sherman MS, Cohen BA. A computational Framework for analyzing stochasticity in gene expression. PLoS Comput Biol 2014; 10:e1003596; PMID:24811315; https://doi.org/https://doi.org/10.1371/journal.pcbi.1003596
- Swain PS, Elowitz MB, Siggia ED. Intrinsic and extrinsic contributions to stochasticity in gene expression. Proc Natl Acad Sci USA 2002; 99(20):12795-800; PMID:12237400; https://doi.org/https://doi.org/10.1073/pnas.162041399
- Pliss A, Kuzmin AN, Kachynski AV, Baev A, Berezney R, Prasad PN. Fluctuations and synchrony of RNA synthesis in nucleoli. Integr Biol 2015; 7(6):681-92; PMID:25985251; https://doi.org/https://doi.org/10.1039/c5ib00008d
- Zenklusen D, Larson DR, Singer RH. Single-RNA counting reveals alternative modes of gene expression in yeast. Nat Struct Mol Biol 2008; 15:1263-71; PMID:19011635; https://doi.org/https://doi.org/10.1038/nsmb.1514
- Raj A, van Oudenaarden A. Nature, nurture, or chance: Stochastic gene expression and its consequences. Cell 2008; 135:216-26; PMID:18957198; https://doi.org/https://doi.org/10.1016/j.cell.2008.09.050
- Singer ZS, Yong J, Tischler J, Hackett JA, Altinok A, Surani MA, Cai L, Elowitz MB. Dynamic heterogeneity and DNA methylation in embryonic stem cells. Mol Cell 2014; 55:319-31; PMID:25038413; https://doi.org/https://doi.org/10.1016/j.molcel.2014.06.029
- Sherman MS, Lorenz K, Lanier MH, Cohen BA. Cell-to-cell variability in the propensity to transcribe explains correlated fluctuations in gene expression. Cell Systems 2015; 1:315-25; PMID:26623441; https://doi.org/https://doi.org/10.1016/j.cels.2015.10.011
- Corrigan AM, Tunnacliffe E, Cannon D, Chubb JR. A continuum model of transcriptional bursting. Elife 2016; 5:e13051; PMID:26896676; https://doi.org/https://doi.org/10.7554/eLife.13051