
Abstract
The generous mortgage tax relief enjoyed in the Netherlands and the possible existence of a house price bubble cannot explain the sharp decrease of house prices in the Netherlands in the period from 2011–2013. This sharp decline can, however, be explained by the rigorous adjustments to mortgage lending criteria after 2011. Key financial institutions in the Netherlands were more directly responsible for the deep crisis of the home-ownership market during this period. This was largely due to the specific interests of these organisations, mainly based on macro-economic considerations and the desire to enlarge the equity of the banks, which outweighed the problems on the housing market.
Introduction
The important role of housing markets for the overall global economy became painfully clear during the economic recession of 2008. When the subprime mortgage-lending business triggered a global economic crisis, most West European governments took crisis measures that affected the economy. Most interventions had to do with the restructuring of the financial system and with extra government spending to stimulate the economy. Many governments also took action to stabilise the housing markets, although the decision to do so depends strongly on whether their national housing markets suffered from the crisis (Boelhouwer, Dol, Hoekstra, & Oxley, Citation2011). Around 2010, house prices stabilised in most European countries, with some exceptions such as Spain and Ireland, and even started to rise in several countries. To explain why Spain and Ireland were hit so much harder and why the price decline lasted longer there, we should consider the speculative nature of housing production and the steep rise in prices in these countries during the period 2000–2007. As many new projects proved unsalable, they distorted the market by putting continual pressure on it. In the Netherlands, a cautious price recovery set in during 2010 lasting only a few months. From 2011 on, however, house prices and sales in the Netherlands, unlike most other West European countries, again fell (). The real house prices in this figure are corrected for inflation, and are more suitable for making comparisons over time. Since the third quarter of 2013, house prices are recovering gradually, mainly because of the steep decrease of mortgage interest rates. However, in 2017, nominal house prices were still approximately 7% below the level of 2008. Only in the bigger cities like Amsterdam and Utrecht, did houses prices in 2017 just exceed the level of 2008 in nominal terms and have yearly growth rates of above 10%.
Figure 1. Real and nominal house prices in the Netherlands, 1965–2016 (Q2).
In the Netherlands during the period 2008–2013Q2, nominal house prices dropped by 21% (in real terms more than 30%), the number of sales transactions fell from roughly 225,000 to 100,000 dwellings per year, and the number of new dwellings sold per month was only around 1000 (down from over 4000 before 2008). This paper considers several explanations for the Dutch situation, which is quite unique from a European perspective. The central research question is: Which factors could serve as an explanation for the development of Dutch house prices in the period 2010–2013?
Although the period of 2011–2013Q2 is already some years behind us, it still is an interesting example of how government interventions can influence the development of the housing market negatively. This knowledge can also be used to successfully combat future crises in the housing market. During recent years, academic and public debates have identified several key factors that are likely to have influenced the decrease in Dutch house prices. These factors form the basis of investigation in this paper. Attention is first drawn to the possible effect of the country's generous tax regime for mortgage interest tax deduction. Second, the paper explores the presence of a speculative bubble, defined as a price increase that cannot be attributed to underlying fundamentals. In this case, households speculate that prices will rise in the future and on the basis of this assumption, they are willing to spend more on their acquisition (Shiller, Citation2013). Another explanation in the same vein is that for decades the prices have risen faster in the Netherlands than in the surrounding countries, a development that eventually precipitates a price correction. Finally, attention is drawn to the effects of several measures to restrict credit, which various Dutch financial institutions have introduced in the country's mortgage market since 2011.
Mortgage interest deductibility and house price developments
Many scholars have observed that the Dutch government applies a generous taxation regime to home ownership (Haffner, Citation2002; Wolswijk, Citation2010). There is no limit on the amount that can be deducted, and the deduction can be taken from the top of the income, which implies a tax subsidy of 50% in 2016 (the average deduction is 40%) for those in the highest tax bracket. This policy has not change substantially over recent decades. So, a home owner who earns yearly more than 66,000 euros and on a monthly basis has to pay 900 euros (700 euros for interest and 200 euros for amortisation) has a net expenditure of approximately 650 euros. Depending on the value of his house, he also pays a certain amount of money for the imputed rent tax, which is included in this calculation.
We shall now consider whether this fiscal policy could explain the steep drop in prices since 2010. provides an overview of the development of house prices in a number of West European countries. The beginning of 2008, the year the crisis started, is indexed at 100. As clearly depicted for the period 1995–2010, prices in the Netherlands were running fairly close to those elsewhere, with the exception of Germany, where nominal prices declined by about 10% until 2008. If the different fiscal treatment of home owners in the Netherlands would have influenced house prices, they would also have had an impact in the period before 2010 too. As can be learned from , this is however not the case. It is striking that between 2008 and 2010, as noted in the introduction, house prices declined slightly (modest decreases of between 2% and 3% per year) in all selected countries except Germany. In the first half of 2010, prices started to recover in most countries, including the Netherlands, however the recovery in the latter did not persist but slid into reverse, with declines in 2011 and 2012 (dropping 21% over the period 2008–2013 Q3). The contrast with Belgium was substantial; house prices there increased by nearly 18% between 2008 and 2016 (meanwhile, in absolute terms, the price differential with the Netherlands climbed to almost 36%). In the period 1945–2008, the development of house prices in Belgium and the Netherlands was quite comparable. Besides the Netherlands, Spain also deviated from the European trend after 2010. House prices have plummeted there due to the above-mentioned speculative developments.
Figure 2. Nominal house prices in Europe, 1995–2012.
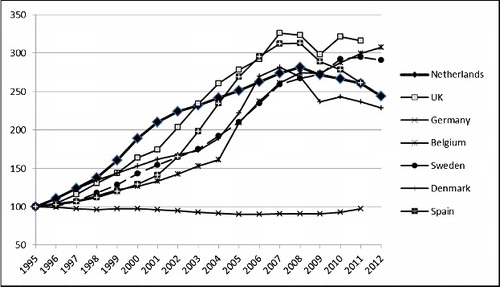
On the basis of this comparison, we may conclude that the house prices trends in the Netherlands did not deviate significantly from the trends across the rest of Europe until 2010. Thus, neither the divergent fiscal treatment nor the price levels over the past decades can explain the fact that, since 2010, the development of house prices in the Netherlands has been considerably more negative than in a number of other European countries.
A speculative bubble in the Dutch owner-occupancy market
Another explanation for the negative trend in Dutch house prices since 2010 is frequently offered: the deflation of a speculative bubble in which prices do not reflect fundamental values. In house price literature, this distinction between speculation and fundamentals is often made (see for instance Shiller, Citation2013). Speculation arises when households think that house prices will further increase and are because of that willing to buy houses and pay more than the actual prices. When speculation is there, house price models can no longer only be explained by fundamentals. This distinction between an explanation on the basis of underlying fundamentals (like income, wages, interest rates, and demographic developments) on the one hand and the presence of a speculative bubble on the other is highly relevant to policy. In fact, the deflation of a speculative bubble may be seen as a painful but necessary correction of the market. However, a drop in prices that can be explained by the fundamentals is, because of government interventions, not always inevitable either. Sometimes, fundamentals can be adjusted, for instance, through monetary policy, which could involve setting standards for mortgage lending or providing subsidies tied to interest rates or wages. As noted earlier, Spain and Ireland are prime examples of countries with housing-market bubbles, where speculative housing sales took place prior to the credit crisis and the main reason to buy a house was to take advantage of the anticipated price increase. In both countries, construction projects were started before even a single unit had been sold. It was not unusual for a household to purchase multiple dwellings and then flip them upon completion, selling off a number of units at a profit. In that situation, if an economy falls into recession, a backlog of unsold dwellings builds up, precipitating a steep drop in house prices. However, this situation did not occur in the Netherlands. Here, also before 2008, new house-building projects were only started once at least 70% of the dwellings had been sold. Moreover, the price development in the Netherlands is explained quite well by the underlying fundamentals. We will now have a closer look at the two key fundamentals of household income and mortgage interest rates.
clearly depicts the relation between the development of house prices and borrowing capacity (which could be described as an important set of fundamental variables) for the period 1982–2015. That capacity was calculated for three income groups using data from 10 periodic housing-need surveys, mortgage interest rates, the lending standards applied by the municipal mortgage guarantee and later, the National Mortgage Guarantee (NHG) for low- and middle-income households, and those of the Rabobank (the biggest Dutch mortgage provider) for higher-income households. The group 25% stands for households in the lowest quartile (the 25% with the lowest incomes, whereby the graph indicates the borrowing capacity of the highest income in that group) and 75% for households in the highest quartile (the 25% with the highest incomes, taking the lowest income occurring in that group). The graph shows that the development of borrowing capacity explains the change in house prices quite well, although at times with a slight delay. These results are confirmed by Francke and Van De Minne (Citation2013).
Figure 3. Maximum borrowing capacity and house prices, 1982–2015.
Among the explanatory factors for the price increases in the period 2005–2013 (Q2), one in particular is highly convincing for many European countries, namely the development of mortgage interest rates (). These declined gradually from 10% in 1990 to just over 4% in 2013. Given that the Dutch owner-occupancy market may be characterised as the archetype of a stock market, any reduction in the costs of financing would be almost completely absorbed by a rising selling price. In the same vein, the elasticity of the supply in the Netherlands is one of the lowest in the world (Sanchez & Johansson, Citation2011).
Figure 4. House prices and mortgage interest 1965–2016Q2.
The question remains, of course, as to how the house price development in the Netherlands in the period 2011–2013 can be explained given the fact that neither fundamentals, nor speculation, nor generous taxation can explain the differences with the price developments in the rest of Europe. In the following section, we argue that this divergence can be explained largely by the rationing of the mortgage provision and the choices made by a number of financial institutions: e.g. the Netherlands Authority for the Financial Markets (AMF, an independent supervisor of conduct on the savings, investments, loans, pensions and insurance markets), the Dutch Central Bank, the Ministry of Finance and the major banks. The first three institutions jointly constitute the Netherlands Financial Stability Committee (instated in 2012); their representatives discuss the stability of the Dutch financial system and advise the government. In its first meeting on 17 December 2012, the committee emphasised that, to protect the banking sector and the consumers of its services, it is of utmost importance to address the vulnerabilities of Dutch mortgage lending practices. Let us now turn to what are in my view these presumed vulnerabilities. The next section will shed light on the harm done to the housing market by taking such supposedly corrective action in a period of recession.
Financial institutions put the brakes on mortgage lending
Mortgage lending has undergone some rigorous adjustment in the Netherlands since 2011. One of the main changes is the introduction of the Code of Conduct for Mortgage Loans (GHF); another is the imposition of stricter criteria for maximum housing costs. Both result in borrowing limits for households. These limits are calculated by the National Institute for Family Finance Information (NIBUD), an organisation that sets normative household budgets. The restrictions are included in the rules for obtaining mortgage insurance (the NHG). The introduction of the GHF in August 2011 ushered in a range of austerity measures in mortgage lending practices. For instance, the tightened norms in the housing-cost tables constructed by the NIBUD are now applied not only by the NHG when reviewing applications but also by all mortgage lenders. Further, the maximum loan-to-value ratio has declined from 112% to 106% (and will be yearly decreased to 100% in 2018), and restrictions have been imposed on the co-financing of expenditures for upkeep and renovation. In addition, it is now far more difficult for banks to provide tailor-made solutions, which they had commonly done by means of ‘explain mortgages’ (loans that deviate from the official terms that ignore an applicant's income perspectives, based on their career opportunities and education). The implication is that, in practice, the future earning capacity of the households is barely taken into account (the volume of explain mortgages plunged from roughly 25%–30% to less than 5% after 2012). Finally, for households without someone in permanent employment and for independent contractors, it is, as in other European countries, harder to get a mortgage – a striking turn of events, given that relatively few contractors are offered permanent labour contracts.
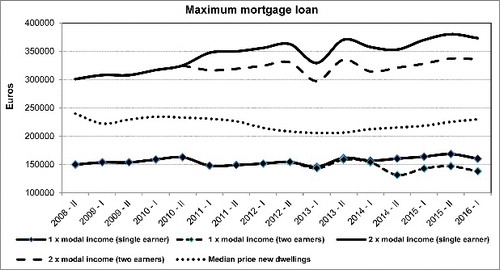
The NIBUD has also revised its budget norms for housing costs downward since 2011 in response to the drop in purchasing power. In part, the adjustment was due to the method of calculation whereby for every Euro less in disposable income, 50 cents is deducted from the housing budget. Thus, a decrease in income has a disproportionately strong effect on the maximum allowable housing costs. This is because in reality, home buyers in the Netherlands spend between 20% and 35% of their income on their mortgage, much lesser than the 50% in the NIBUD calculations. The Ministry of Finance, watching from the sidelines, ensures that the rules are actually carried out strictly and that proposals by the NIBUD to allow some leeway are rejected. For example, at the end of 2011, the NIBUD proposed a slight increase in the borrowing capacity of dual-income households, but this idea found no favour with the Ministry, who rejected the proposal. As a consequence of the new rules, the amount that could be borrowed by dual-income households notably declined in 2013 and 2014 (). Hence, despite the fact that house prices in the existing stock had declined, many of these dual-income earners had less choice on the owner-occupancy market. This is a common development in many countries (Haffner, Ong, Smith, & Wood, Citation2017).
Figure 5. Borrowing capacity for 1x and 2x average Dutch household incomes (one and two earning incomes), on half year figures, 2008–2016.
In view of the above description, one wonders why financial institutions such as the Dutch Central Bank (a proponent of further reducing the loan to value [LTV]), the authority financial markets (AFM) (the initiator of the restrictive GHF), and the Ministry of Finance (the force behind stricter NIBUD norms) intervened so rigorously in the Dutch mortgage market. There are three reasons, all related to the total mortgage debt: size, risk, and funding.
The size of the debt is perhaps the most important one. Comparatively large from an international perspective, the Dutch national mortgage debt has more than doubled since 1999, from 298 billion to 665 billion euros in 2012. This makes the Netherlands the front-runner in Europe. The total size of the Dutch mortgage debt as a percentage of gross domestic product (GDP) is half again as large as Great Britain's and twice as big as Germany's. The exceptional international position occupied by the Netherlands has not escaped the notice of international financial institutions such as the IMF, the OESO, and the credit-rating agencies. They see the Dutch mortgage debt as a financial risk and recommend reducing it. The Ministry of Finance in particular is afraid that the high debt level would prompt the rating agencies to lower the country's credit rating. The consequence would be that it would cost the Netherlands somewhat more to finance its sovereign debt. An initial lowering of the credit rating by one class would lead to an estimated increase in annual financing costs of between four and five billion euros. This amount, incidentally, pales in light of the more than 300 billion euros that households lost because of the declining value of their dwellings in the period 2008–2013Q2. Although house prices have recovered in the Netherlands since 2013Q3, in 2017, there remained a gap of about 7% in comparison with the prices in 2008.
A second reason for the strong intervention by the financial institutions is that they believe the high national mortgage debt puts both individual households and the government (through revenues foregone because of the mortgage interest deductibility) at too much risk. Given the sharply increased outlays for the mortgage interest deduction and the fact that this regulation is open-ended, the decision to intervene is understandable with respect to government spending. With regard to the risk for individual households, though, it is remarkable in view of their record of mortgage arrears. In fact, for quite a while, the Netherlands has had the lowest level of mortgage payment arrears and the fewest repossessions/foreclosures in Europe (Hoek & Koning, Citation2012; Neuteboom, Citation2008). Furthermore, as Neuteboom (Citation2008) has demonstrated, when corrected for the national context, the Dutch are certainly no more risk-prone on the mortgage market than other Europeans. The British are the exception to this general attitude; they have a higher propensity to take risks (Neuteboom, Citation2008).
The third reason to reduce the level of mortgage indebtedness is the rule that has been imposed on banks since Basel III. They are now required to increase the amount of their own financial reserves (i.e. to recapitalise). Obviously, this is not conducive to a generous attitude to mortgage provision in the future. The problems faced by Dutch banks are compounded by the fact that, unlike many foreign banks, they are under-capitalised, even though the savings levels of Dutch households are very high from an international perspective. However, those savings are held by the pension funds and are thus unavailable to the banks as collateral for their mortgage portfolios. Nonetheless, until the credit crisis, this was not an insurmountable problem. The Dutch banks could borrow on favourable terms on the international capital market and could sell their bundled mortgages onward on the same international capital market by means of securitisations. Due to the financial crisis brought about by subprime mortgages, the latter option had almost entirely disappeared after 2008, while the interest on the equity investment needed for their recapitalisation had increased sharply. Since mid-2012, incidentally, Dutch banks have again been trading mortgages through securitisation programmes. The consequence of this specifically Dutch funding or deposit problem is that since 2008 the mortgage interest rates have been roughly 1.5% higher there than in neighbouring countries. Prior to 2008, the interest levels were virtually identical. And this relatively high level of Dutch mortgage interest rates also has a negative influence on the borrowing capacity of households. It is not entirely clear whether it was the stricter criteria or the reluctance of the banks to extend mortgages that caused the volume of mortgage originations to decline – presumably the two developments reinforce each other.
To summarise, the central argument in this paper is that the steep price decrease in the Netherlands in the period of 2010–2013Q2, can mostly be explained by the policy measurements of the central government and key financial institutions. Of course, in the Netherlands, restrictions in the supply of mortgages had been introduced before but the combination of stricter mortgage criteria implemented during an economic recession, alongside already falling demand, meant the housing market could not recover like most countries in the rest of Europe.
Conclusion and future developments
This paper has described how the behaviour of central government and various major financial organisations contributed to the crisis that enveloped the owner-occupancy housing market in the Netherlands following the financial crisis of 2008. Certain interests of these organisations, notably a fear of losing their triple-A credit status and the recommendation/requirement to increase their own capital buffers, carried more weight in their decisions than the problems on the market for owner-occupancy housing. In view of the steep decrease in value that occurred, as well as the collapse of building production, from the perspective of the housing market and the consequences for households and the overall economy, however, it is doubtful that the impact of their stance has been, and above all will be, good for the country as a whole. Unemployment increased rapidly in the construction industry (80,000 jobs were lost in the period 2008–2013); the number of bankruptcies in that sector was extremely high; and in 2013, around 1.2 million owner-occupiers had a mortgage that exceeded the value of their dwelling. The policy course set by the government that came into power in September 2012 not only continued rationing credit but also made it tougher to get a loan. More specifically, the requirement that new mortgages only can receive mortgage tax deductions if they are on an annuity basis, the tightening of the loan to income ratio, the reduction of the loan to value ratio from 106% to 100% in 2018, and the reduction of the National Guarantee Fund – from 350,000 euros in 2012 to 245,000 in 2016 are the specific factors that hit hardest first-time buyers on the housing market, who have a key role to play in the recovery of the housing market.
Yet a very different range of policy recommendations came out of a parliamentary inquiry published in the spring of 2013 that reconstructed the history of 20 years of rising house prices in the Netherlands, but also out of earlier studies by the Organisation for Economic Co-operation and Development (OECD). As André and Girouard (Citation2010, pp. 126–127) state on the basis of their OECD study;
‘easy monetary conditions and financial innovations have contributed to excessive lending (especially in the USA) and housing booms, which are at the root of the current financial and economic crisis. In some countries (like the Netherlands), tax provisions (especially mortgage interest deductibility) have also encouraged excessive borrowing. But many excesses in credit expansion would have been prevented by adequate regulation and supervision of the financial system. It is therefore crucial that regulators keep pace with financial innovation, control the level of leverage of financial institutions, avoid pro-cyclical provisioning and capital standards, and improve risk management and transparency. In the short term, the resolution of the crisis requires stopping house prices from overshooting on the downside (in particular by ensuring that mortgages remain accessible to creditworthy borrowers and containing the number of foreclosures) and restoring the normal functioning of financial markets (through the provision of State guarantees, the separation of good from bad assets, and the recapitalisation of Banks)’.
For the coming two years, it seems wise to introduce a twofold policy. In some metropolitan housing markets like Amsterdam and Utrecht, the market has been booming since 2015 and calming policy measures combined with an extension of the building programme seem most obvious. On the other hand, in many more peripheral parts of the Netherlands, house prices and demand are still under pressure and stimulating measures seem more sensible.
Disclosure statement
No potential conflict of interest was reported by the author.
References
- André, C., & Girouard, N. (2010). Housing markets, business cycles and economic policies. In P. Arestis, P. Mooslechner, & K. Wagner (Eds.), Housing market challenges in Europe and the United States (pp.15–39). London: Palgrave Macmillan.
- Boelhouwer, P.J., Dol, K., Hoekstra, J., & Oxley, M. (2011, September). Crisis measures for Western European housing markets: Safety nets for citizens or stimulation of the building sector? Paper presented at the Cambridge conference on Housing markets, Cambridge.
- Francke, M.K., & Van De Minne, A. (2013). Prijsontwikkeling starterswoningen [Price development of houses for first time buyers]. Real Estate Research Quaterly, 12(4), 33–39.
- Haffner, M. (2002). Dutch personal income tax reform: An exceptional position for owner-occupied housing. Housing Studies, 17(3), 521–534.
- Haffner, M.E.A., Ong, R., Smith, S. J., & Wood, G. (2017). The edges of home ownership, the borders of sustainability. International Journal of Housing Policy, 17(2), 169–176.
- Hoek, T., & Koning, M. (2012). Situatie op de Nederlandse hypotheekmarkt [The state of the Dutch mortgage market]. Amsterdam: EIB.
- Monitor Koopwoningen (2016). Q2. Delft: OTB Research for the Built Environment.
- Neuteboom, P. (2008). On the rationality of borrower's behaviour. Comparing risk attitudes of homeowners. DUP Science, Sustainable Urban Areas 21, Delft: IOS Press.
- Sanchez, A., & Johansson, A. (2011). The price responsiveness of housing supply in OECD countries ( OECD Economics Department Working Paper No. 837). Paris: OECD Publishing.
- Shiller, R.J. (2013). Speculative asset prices, prize lecture, nobel prize, 8-12-2013. New Haven, CT: Yale University.
- Tweede Kamer der Staten Generaal. (2013). Eindrapport, een reconstructie van 20 jaar stijgende huizenprijzen [Final report: A reconstruction of 20 years increasing house prices in the Netherlands]. Den Haag: Tweede Kamer.
- Wolswijk, G. (2010). Fiscal aspects of housing in Europe. In P. Arestis, P. Mooslechner, & K. Wagner, Housing market challenges in Europe and the United States (pp. 158–175). London: Palgrave Macmillan.