
Abstract
Since 2010 there have been large reductions in funding for local government services in England. This has led to reduced income to fund services, such as housing services, that potentially promote health. Housing services expenditure includes spending on housing advice services, homelessness relief and provision of temporary accommodation. During the same period there has been an increase in homelessness and drug related mortality. We carried out an ecological study by linking data on housing services expenditure to deaths from drug and alcohol abuse by local authority in England between 2013 and 2018, to assess whether those areas that experienced a greater decline in spending, also experienced more adverse trends in mortality rates. Our results demonstrate that spending cuts were associated with increased mortality rates due to drug misuse, however, we found no strong evidence of an association with alcohol-specific mortality. This study suggests that reduced fiscal support alongside the introduction of policies that changed how funds are distributed between areas may in part explain the recent adverse trends in drug-related mortality. Since housing expenditure decreased more in the most deprived areas of England compared to less deprived areas, such spending cuts may have contributed to the widening of health inequalities.
KEYWORDS Housing services; spending; drug; alcohol; mortality
Introduction
The 2008 financial crisis led to austerity measures being introduced in many high-income countries (Gamble, Citation2009). Such policies have been characterised by large-scale cuts across central and local government budgets in an effort to reduce public deficits, and have been associated with health and social crises in Europe (Karanikolos et al., Citation2013). Many have argued that the policies introduced, such as welfare reforms, cuts to social care services and reduced housing support, target marginal and vulnerable populations the most, and withdrawing government support has lasting and devastating consequences to the health and wellbeing of such individuals (Barr et al., Citation2016; Cooper & Whyte, Citation2017; Wickham et al., Citation2020).
Following a decade of declining health inequalities in England, inequalities have started to increase again shortly after austerity policies were introduced (Barr et al., Citation2017). The social gradient of health, as discussed extensively in the Marmot reviews (Marmot et al., Citation2010, Citation2020), has become steeper, suggesting that social and economic conditions have undermined health, particularly in more deprived areas. Reduced funding and disinvestment in public services, such as housing, can affect the social determinants of health; and as a result, their capacity to improve health has been diminished. Life expectancy in England has stalled considerably since austerity measures were introduced, and a growing number of studies have associated recent adverse trends in mortality with reduced funding for public services (Alexiou et al., Citation2021; Hiam et al., Citation2018; Loopstra et al., Citation2016; Watkins et al., Citation2017).
Austerity policies along with recent trends in macroeconomic conditions have major implications at subnational and city-region scales (Donald et al., Citation2014; Peck, Citation2012). Local government spending in England accounts for almost a quarter of all public spending. The public spending reductions due to austerity measures left Local Authorities (LAs) facing cuts in central government funding of nearly 50% between 2010–11 and 2017–18 (National Audit Office, Citation2018), raising concerns about whether municipal authorities can deliver essential public services without the appropriate fiscal support. Overall, cuts have disproportionally affected poorer areas, with spending cuts per person on services in the most deprived decile of areas averaging 31%, compared with 16% in the least deprived (Harris et al., Citation2019). Local government provides a wide range of services, including housing; social care; public health; and cultural, planning and environmental services, all of which can have an impact on health through many pathways and through the wider social determinants of health (Bambra et al., Citation2010).
In addition to the overall cuts in local government funding, the introduction of the Business Rates Retention Scheme (BRRS) in 2013 changed how funds are distributed between local governments, with potential impacts on inequalities (Sandford, Citation2016). Prior to 2013, all funds raised through business property taxation (the Business Rates) were centrally pooled and redistributed to local government according to need. More deprived LAs received a greater share according to their greater need for services. Since 2013, policy changes have allowed LAs to retain 50% of their business rates as a local share, before the rest is redistributed to LAs through the Revenue Support Grant (RSG). While the purpose of this policy is to encourage LAs to grow their local economies with the incentive of additional revenue, concerns have been raised as to whether it will disproportionately affect poorer areas, where need for services is typically greater but the ability to generate income through local taxation is limited (Gray & Barford, Citation2018).
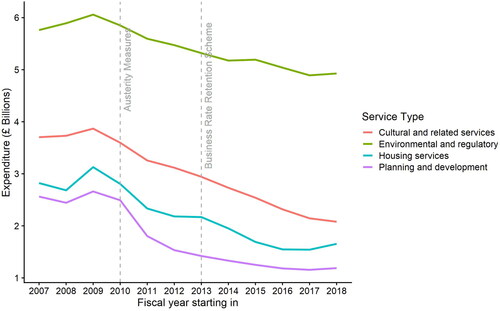
Furthermore, spending cuts have not been evenly distributed among local services. The vast majority of LAs have protected spending on statutory services, such as social care, while making cuts to more discretionary areas of spending, namely housing, cultural, environmental and planning services (Harris et al., Citation2019). Housing services have been severely affected. Based on data from the UK Ministry of Housing, Communities and Local Government, net spending on housing services and homelessness prevention has declined by over 40% in real terms between the fiscal years of 2009–2010 and 2018–2019 ().
Figure 1. Trends in total local government service expenditure in England for selected service categories. Annual values shown relate to fiscal years, i.e., form April 1st to March 31st. Values are adjusted for inflation to 2018 terms using the GDP deflator. Data Source: Ministry of Housing, Communities & Local Government.
Housing services include a variety of critical services targeted at providing homelessness prevention and relief, including provision of temporary accommodation, addressing chronic street homelessness, rent rebates and other housing benefits. Some of these services are statutory; under the Homelessness Act 2002, LAs in England are obliged to secure accommodation for homeless households under priority need, such as families with children and households with vulnerable individuals (referred to as homelessness acceptances, to which a duty is owed). Other services, however, are not legally required. For households not in the priority need groups, or those deemed to have brought homelessness on themselves (‘intentionally homeless’), the authority needs only to provide advice and assistance, such as help to find accommodation, assistance with housing benefit claims, or landlord mediation, but does not have to ensure that accommodation becomes available for them (Department for Communities & Local Government, Citation2006). Between 2005 and 2018, the largest categories for households seeking help for homelessness were single-person households without children; those aged 25 to 49 years; and males (Office for National Statistics, Citation2019).
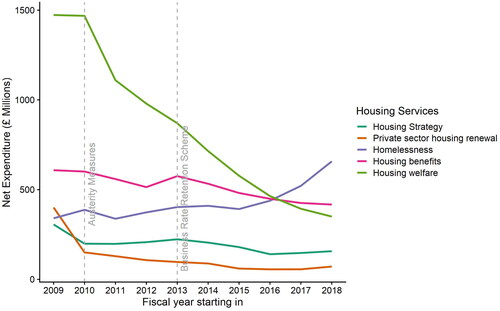
Analysis of Local Authority revenue outturn data in England published by the UK Ministry of Housing, Communities and Local Government, showed that the majority of housing spending cuts have happened within the housing welfare services, in particular the Supporting People programme (). This programme targets several vulnerable population groups, such as people with poor mental health, women at risk of domestic violence, young people leaving care, or people with drug or alcohol use problems; and offers both short- and long-term housing support. In contrast to these cuts—and perhaps unsurprisingly—spending on homelessness services, such a temporary accommodation, has seen a significant rise, particularly in more recent years. We could argue that due to budget constraints, LAs have focused less on preventative interventions which have suffered very acute cuts in recent years (Fitzpatrick et al., Citation2019). This led, perhaps inevitably, to increased demand for statutory services.
Figure 2. Annual net spending trends within local government housing services in England. Annual values shown relate to fiscal years, i.e., form April 1st to March 31st. Values are adjusted for inflation to 2018 terms using the GDP deflator. Data Source: Ministry of Housing, Communities & Local Government.
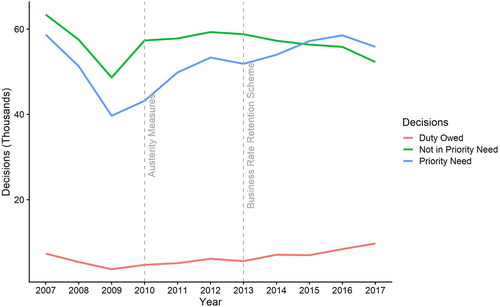
The validity of these observations is further supported by examining the available data on homelessness decisions by LAs. After nearly a decade of decline in the number of people applying for homelessness assistance, cases began to rise following the 2008 recession, driven by disinvestment in housing and welfare support (Loopstra et al., Citation2016) (). A second change in trend can be seen after 2013, where cases for households in priority need are increasing, while cases for those not in priority need have been declining. Furthermore, the amount of unmet need, i.e., the number of households that have been identified as eligible for homelessness assistance but where no accommodation has been secured by the LA at the end of the fiscal year (‘duty owed’) has been rising steadily since 2009, reflecting perhaps the financial pressure LAs are facing while trying to deliver essential housing services.
Figure 3. Trends in Local Authority decisions on homelessness in England, showing numbers accepted as being homeless and in priority need, not in priority need, or where duty owed but no accommodation is secured by the end of the fiscal year. Annual values shown relate to fiscal years, i.e., form April 1st to March 31st. Data Source: Ministry of Housing, Communities & Local Government.
Street homelessness has also been rising steadily, although reliable estimates on the number of persons in extreme homelessness (rough sleepers) are very difficult to obtain. However, the estimates available suggest that between 2013 and 2018, numbers of rough sleepers have nearly doubled, with trends being especially severe in London (Office for National Statistics, Citation2019).
It is worth mentioning that these trends reflect the situation in England, and not necessarily trends within the UK as a whole. Homelessness and housing are devolved responsibilities, and the devolution of power to non-English nations has allowed for variations in health systems and local government policy, either through legislative or reporting differences. For instance, local authorities in Scotland have wider duties to assist homeless households, and both Scotland and Northern Ireland have historically much higher rates of homelessness acceptances per head of population than England, reflecting a wider definition of ‘statutory homelessness’ adopted or the disentanglement from the ‘priority need’ criterion (Fitzpatrick et al., Citation2019). In Wales, LAs are bound by similar statutory duties as those in England, however, when looking at homelessness acceptances for single-person households in 2017–2018, they accounted for only 24% of statutory homelessness acceptances in England, compared to 50% in Wales (Office for National Statistics, Citation2019), which might be related to how strictly the priority need criterion is applied in England.
The adverse trends in homelessness in England raise questions about the potential health and well-being impacts. Homelessness and substance use often overlap; there is a robust body of evidence indicating that the harms of drug or alcohol abuse are associated with and exacerbated by unstable housing and homelessness (Cheung & Hwang, Citation2004; Galea & Vlahov, Citation2002; Song et al., Citation2000). Homeless people have higher rates of premature mortality and increased risk of drug- and alcohol-related deaths (Aldridge et al., Citation2018; Fazel et al., Citation2014; Ivers et al., Citation2019; Morrison, Citation2009).
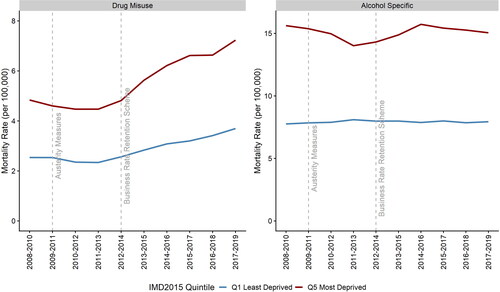
According to data published from Public Health England, deaths due to drug misuse have been increasing alarmingly fast in recent years, with the directly standardised mortality rate in England rising from 3.4 to 4.7 per 100,000 between 2012–2014 and 2017–2019, while 2019 has seen record levels (Mahase, Citation2020). Almost two out of five deaths of homeless people that year were attributed to drug poisoning (Office for National Statistics, Citation2020). Furthermore, the average rate of increase is much higher in LAs in the top 20% of income deprivation—increasing from 4.8 per 100,000 in 2012–2014 to 7.2 per 100,000 in 2017–2019 (). On the other hand, the national alcohol-related mortality trend has remained relatively stable, rising only marginally from 10.3 to 10.9 deaths per 100,000 between 2012–2014 and 2017–2019 in England (Office for National Statistics, Citation2021), although there is some variation in trends by deprivation. Alcohol-specific deaths accounted for about 10% of deaths among homeless individuals in England and Wales in 2019 (Office for National Statistics, Citation2020).
Figure 4. Average trends in drug misuse and alcohol-specific mortality rate (directly standardised values per 100,000) by top and bottom 2015 IMD income deprivation quintile in England. Data Source: Public Health England.
This study aims to assess whether municipal authorities with reduced housing services expenditure experienced more adverse trends in drug or alcohol mortality. We argue that reduced spending on such services is very likely to have increased the level and severity of homelessness, which in turn is likely to have had an impact on drug-related mortality, either because of the local government’s inability to secure the appropriate accommodation where duty was owed; or inadequate preventative, advisory and supportive services, especially for populations at risk. We also investigate the impact of cuts to alcohol-specific mortality, noting however that causal mechanisms for alcohol-related mortality are more complex (Bentley et al., Citation2021; Boyd et al., Citation2021) and possibly operate over longer time periods than we will be able to explore, and that within homeless populations in England alcohol is an important but weaker risk factor for mortality than drug misuse.
Data
We carried out our analysis using publicly available data from 152 upper tier LAs in England. We excluded the LAs of Dorset, Bournemouth and Poole, since consistent data for these LAs were not available due to boundary changes. We also excluded the LA of Kensington and Chelsea, due to having extremely high housing expenditure for one particular year. Lastly, mortality data contain missing values for some years, due to the small number of cases within LAs and thus unreliable estimates; the exact number of observations are given along model results.
Our outcomes were deaths from drug misuse and alcohol-specific deaths by upper-tier local authority level in England, between 2012–2014 and 2017–2019. Both measures are expressed as directly standardised mortality rates (per 100,000). All measures were provided by Public Health England and are calculated over three-year intervals to account for annual fluctuations in mortality. For the construction of panel data, the middle year was used as reference.
The main exposure variable was the per capita gross current housing expenditure between 2013–14 and 2018–19 for every upper-tier Local Authority in England. Additionally, we used data regarding income from the Revenue Support Grant, the Business Rates, and the total income from sales, fees and charges, for every Local Authority in England during the same period. Values correspond to fiscal years (April 1st to March 31st) and for our model, annual data are referred to by the first calendar year. Data on funding and expenditure streams were obtained from the Revenue Outturn Summary tables, published annually by the UK Ministry of Housing, Communities and Local Government. All values were adjusted for inflation to 2018 prices using the gross domestic product deflator (Stoye, Citation2017). Per capita values were obtained for each LA using the UK Office for National Statistics (ONS) mid-year population estimates.
Confounders include the trend in unemployment rate, denoted as a percentage of the economically active population (aged 16 and over), and the average annual Gross Disposable Household Income (GDHI) estimates for each LA, supplied by ONS. In additional analyses we used the 2015 Index of Multiple Deprivation (IMD) (Ministry of Housing, Communities & Local Government, Citation2015) to allocate LAs to five equal groups based on their average income deprivation score.
Methods
This study aims to investigate the potential impact of cuts to local government housing service expenditure on drug- and alcohol-related mortality in England, between 2013–2014 and 2018–2019. Furthermore, we investigate whether any impacts were greater in more disadvantaged areas, increasing health inequalities. For this purpose, we carried out a longitudinal ecological study to assess the association between LA housing service expenditure and drug and alcohol related mortality trends in England using a fixed effects approach (Rabe-Hesketh & Skrondal, Citation2008). In this analysis, we investigate whether trends in spending between geographical areas (local authorities) are associated with mortality trends during the study period, allowing for possible confounding effects at area level. We used area fixed effects to remove unobserved confounders that vary between LAs that are constant over time, and time fixed effects to account for time-varying unobserved confounders that have an effect across the country as a whole. To account for potentially confounding changes in macroeconomic determinants of mortality at the LA level (Barr et al., Citation2012), we adjusted our models for time-varying local trends in unemployment rate and household income.
However, an important methodological issue is the potential presence of endogeneity in our models. Studies of the relationship between health outcomes and public expenditure often struggle with reverse causality (Crawford et al., Citation2018; Martin et al., Citation2020). In this case, the LA housing services expenditure in a given year will largely be determined by the level of need for those services in the population (e.g., the number of households in need of housing support).
We address the endogeneity bias using two-stage least squares linear regression, utilising the change in LA revenue for general expenditure as an instrumental variable; by general revenue we describe here the revenue LAs have available that can be used to finance any service. Local authorities in England raise revenue mainly from a combination of domestic (Council Tax) and non-domestic (Business Rates) taxes, central government grants (Revenue Support Grant and other special and specific grants), and sales, fees and charges (SFCs) that they receive for delivering services. A large part of LA revenue comes from special and specific grants; these include targeted or ‘ringfenced’ grants for specific purposes, such as schools, road maintenance, public health, etc., and are allocated according to individual LA needs. We exclude these grants from our analysis, as it is unlikely that this funding stream can be used to increase spending on housing services. Council tax on the other hand makes up a large part of LAs’ revenue and has the potential to be used on any service, however, in 2012 a cap (4%) was introduced, restricting the amount that local taxes can be raised each year (Sandford, Citation2019). Per capita changes in council tax revenue will be largely linked to changes in housing stock, and based on our preliminary analyses, there is little differentiation from year to year during the study period.
In this context, we define revenue for general expenditure (RGE) as the combination of the Revenue Support Grant, a grant provided by central government to finance any service, the Business Rates revenue (non-domestic taxes) and any income from SFCs. We expect this measure to be a candidate instrument as it meets the relevance and exclusion restriction conditions of an instrumental variable approach (Hernán & Robins, Citation2006), namely i) RGE has a direct effect on service expenditure, ii) RGE will not influence health outcomes directly but only do so through service expenditure, and iii) there are no common causes of both RGE and drug and alcohol mortality ().
Figure 5. Logic model showing the associations between exposure, outcome and the instrumental variable.
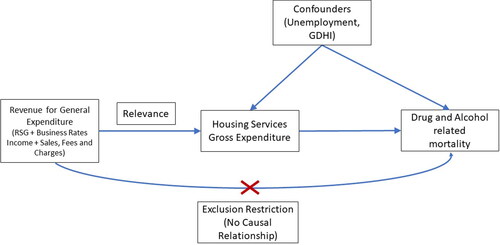
While condition i) is empirically verifiable (see ), conditions ii) and iii) are untestable assumptions; however, we expect both of these conditions to be reasonably met if we limit our analysis to after 2013. Funding baselines for local authorities in England are based on an assessment of their relative needs and resources. However, the assessment has not been updated since the introduction of the BRRS in 2013 (Alexiou et al., Citation2021). This means that while councils which have grown their business rates have benefited from the additional income generated, it also means that local underlying assessment of levels of need have not been updated since.
Figure 6. Association between per person change revenue for general expenditure and change in housing services gross expenditure by local authority in England between 2013–2014 and 2018–2019. The solid red line represents the linear fit to the data and the shaded area represents 95% CIs. Data Source: Ministry of Housing, Communities & Local Government.
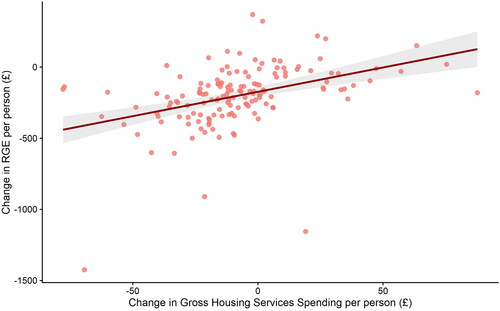
In this context, we assume that those LAs that benefited from increased income due to business rates growth also increased housing services spending, while other areas reduced spending to account for the loss of income. The RGE measure is likely to result in significant differentiation in service expenditure, representing almost half (£58 billion in 2013) of the total local government gross service expenditure. shows the relationship between per capita change in RGE and housing services spending by local authority between 2013–2014 and 2018–2019. There is a significant positive correlation between increased revenue and housing spent (r = 0.41, p < 0.0001). It is important to note that RGE can also influence spending on other services such as Public Health services; these can potentially also influence health outcomes in the short term and introduce bias to our model by violating the exclusion restriction condition. Public Health services include a variety of services for substance misuse (i.e., ‘Substance misuse: drug misuse—adults’; ‘Substance misuse: alcohol misuse—adults’; and ‘Substance misuse: drugs and alcohol—youth services’). However, possibly due to the ring-fenced spending nature of these services, change in spending for Public Health services has little to no association with change in RGE (r = 0.04, p = 0.59).
To check the consistency of our instrumental variable approach we also tested for potential weaknesses in our instrument with an F-test of the first stage regression; and a Wu-Hausman test for endogeneity. Finally, we calculated a set of alternative models, in order to assess the robustness of our findings. We estimated a model allowing for differing annual trends by deprivation quintile, as the recent trends in mortality could be related to other factors that have disproportionately affected deprived areas. Furthermore, we estimated a model including differing annual trends by region to account for potential differential regional trends in access to healthcare. In all models we used robust clustered standard errors to reflect the fact that populations were not sampled independently and to ensure that standard errors were robust to serial correlation in the data. We used the R 4.0.2 programming language and library ‘AER’ for the statistical analysis.
Results
Our analysis using a two-stage least squares linear regression model showed a negative association between change in local government housing expenditure and change in mortality rates due to drug misuse. However, housing services expenditure was not significantly associated with alcohol-specific mortality rates.
and summarise the results from our regression models. Based on the analysis of annual housing expenditure data and mortality rates between 2013 to 2018, a £10 per person decrease in LA housing services spending was associated with an increase in mortality rate due to drug misuse of 0.37 deaths per 100,000 people (95% CI: 0.16 to 0.58). Results did not markedly change when assessing effects lagged by 1 year (i.e., the association between spending in 2013–2014 to 2017–2018 and mortality rates in 2014–2016 to 2017–2019). Model results showed a significant negative association where a £10 decrease in spending was associated with an increase in mortality rate of 0.24 deaths per 100,000 (95% CI: 0.06 to 0.42).
Table 1. Model results showing the association between drug misuse and alcohol-specific mortality rate (deaths per 100,000) and a £10 per person decrease in Housing Services Gross Expenditure.
Table 2. Detailed regression results for the models regarding drug misuse and alcohol-specific mortality as noted.
For alcohol-specific mortality, there was no strong evidence of an association between spend and alcohol mortality rate. Although the point estimate indicated a negative association of 0.17, the 95% CI did not exclude zero (95% CI: –0.04 to 0.39). Similar observations can be made from our model looking at the lagged effects of housing spending to alcohol-specific mortality.
As reductions in local government housing services spending were greater in more deprived areas, the estimated impact is greater in those areas. Over the 6-year period, the most deprived 20% of areas experienced an average decrease in housing expenditure of £15 per capita, compared to just £1 within the 20% least deprived areas. This has important implications for health inequalities; it is likely that changes in funding allocations through central government funding from RSG and Business Rates streams, as well as reduced income from SFCs within those more deprived areas increased the gap of health inequalities between areas in England. Income generated from SFCs also follows deprivation patterns, as more deprived local authorities have less ability to generate income from services provided, reflecting differing abilities and willingness to pay for some services among the local population (Harris et al., Citation2019).
We carried out several tests to assess the robustness of our findings, including tests for variable collinearity, and heteroscedasticity of residuals. We tested our instrumental variable performance using an F-test of the first stage regression for drug mortality (F-statistic = 48.5, p < 0.0001) and a Wu-Hausman test for endogeneity (F-statistic = 23.5, p < 0.0001) and alcohol mortality (F-statistic = 53.4, p < 0.0001 and F-statistic = 1.7, p = 0.18, respectively). We also estimated our models allowing for differing annual trends by deprivation quintile or region to account for other policies introduced or rolled out during this period associated with deprivation, or potential differential regional trends in access to health care respectively. These alternative model specifications did not markedly change strength or the direction of the association, suggesting that results were not sensitive to our model specification.
Discussion
In this novel instrumental variable analysis using longitudinal area-level data in England, we assessed the causal impact of cuts to local government housing services spending on mortality from drug and alcohol abuse. Our findings indicate that recent reductions in funding for local government housing services were associated with increased deaths from drug misuse. As spending cuts in the most deprived LAs were greater than in other LAs, reduced investment in housing services may have contributed to widening health inequalities. In contrast, we found little evidence of an association between spending on housing services and alcohol-related mortality. This may be explained by causal mechanisms for alcohol-related deaths being more complex (Boyd et al., Citation2021). We would also expect any impacts of cuts to housing support to accrue over longer time periods than we were able to measure in our data (e.g., by contributing to risk of chronic liver disease, cancer, etc.) (Rehm et al., Citation2009), and that associated risks may be influenced by a wide range of factors (Collins, Citation2016) that we were not able to control. There are also limitations attributed to the measure used, as the alcohol-specific definition may underestimate the true extent of alcohol-attributable mortality (Office for National Statistics, Citation2021).
The analysis presented here benefits from several strengths that enhance its validity, enabling us to draw some insights for policy. We assessed the natural policy experiment of changing funding for local areas in England, applying a novel methodological approach to high quality longitudinal local area data. Our analysis using fixed-effects panel regression techniques is more robust than a simple cross-sectional analysis, as we were able to control for potentially unobserved time-invariant confounders between LAs, as well as time-varying local economic trends. By extending this method with an instrumental variable approach, we further overcome challenges to causal inference, and address endogeneity concerns arising from the link between service spending and need for services.
Some significant limitations remain, however. There are weaknesses inherent to ecological studies, such as the use of aggregated data and the risks of ecological fallacy. We also cannot rule out the possibility that the associations observed were due to exogenous factors which we were not able to control. Other policies introduced or rolled out during this period, such as welfare reforms (Barr et al., Citation2016; Wickham et al., Citation2020), may have affected mortality. However, we would expect the impact of such policies to broadly follow deprivation patterns but results did not change markedly when controlling for differential annual trends by deprivation.
Furthermore, we were not able to analyse associations before 2013. This prevented us from investigating whether changes in health outcomes began before 2013, driven by earlier spending cuts, given that the UK Government’s austerity programme started in 2010. However, at the onset of austerity measures in 2010, LAs did try to mitigate impacts by making savings through efficiencies rather than by reducing services, namely through service transformation, excess staffing costs, and redundancy payments (National Audit Office, Citation2014). In this context cuts in spending were unlikely to have manifested in significant reductions in the level of services provided until after 2013.
Another limiting factor is the use of LA mortality measures calculated over three years. These normalised values are warranted, however, as estimates are for small areas with a relatively small number of annual cases. Single-year estimates are thus likely to be unreliable and are not officially provided. Results accounting for drug-related mortality were also significant when considering lagged effects by 1 year, however, we were not able to investigate effects over greater time lags. Expanding the dataset when additional years of data become available would allow more reliable explorations of lagged associations.
Our analysis corroborates previous research that shows investment in local public services improves health and well-being, while disinvestment has the opposite effect (Alexiou et al., Citation2021; Bennett et al., Citation2020; Crawford et al., Citation2018; Martin et al., Citation2020; Mason et al., Citation2021). Increases in deaths related to drug and alcohol misuse have also been observed in the USA, where they have occurred at a much larger scale (Case & Deaton, Citation2015). Although the generalisation of this study to international contexts is made difficult by underlying differences in health systems and local service delivery, it is nonetheless plausible that austerity-related cuts to local services at across Europe and North America may have contributed to drug-related mortality in other high-income settings as our study suggests they have in the UK, particularly for nation states that have an under-funded public housing stock.
This study has potential implications for policy. As a response to the current adverse trends in homelessness, the UK government introduced the Homelessness Reduction Act in 2018Footnote1, which provided some relief to those in need, mainly by extending the statutory obligations of LAs in England to provide support, and by extending the definition of those considered threatened with homelessness to encompass more people (Fitzpatrick et al., Citation2019). Despite these efforts, the severe spending cuts in local government budgets remain largely unaddressed. The situation is further complicated by the macroeconomic prospects of public expenditure in the UK post-Brexit (Stephens, Citation2019). It is likely that extending the statutory obligations of local government without increasing the level of fiscal support will result in further displacement of funds from discretionary service activities (e.g., cultural or planning services, preventative public services across all domains) to statutory services. Many of these non-statutory services have a preventive effect, or impact health outcomes through the wider determinants of health.
Another implication is the impact of funding cuts on inequalities. Our analysis suggests that cuts in service spending were larger in more deprived areas, despite demand for services likely being higher there during the years following the introduction of austerity measures. The implementation and expansion of the BRRS (Smith et al., Citation2018) would encourage local areas to compete for limited resources, potentially inducing a ‘race to the bottom’ between local governments (Gray & Barford, Citation2018). These inequalities could be exacerbated by the amount of SFCs council can raise. SFCs’ contribution to a LA’s budget ranges from 5% to 50% (Harris et al., Citation2019); more deprived councils tend to raise less from SFCs as a share of their total revenues, reflecting the population’s ability to pay for services as well as political decisions.
In the wake of the COVID-19 pandemic, municipal authorities are expected to see reduced income from business taxation and service provision due to lockdown measures. This will be more pronounced in more deprived areas, which have already been hit the hardest (Bambra et al., Citation2020). Other health issues associated with lockdown measures in the UK, such as poor mental health and health-harming behaviours (Gurney, Citation2020), will also likely increase the need for local services, putting further financial pressure on local councils. Strategies to reverse this disinvestment in local government and provide equitable fiscal support are urgently needed.
Disclosure statement
The authors declare no conflicting interests.
Data availability statement
Additional information
Funding
Notes
1 Note that the Homelessness Reduction Act 2017, that came into effect in April 2018, applies only to local authorities and public bodies in England, and not the whole of the UK.
- Compiled data on local service expenditure and funding in England can be found in the Place Based Longitudinal Data Resource (https://pldr.org/), maintained by the authors.
References
- Aldridge, R. W., Story, A., Hwang, S. W., Nordentoft, M., Luchenski, S. A., Hartwell, G., Tweed, E. J., Lewer, D., Katikireddi, S. V., & Hayward, A. C. (2018). Morbidity and mortality in homeless individuals, prisoners, sex workers, and individuals with substance use disorders in high-income countries: A systematic review and meta-analysis. The Lancet, 391(10117), 241–250. https://doi.org/10.1016/S0140-6736(17)31869-X
- Alexiou, A., Fahy, K., Mason, K., Bennett, D., Brown, H., Bambra, C., Taylor-Robinson, D., & Barr, B. (2021). Local government funding and stalling life expectancy in England: A longitudinal ecological study. The Lancet Public Health, 6(9), e641–e647. https://doi.org/10.1016/S2468-2667(21)00110-9
- Bambra, C., Gibson, M., Sowden, A., Wright, K., Whitehead, M., & Petticrew, M. (2010). Tackling the wider social determinants of health and health inequalities: Evidence from systematic reviews. Journal of Epidemiology and Community Health, 64(4), 284–291. https://doi.org/10.1136/jech.2008.082743
- Bambra, C., Riordan, R., Ford, J., & Matthews, F. (2020). The COVID-19 pandemic and health inequalities. Journal of Epidemiology and Community Health, 74(11), 964–968. https://doi.org/10.1136/jech-2020-214401
- Barr, B., Higgerson, J., & Whitehead, M. (2017). Investigating the impact of the English health inequalities strategy: Time trend analysis. BMJ (Clinical Research Ed.), 358, j3310. https://doi.org/10.1136/bmj.j3310
- Barr, B., Taylor-Robinson, D., Stuckler, D., Loopstra, R., Reeves, A., & Whitehead, M. (2016). ‘First, do no harm’: are disability assessments associated with adverse trends in mental health? A longitudinal ecological study. Journal of Epidemiology Community Health, 70(4), 339–345. https://doi.org/10.1136/jech-2015-206209
- Barr, B., Taylor-Robinson, D., & Whitehead, M. (2012). Impact on health inequalities of rising prosperity in England 1998-2007, and implications for performance incentives: Longitudinal ecological study. BMJ (Clinical Research Ed.), 345, e7831. https://doi.org/10.1136/bmj.e7831
- Bennett, D. L., Mason, K. E., Schlüter, D. K., Wickham, S., Lai, E. T., Alexiou, A., Barr, B., & Taylor-Robinson, D. (2020). Trends in inequalities in children looked after in England between 2004 and 2019: A local area ecological analysis. BMJ Open, 10(11), e041774. https://doi.org/10.1136/bmjopen-2020-041774
- Bentley, R., Baker, E., Martino, E., Li, Y., & Mason, K. (2021). Alcohol and tobacco consumption: What is the role of economic security? Addiction (Abingdon, England), 116(7), 1882–1891. https://doi.org/10.1111/add.15400
- Boyd, J., Sexton, O., Angus, C., Meier, P., Purshouse, R. C., & Holmes, J. (2021). Causal mechanisms proposed for the alcohol harm paradox-a systematic review. Addiction. Advance online publication. https://doi.org/10.1111/add.15567
- Case, A., & Deaton, A. (2015). Rising morbidity and mortality in midlife among white non-Hispanic Americans in the 21st century. Proceedings of the National Academy of Sciences of the United States of America, 112(49), 15078–15083. https://doi.org/10.1073/pnas.1518393112
- Cheung, A. M., & Hwang, S. W. (2004). Risk of death among homeless women: A cohort study and review of the literature. CMAJ : Canadian Medical Association Journal = Journal de L’Association Medicale Canadienne, 170(8), 1243–1247. https://doi.org/10.1503/cmaj.1031167
- Collins, S. E. (2016). Associations between socioeconomic factors and alcohol outcomes. Alcohol Research : Current Reviews, 38(1), 83–94.
- Cooper, V., & Whyte, D. (2017). The violence of austerity. Pluto Press.
- Crawford, R., Stoye, G., & Zaranko, B. (2018). The impact of cuts to social care spending on the use of Accident and Emergency departments in England. The Institute for Fiscal Studies, Working Paper W18/15. https://doi.org/10.1920/wp.ifs.2018.W1815
- Department for Communities and Local Government. (2006). Homelessness code of guidance for local authorities. Department for Communities and Local Government.
- Donald, B., Glasmeier, A., Gray, M., & Lobao, L. (2014). Austerity in the city: Economic crisis and urban service decline? Cambridge Journal of Regions, Economy and Society, 7(1), 3–15. https://doi.org/10.1093/cjres/rst040
- Fazel, S., Geddes, J. R., & Kushel, M. (2014). The health of homeless people in high-income countries: Descriptive epidemiology, health consequences, and clinical and policy recommendations. The Lancet), 384(9953), 1529–1540. https://doi.org/10.1016/S0140-6736(14)61132-6
- Fitzpatrick, S., Pawson, H., Bramley, G., Wood, J., Watts, B., Stephens, M., & Blenkinsopp, J. (2019). The homelessness monitor: England 2019 (pp. 65). Crisis.
- Fitzpatrick, S., Pawson, H., Watts, B., & Perry, J. (2019). Homelessness, housing needs and lettings. In UK Housing Review 2019 (pp. 72–80). Chartered Institute of Housing. https://www.ukhousingreview.org.uk/ukhr19/index.html.
- Gamble, A. (2009). The spectre at the feast: Capitalist crisis and the politics of recession, Palgrave Macmillan.
- Galea, S., & Vlahov, D. (2002). Social determinants and the health of drug users: Socioeconomic status, homelessness, and incarceration. Public Health Reports, 117(Suppl 1), S135–S145.
- Gray, M., & Barford, A. (2018). The depths of the cuts: The uneven geography of local government austerity. Cambridge Journal of Regions, Economy and Society, 11(3), 541–563. https://doi.org/10.1093/cjres/rsy019
- Gurney, C. (2020). Out of harm’s way?: Critical remarks on harm and the meaning of home during the 2020 COVID-19 social distancing measures. Working Paper. UK Collaborative Centre for Housing Evidence.
- Harris, T., Hodge, L., & Phillips, D. (2019). English local government funding: Trends and challenges in 2019 and beyond. The Institute for Fiscal Studies. https://doi.org/10.1920/re.ifs.2019.0166
- Hernán, M. A., & Robins, J. M. (2006). Instruments for causal inference: An epidemiologist’s dream? Epidemiology (Cambridge, MA), 17(4), 360–372.
- Hiam, L., Harrison, D., McKee, M., & Dorling, D. (2018). Why is life expectancy in England and Wales ‘stalling’? Journal of Epidemiology and Community Health, 72(5), 404–408. https://doi.org/10.1136/jech-2017-210401
- Ivers, J.-H., Zgaga, L., O’Donoghue-Hynes, B., Heary, A., Gallwey, B., & Barry, J. (2019). Five-year standardised mortality ratios in a cohort of homeless people in Dublin. BMJ Open, 9(1), e023010. https://doi.org/10.1136/bmjopen-2018-023010
- Karanikolos, M., Mladovsky, P., Cylus, J., Thomson, S., Basu, S., Stuckler, D., Mackenbach, J. P., & McKee, M. (2013). Financial crisis, austerity, and health in Europe. Lancet (London, England), 381(9874), 1323–1331. https://doi.org/10.1016/S0140-6736(13)60102-6
- Loopstra, R., McKee, M., Katikireddi, S. V., Taylor-Robinson, D., Barr, B., & Stuckler, D. (2016). Austerity and old-age mortality in England: A longitudinal cross-local area analysis, 2007-2013. Journal of the Royal Society of Medicine, 109(3), 109–116. https://doi.org/10.1177/0141076816632215
- Loopstra, R., Reeves, A., Barr, B., Taylor-Robinson, D., McKee, M., & Stuckler, D. (2016). The impact of economic downturns and budget cuts on homelessness claim rates across 323 local authorities in England, 2004-12. Journal of Public Health (Oxford, England), 38(3), 417–425. https://doi.org/10.1093/pubmed/fdv126
- Mahase, E. (2020). Drug deaths: England and Wales see highest number since records began. BMJ (Clinical Research Ed.), 371, m3988. https://doi.org/10.1136/bmj.m3988
- Marmot, M., Allen, J., Goldblatt, P., Boyce, T., McNeish, D., Grady, M., & Geddes, I. (2010). Fair society, healthy lives (the Marmot review), (pp. 242). The Institute of Health Equity.
- Marmot, M., Allen, J., Boyce, T., Goldblatt, P., & Morrison, J. (2020). Health equity in England: The Marmot review 10 years on, (pp. 172). The Institute of Health Equity.
- Martin, S., Lomas, J., & Claxton, K. (2020). Is an ounce of prevention worth a pound of cure? A cross-sectional study of the impact of English public health grant on mortality and morbidity. BMJ Open, 10(10), e036411. https://doi.org/10.1136/bmjopen-2019-036411
- Mason, K. E., Alexiou, A., Bennett, D. L., Summerbell, C., Barr, B., & Taylor-Robinson, D. (2021). Impact of cuts to local government spending on Sure Start children’s centres on childhood obesity in England: A longitudinal ecological study. Journal of Epidemiology and Community Health, 75(9), 860–866. https://doi.org/10.1136/jech-2020-216064
- Ministry of Housing, Communities & Local Government. (2015, September 30). English indices of deprivation 2015. Ministry of Housing, Communities & Local Government. https://www.gov.uk/government/statistics/english-indices-of-deprivation-2015.
- Morrison, D. S. (2009). Homelessness as an independent risk factor for mortality: Results from a retrospective cohort study. International Journal of Epidemiology, 38(3), 877–883. https://doi.org/10.1093/ije/dyp160
- National Audit Office. (2014). Financial sustainability of local authorities 2014. National Audit Office. https://www.nao.org.uk/report/financial-sustainability-of-local-authorities-2014/.
- National Audit Office. (2018). Financial sustainability of local authorities 2018 (HC 834; Issue HC 834). Ministry of Housing, Communities & Local Government. https://www.nao.org.uk/wp-content/uploads/2018/03/Financial-sustainabilty-of-local-authorites-2018.pdf.
- Office for National Statistics. (2019, September 17). UK homelessness: 2005 to 2018. https://www.ons.gov.uk/peoplepopulationandcommunity/housing/articles/ukhomelessness/2005to2018.
- Office for National Statistics. (2020, December 14). Deaths of homeless people in England and Wales: 2019 registrations. https://www.ons.gov.uk/peoplepopulationandcommunity/birthsdeathsandmarriages/deaths/bulletins/deathsofhomelesspeopleinenglandandwales/2019registrations.
- Office for National Statistics. (2021, February 2). Alcohol-specific deaths in the UK: registered in 2019. https://www.ons.gov.uk/peoplepopulationandcommunity/healthandsocialcare/causesofdeath/bulletins/alcoholrelateddeathsintheunitedkingdom/registeredin2019.
- Peck, J. (2012). Austerity urbanism. City, 16(6), 626–655. https://doi.org/10.1080/13604813.2012.734071
- Rabe-Hesketh, S., & Skrondal, A. (2008). Multilevel and longitudinal modeling using Stata (2nd ed.). Stata Press. https://www.stata.com/bookstore/mlmus2.html
- Rehm, J., Mathers, C., Popova, S., Thavorncharoensap, M., Teerawattananon, Y., & Patra, J. (2009). Global burden of disease and injury and economic cost attributable to alcohol use and alcohol-use disorders. The Lancet, 373(9682), 2223–2233. https://doi.org/10.1016/S0140-6736(09)60746-7
- Sandford, M. (2016). Public services and local government: The end of the principle of ‘funding following duties. Local Government Studies, 42(4), 637–656. https://doi.org/10.1080/03003930.2016.1171753
- Sandford, M. (2019). Council tax: Local referendums. House of commons library. Briefing paper 05682. https://researchbriefings.files.parliament.uk/documents/SN05682/SN05682.pdf
- Smith, N. A., Phillips, D., & Simpson, P. (2018). 100% business rate retention pilots: What can be learnt and at what cost? The Institute for Fiscal Studies. https://doi.org/10.1920/BN.IFS.2018.BN0233.
- Song, J. Y., Safaeian, M., Strathdee, S. A., Vlahov, D., & Celentano, D. D. (2000). The prevalence of homelessness among injection drug users with and without HIV infection. Journal of Urban Health, 77(4), 678–687. https://doi.org/10.1007/BF02344031
- Stephens, M. (2019). Economic prospects and public expenditure. In UK Housing Review 2019 (pp. 89–108). Chartered Institute of Housing. https://www.ukhousingreview.org.uk/ukhr19/index.html
- Stoye, G. (2017). UK health spending. The Institute for Fiscal Studies. https://www.ifs.org.uk/uploads/publications/bns/BN201.pdf.
- Watkins, J., Wulaningsih, W., Zhou, C. D., Marshall, D. C., Sylianteng, G. D. C., Rosa, P. G. D., Miguel, V. A., Raine, R., King, L. P., & Maruthappu, M. (2017). Effects of health and social care spending constraints on mortality in England: A time trend analysis. BMJ Open, 7(11), e017722. https://doi.org/10.1136/bmjopen-2017-017722
- Wickham, S., Bentley, L., Rose, T., Whitehead, M., Taylor-Robinson, D., & Barr, B. (2020). Effects on mental health of a UK welfare reform, Universal Credit: A longitudinal controlled study. The Lancet Public Health, 5(3), e157–e164. https://doi.org/10.1016/S2468-2667(20)30026-8