?Mathematical formulae have been encoded as MathML and are displayed in this HTML version using MathJax in order to improve their display. Uncheck the box to turn MathJax off. This feature requires Javascript. Click on a formula to zoom.
ABSTRACT
Technology upgrading is essential for emerging countries to catch up. Yet, little is known about how countries are upgrading their technologies. In this paper, we first explore the patterns of biotechnology upgrading in China and examine the specialization feature from both technological and organizational perspectives. Our results show that China has specialized in the industrial-biotech sub-field, and firms have played a key role in the development of biotech in this field. Secondly, we investigate the knowledge bases for technology upgrading. From the perspective of scientific knowledge bases, we find that there is a scientific backup for biotechnology; and that biotechnology goes hand in hand with bioscience. From the perspective of technical knowledge bases, by disaggregating the knowledge sources by countries, we find that local knowledge has become an increasingly important resource for the development of new biotechnologies in China. The increasing importance of local knowledge in the development of new biotechnologies shows that China is moving on a path from imitative to indigenous innovation.
1. Introduction
Is China catching-up with the technology leaders in biotechnology? The patenting activities of Chinese enterprises over the past 10 years seem to suggest that they are. Despite being far below the technology frontier at the turn of the twenty-first century, China is building both the competence, or stock of accumulated knowledge, and technological capabilities, or the ability to carry out specific tasks, in biotechnology (see Von Tunzelmann, Citation2009). This is especially the case in industrial biotechnology, but there are also signs of these transformations are taking place in agricultural biotechnology as well as in medical biotechnology, although they remain relatively weak (Hanel, Citation2017). The challenge for China is to upgrade its biotechnology enough to be able to reach the technology frontier (Niosi, Citation2011).
Biotechnology is defined as the application of science and technology to living organisms as well as parts, products and models thereof, to alter living or non-living materials for the production of knowledge, goods and services (OECD, Citation2009).Footnote1 Biotechnology is considered one of the most promising technologies of the twenty-first century and has shown a rapid development trend in recent years. The development and application of biotechnology have the potential for far-reaching economic, social, and environmental impacts, especially in the sector of medicine, agriculture, and industry. Specific technical and research skills in biotechnology can lead to significant changes in capabilities, competences and organizational routines (Niosi & Banik, Citation2005). Biotechnology is a proper field to study catching-up of emerging economies.
This study explores technology upgrading in China from two perspectives. First, we consider the specialization patterns of the biotech in China, from both technological and organizational perspectives. Second, we explore the knowledge bases for the generation of new technologies. As China is catching up, we find that biotech-related scientific and technological activities go together. Earlier studies emphasized the importance of scientific capability in supporting a country’s technological catching-up and upgrading (Perez & Soete, Citation1988; Zucker, Darby, & Brewer, Citation1998). The coevolution of bioscience and biotechnology suggests that China is on a sustainable path of economic growth. From a technological perspective, patent citation analysis indicates that local knowledge is playing an increasingly important role in the development of new biotechnologies in China.
We begin the paper by summarizing certain relevant issues related to catching-up and technology upgrading. The third section focuses on measuring technological innovativeness using patents as an indicator. Section four describes the development of biotechnologies in China and explores the upgrading patterns, including the specialization and diversification patterns, co-evolution of bioscience and biotechnology, and the technological sources for catching-up. A concluding section supplies some concluding comments.
2. Catching-up and technology upgrading
There are many ways to measure technology upgrading (Radosevic & Yoruk, Citation2016, Citation2018; Yoruk, Citation2013). It is most often measured as a gradual shift from lower to higher value-added activity, or what is often described as moving up the global value chain. Grossman and Helpman (Citation1991) represent technology upgrading as climbing a quality ladder whereas Morrison, Pietrobelli, and Rabellotti (Citation2008) described it as going up the value ladder. Ernst (Citation1998) associated it with a nation’s competencies and pattern of specialization. Upgrading can appear in factories, inter-firm networks, local or national economies, and regions (Gereffi, Citation1999). It can also appear as new methods of production and organization (process upgrading), new more complex products (product upgrading), new, higher value-added activities (functional upgrading), and the adaptation of competencies to a new industry (intersectoral upgrading) (Humphrey & Schmitz, Citation2002). More recently, Radosevic and Yoruk (Citation2016, Citation2018) adopt a multidimensional framework that considers technological capabilities and competencies, the institutional (governance) arrangements of society, and global knowledge (trade) flow.
Upgrading China’s technology is crucial to the catching-up process, especially as it is generally perceived as being below the technology frontier (Fu, Citation2015; Lee, Citation2013). Catching up requires the development of new knowledge within the country as well as diffusing existing knowledge from outside it (Fagerberg, Srholec, & Knell, Citation2007).Footnote2 But it also involves developing the ‘ability to identify, assimilate and exploit knowledge from the environment’ (Cohen & Levinthal, Citation1989, Citation1990). Here R&D activity is not only important for generating innovative technology, but also for recognizing external information and assimilating and applying it to commercial ends. Successful catching-up will also depend on the technological opportunities available to China, and its ability to exploit certain local learning advantages.
2.1. Technological and organizational specialization
In the catching-up process, it is crucial to build the local capability to understand, adapt and improve upon newly acquired knowledge. To carry out this task, China will need to make certain technological choices in its catching-up strategy (Fagerberg, Srholec, & Verspagen, Citation2010). Lee (Citation2013) and Lee and Lim (Citation2001) use patents statistics to analyse the technological specialization patterns of catching-up economies. Lee (Citation2013, p. 227) suggests that middle-income countries should specialize in the field ‘“that rely less on existing technologies, and that afford the greater opportunities associated with new technologies’.Footnote3 Specialization can occur in the technological domain (Von Wartburg, Teichert, & Rost, Citation2005) as well as in the organizational setting (Manning, Citation2017).
Innovations in different countries can vary across technological fields (Niosi & Bellon, Citation1996). This can be due to the cumulative national technological capabilities and technological opportunities in certain fields (Archibugi & Pianta, Citation1992; Wang, Citation2016). Franco, Ray, and Ray (Citation2011) show that, even if countries have similar industrialization processes, their local knowledge-based assets created by specialization can differ greatly. Alfred Marshall (Citation1890/1961) recognized more than a hundred years ago that the agglomeration of specialized industries was due in part to the localization of knowledge. Exploring technological opportunities related to their own comparative advantage is crucial in the success of the catching-up economies of east Asia, most notably Japan, South Korea and Singapore (Amsden, Citation2001; Chang, Citation2002). To achieve a smooth catching-up, each country ought to develop a technology upgrading pattern according to their technological capacity, local advantage and specific challenges. As explained by Lee (Citation2013), instead of competing with the advanced countries in the long-cycle technologies, latecomer countries can concentrate more on short-cycle technologies, and ‘emerging generations of technology serve as windows of opportunity for the catching-up countries that are not locked into the old technologies, and allow them to thrive in emerging industries’ (Lee, Citation2013, p. 133). Here we analyse how China can upgrade its technology by taking advantage of technological opportunities.
2.2. Science and technology linkages
Science has been regarded as an important force for technological development (Narin, Hamilton, & Olivastro, Citation1997; Sorenson & Fleming, Citation2004; Wang & Li, Citation2018) and the impact (or quality) of a patent can be significantly improved by science in various ways (Wang & Li, Citation2019). A country’s innovation capability to a great extent depends upon the basic research carried out within the country (Adams, Citation1990; Malo & Geuna, Citation2000). Innovation processes within the bioindustry is overly complex with non-linear, indirect interactions between science and technology (Rosenberg, Citation1974) and requires interdependent dynamic capabilities to innovate (Mazzucato & Dosi, Citation2006). The technology relies heavily on trial and error experimentation that can be guided by scientific explanations, but not necessarily reducible to them (Nightingale, Citation2004).
Development of biotechnology depends to a great extent on the specific set of problem-solving skills that lead to certain choices. Given the risk and uncertainty underlying these choices, especially in the first stages of biotech development, the public sector often needed to fund public research. Data from the OECD (Citation2013) reveals that the government and higher education together spend more than half of total R&D activity in biotechnology in 11 out of 18 countries, including both Germany and Korea. Motohashi and Yun (Citation2007) show that the linkages between science and industry sectors have been growing in China, based on a firm level survey. Nevertheless, due to the different nature of industrial fields and different stages of development, not all technologies necessarily depend on public science (Meyer, Citation2000; Wong & Wang, Citation2015), but evidence from patent statistics indicate that science and technology co-evolve and reinforce each other (Murray, Citation2002; Van Looy, Callaert, & Debackere, Citation2006). Although it usually takes years to turn public research into productivity (Adams, Citation1990), a strong science base can help enhance a nation’s competitiveness in the long run (Adams, Citation1990; Beise & Stahl, Citation1999). In the development of science-based biotechnology, we aim to explore whether this is a simultaneous national bioscience developed in China.
2.3. Local and international technological sources
Technology development is a learning process that can involve foreign technology transfer prior to conducting in-house R&D and innovations (Chung & Lee, Citation2015). This has taken place in China by learning how to use and improve existing technologies that already exist in the more advanced industrial economies (Kim, Citation1997; Kim & Nelson, Citation2000). Learning by doing, learning by using, learning by exporting, problem-solving activities, and formal scientific learning are all important to the upgrading process. Yet, enterprises do not deliver the benefits of learning without the use of local knowledge (Wang, Meijers, & Szirmai, Citation2017; Fu, Pietrobelli, & Soete, Citation2011). Aiming at becoming an innovation-oriented nation, Chinese government has made the strategic decision to upgrade certain key technologies and promote indigenous innovation (zizhu chuangxin) from 2006 to 2020 (Gu & Lundvall, Citation2006; Gu, Lundvall, Ju, Malerba, & Serger, Citation2009; Gu, Schwag Serger, & Lundvall Citation2016). There is no standard method for measuring indigenous innovation. Fu and Gong (Citation2011) rely on R&D indicators and found that local R&D activities are the major driver of technology upgrading in China when compared with foreign innovation activities. However, Katz (Citation1984) and Lee and Malerba (Citation2017) emphasized the importance of local technical knowledge creation and acquisition in the catching-up process. This knowledge necessarily ‘involves various degrees of specificity, tacitness, and complexity, and may differ greatly across technologies’ (Lee, Citation2013). Given that many firms innovate without conducting R&D (Arundel, Bordoy, & Kanerva, Citation2008; Boroush & Jankowski, Citation2016), we contend that it is not the physical input but the knowledge that is more relevant to present innovation capability (Wang, Jacob, & Li, Citation2019). By using patent citation analysis, we disaggregate technological knowledge from different countries and examine to what extent China has been innovating based on its own local knowledge.
3. Data and methodology
Measuring technological innovativeness is not straightforward. Though not all inventions are patented, Griliches (Citation1990, p. 1702) states that ‘patents statistics remain a unique resource for the analysis of the process of technical change’. Patents have been used in measuring technological activities, for instance, the technological competitiveness of various countries (Pavitt & Soete, Citation1980, Citation1981), capturing knowledge flows (Jaffe & Trajtenberg, Citation2002) and other innovative activities (Dosi & Castaldi, Citation2003). Acs, Anselin, and Varga (Citation2002) show that patent and innovation counts are highly correlated and suggest that patents are a reliable measure of innovation. In the field of biotechnology, patents have been believed as an indicator closely reflecting innovation output (Allansdottir et al., Citation2002; Gambardella, Orsenigo, & Pammolli, Citation2000).
In this paper, we employ biotech patents to examine different paths of technology upgrading from a dynamic perspective. We make a comparison between technology frontier leaders, including the United States, Japan, Western Europe and emerging or late-comers, including China, South Korea, India and some central European countries. Here we investigate the process of technology upgrading and how emerging economies find the right technology path and knowledge sources.
The analysis considers patents from Derwent World Patent Index (DWPI), which contains patent applications and grants from the world’s patent-issuing authorities. To maintain statistical quality, we have extracted granted patents from eight patent-issuing authorities. These include the United States Patent and Trademark Office (USPTO), the Japan Patent Office (JPO), the Korean Intellectual Property Office (KIPO), The European Patent Office (EPO), the German Patent and Trade Mark Office (DPMA), the UK Intellectual Property Office's (UKIPO), French Patent Office (Institut National de la Propriété Industrielle, FPO) and State Intellectual Property Office of the P.R.C (SIPO). The time span covers a period between 2001 and 2015. Patents were searched in IncoPat 4.0 Platform (Beijing IncoPat 2017), using relative IPC (International Patent Classification) codes which refers to OECD definition of biotechnology patents (OECD, Citation2009),Footnote4 with further conceptual partition. The IPC codes for each sub-field are listed in in the Appendix. Applicant addresses are used to judge the origin of countries. All records were searched and refreshed within June 2017 and September 2017. We use patent families to remove the duplicates.
Publication records were collected from Web of Science Core Collection (Clarivate Analytics 2017) and the keywords used in searching biotech-related papers were mainly drawn from CAS-TWAS (Citation2016, pp. 218–224).Footnote5 Highly cited papers (top 1%), between 2007 and 2015, were extracted to represent the high-quality publications.
This study covers 21 countries, including six leading countries (US, Japan, South Korea, Germany, France, and UK), China and eastern European countries (Czech Republic, Poland, Hungary, Slovakia, Slovenia, Estonia, Latvia, Lithuania, Romania and Bulgaria). We classify the field of biotech into three typical biotechnology branches: (1) agricultural biotechnology, including breeding, cultivations, transgenesis biotechnology; (2) industrial biotechnology, including material, food, energy, environmental biotechnology and bioengineering technology; (3) medical biotechnology, including pharmaceutical, clinical, diagnostic and therapeutic biotechnology.
4. The development biotechnologies in China
In 2006, the Chinese State Council issued ‘Medium- and Long- Term Programme for Science and Technology Development (2006–2020)’ aimed at promoting innovation.Footnote6 This 15-year-plan provided a national strategy on promoting a new concept of national innovation system and spurring indigenous innovation (Gu et al., Citation2009). Biology is listed as a prioritized field promoted and (financially) supported by the Chinese government. In July 2007, the National Development and Reform Commission of China issued ‘The 11th Five-Year Plan for bio-industry development’,Footnote7 which proposes to accelerate the development of China’s new technologies in the fields of bio-medicine, bio-agriculture, bio-energy, bio-manufacturing, bio-environmental protection.Footnote8 Five years later, Ministry of Science and Technology of China issued ‘The 12th Five-Year Plan for bio-industry development’.Footnote9 Guided by the ‘11th Five-Year’ and ‘12th Five-Year’ plans, and supported by the increased science and technology expenditures from various sources, China has made steady progress in basic research, applied research, technological transformation and industrial development in the field of biotechnology.
4.1. Is China catching-up or lagging behind?
Rapid technical change and technological learning in biotechnology has been taking place in the advanced as well as in many of the emerging market economies (Powell, Koput, & Smith-Doerr, Citation1996). illustrates the development of biotechnology in selected countries and region. The US appears as the technological leader, with Japan in second place in terms of the number of biotechnology patents granted. China experienced exponential growth over the decade, surpassing Japan in 2012. Actual numbers may lag 2 or 3 years between the patent granted year and the publication year in database. The incompleteness of the patent database may have caused the decline in Korea for example.
Figure 1. Development of biotechnology (granted patents) in selected countries (regions).
Note: Patents are from eight patent issuing authorities (USPTO, JPO, KIPO, EPO, DPMA, UKIPO, FPO and SIPO).
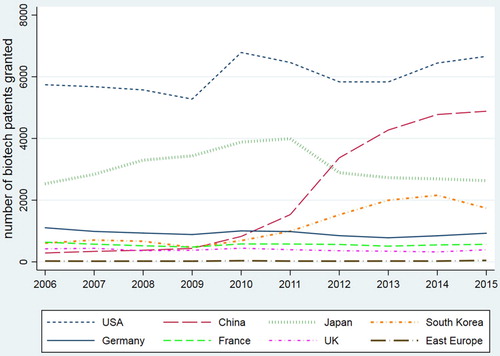
The numbers of biotech patents from Germany, France, UK, and East Europe appear rather flat and low. This result is in line with Allansdottir et al. (Citation2002), who state that Europe lags significantly behind the US in biotechnology-related innovation activities.
Firms from different countries have a different preference in choosing the patent office to file their patents because of market protection and other practical filing reasons. For instance, Chinese inventors file most of their patents in SIPO. The well-known telecommunications giant, Huawei, filed about 97.5% of their patents in SIPO and merely 2.5% in USPTO during the period 1985–2006 (Eberhardt, Helmers, & Yu, Citation2011). So, it is inappropriate to assess the innovation activities of emerging economies relying on the data only from major patent authorities such as USPTO, EPO or JPO. Given that the quality of patents granted by different authorities may differ, we do not recommend making a simple comparison of patent numbers from different countries at one single year. Here, we focus on the dynamic aspect of invention performance in different countries and explore changes and progresses over the past decade.
illustrates the leading position of the US and Japan in developing biotechnologies in the 10-year period from 2006 to 2015. The number of biotech patents granted in the US increased slightly over these years, while in Japan peaked around 2011 then decreased sharply. China’s biotechnology had a low profile at the end of 2000s, but the number of biotech inventions increased dramatically after 2011. The data in 2015, however, are incomplete as there is a 3-year average time lag in patenting systems (Tijssen, Citation2001).Footnote10 So the relatively low growth rate from 2014 to 2015 does not necessarily mean a saturation stage.
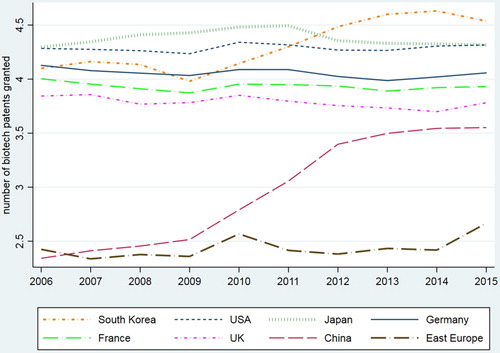
provides the comparison of growth prospects in the studied countries. Worldwide total grew at 5% per year in terms of number of granted biotech patents. Technologically leading countries such as USA, Japan, Germany, France, and UK showed a low (or even negative) growth. Still, biotechnologies in China and Poland have grown at a speed of over 30% per year. The last column in shows that the growth rate of patent intensity is like that of total patents. Countries with lower number of patents (lower than 10) could be subject to variation (i.e. a few patents can lead to substantial change at growth rate). (in the appendix) presents the patent intensity for only countries that have a considerable number of patents. This figure shows that, while most countries stay flat, South Korea and China both showed a growing tendency in terms of biotechnology intensity.
Table 1. Growth rate of total patents and patent intensity in the selected countries/region.
4.2. Upgrading patterns in different biotech fields in China
Technological Specialization has been seen as a common phenomenon in the process of technology upgrading and economic catching-up (Franco et al., Citation2011; Lacasa, Giebler, & Radošević, Citation2017; Lee, Citation2013; Manning, Citation2017; Von Wartburg et al., Citation2005). Following the Revealed Comparative Advantage Index (RCA) proposed by Balassa (Citation1965), the Revealed Technology Advantage Index (RTA) has been used to evaluate one country’s comparative advantage in certain technological domains (Archibugi & Pianta, Citation1992; Cantwell & Vertova, Citation2004; Soete, Citation1987). Here we calculate one country’s comparative advantage in each biotech sub-field as follows:(1)
(1) where
is the comparative advantage index for biotech sub-field i in country j.
is the volume of patents in this biotech sub-field in country j and
is the total number of patents in all biotech fields in country j. Similarly,
is the volume of patents in this biotech field in all countries and
is the total number of patents in all biotech fields in all countries. If the RTA value is higher than 1 in a certain field, then the country has comparative advantage in this technological domain.
The RTA index in Equation (1) is one country’s comparative technology advantage in certain field. We interpret a high RTA as a strong specialization in this field. However, this index alone is not enough to illustrate one country’s general specialization/diversification level of all fields. To understand the degree of balanced technological development in one country, we assess from the distribution of RTAs in all fields. Following Cantwell and Vertova (Citation2004), we use the reciprocal of the coefficient of variation of RTAs () to represent the general level of technological diversification in one country.Footnote11
Given that it is difficult to judge the quality of patents filed in different patent offices, it is inappropriate to simply compare the number of patents across countries. Instead, we suggest looking at the catching-up process from a dynamic view. For the case of China, patents in industrial biotech field have grown from only 3% of global totalFootnote12 in 2006–29% in 2015. Different from industrial biotech, in both scientific and technological activities, medical biotech is a weak field in China. presents the RTA indices of three biotech fields in China, in comparison with those in the US and South Korea. The results show that the US has higher technology advantage in the fields of agricultural and medical biotech. However, China and South Korea have higher RTA scores in industrial biotech. The comparative advantage of agriculture has improved remarkably, from 0.49 in 2006 to 0.95 in 2015 in China. This shows that in China technologies in this field have been strengthened more in later years than in earlier years. There is not much change with the value of comparative advantage in the field of Medical biotech, which has been always around 0.80. The RTA index of industrial biotech stays higher than 1, even with an increasing trend.
Table 2. Revealed technology advantage of biotech fields.
We reason that emerging economies have higher chances to catch up in the relatively new technology domains. Industrial biotech is the field in which China has found its way to strengthen its capacity.
Typical application of biotechnology in industry use enzymes, micro-organisms and other biocatalysts to create new products (Linton, Wise, & Stone, Citation2009). There are three reasons for the rapid development of industrial biotechnology. First, in this filed there are many new disruptive technologies, e.g. artificial design and operation of organisms and natural cell plant synthesis of useful substances. The technological gap between developing and developed countries in such emerging technologies is narrow. This makes it possible for latecomers to catch up in this field. This also explains why young companies, such as Amyris, Ginkgo Bioworks and Zymergen, achieved an enormous success in the field of industrial biotechnology. Second, different from the traditional chemical and pharmaceutical development model, the development of industrial technologies does not necessarily rely on either large-scale production facilities or long-term trial development process. It is easy for firms to bring knowledge from laboratory to factory production. In line with Lee (Citation2013), this emphasizes the scenario of specializing in short-cycle technologies, which was also seen in the catching-up process in Korea and Taiwan in the 1980s (Lee, Citation2013). A third reason is that there is a close relationship between research institute and firms in the field of industrial biotechnology. Though conducted in universities or research institutes, research on industrial biotechnology aims to solve practical problems in the production process, such as advancing product design, increasing productivity or efficiency, reducing production cost. Technology transfer characterizes industrial biotechnology. For instance, soon after a new solution of the synthesis of succinic acid raw materials proposed by Chinese Academy of Sciences (Tianjin Institute of Industrial Biotechnology), this technique has been immediately transferred to a company in Shan Dong,Footnote13 expecting to produce 500,000 tons of succinic acid and 100,000 tons of bio-based products per year and create China's largest bio-based succinic acid industry base.
The high RTA index in industrial biotech suggests that China has focused more on developing the less path-dependent and short-cycle technologies, which is also in line with the catching-up strategy observed earlier in Korea and Taiwan by Lee (Citation2013). While having a focus on industrial biotech, however, China has also showed a steady improvement in its diversification level, from 2.48 in 2006 to 5.40 in 2015 (). This suggests that China has been on the one hand taking the technological opportunities of short-cycle technologies, while on the other hand strengthening technologies in disadvantageous fields.Footnote14
4.3. Organizational pattern in different biotech fields in China
Public organizations (research institutes and universities) have been the major contributor to scientific and technological output in China. In this study, we extracted the information of organizations for biotech patent applicants in China. describes the organizational structure as an average percentage share of five different organizational types for three different biotech fields between 2001 and 2015. Universities and research institutes accounted for about 70% of the total patents in the agricultural biotech field while firms accounted for only 16%. However, in the field of industrial biotech, firms are the major patent applicants contributing to 35% of the total patent output. Enterprises, universities, and research institutes contributed to the medical biotech field equally. The category ‘government agencies and organizations’ include mostly hospitals. Hence this type of organization produced patents in the medical biotech field.
Table 3. Organizational structure of patent applicants.
To further understand the relationship between technological output and several factors, we use Pearson correlation coefficients (r) to evaluate the association between patents and other variables. documents the results of Person correlation coefficients. The coefficient values, ranging from −1 to +1, represent the strength of linear association between the studied two variables. A value of −1 shows a strong negative linear correlation, and +1 shows a strong positive linear correlation, and 0 means no linear correlation.
Table 4. Pearson correlation coefficients (r) between granted patents and several factors (2006–2015).
In the sub-field of industrial biotechnology, the share of patents from firms is significantly correlated with granted patents (r = 0.6698), showing that firms have made a positive and significant contributions to the growth of granted patents in this field. By contrast, in the fields of agricultural biotech and medical biotech, the coefficient of share of firms is negative (−0.6282 and −0.4822, respectively) and nonsignificant. In terms of share of public organizations (universities and research institutes), the coefficient is high and significant in both agricultural biotech and medical biotech (0.8205 and 0.9032 respectively), but nonsignificant in the field of industrial biotech (0.4572).
The global share of biotech publications and global share of high-quality publications have both highly significant positive coefficients, showing the close linear correlation between the output of bioscience and biotechnology. We discuss this further in Section 4.4.
Gao and Guan (Citation2009) suggest that ‘China research institutions financed by the government play a more important role than enterprises’. However, our results show that firms play a key role in upgrading industrial biotechnology in China. Leading Chinese companies in industrial biotechnology include Angel Yeast, Meihua group, Fufeng Group Co., Ltd., Vland Biotech Inc., Zhejiang Hisun Pharmaceutical Co. Ltd., Tianguan Group etc. Public organizations are more important in the fields of argicultural biotech and medical biotech.
4.4. Co-evolution of bio-technology and bio-science
It is believed that basic research plays an important role in supporting industry and the whole economy (McMillan, Narin, & Deeds, Citation2000). We show in that both biotech scientific publications are highly and positively correlated with the granted biotech patents in China.
In this section, we investigate the co-evolution of bio-science and bio-technology in different countries. presents the Pearson correlation coefficients between biotech patents and publications in the selected countries. In the six top countries, the correlation coefficient is extremely high (r = 0.9719) and highly significant (P < .0000) in agricultural biotech field. This means that the strength of correlation between bio-science and bio-technology is very high in these countries. In the medical biotech field, the correlation coefficient is also higher than 0.9. Though to a lesser degree, the correlation in the industrial biotech field is also reasonably high (r = 0.6424). This suggests that biotechnology and bioscience have been co-evolving in agricultural biotech in the six top countries. In South Korea and China, the correlation coefficients are high in all the three fields, with a value around 0.86 in South Korea and 0.91–0.98 in China.
Table 5. Pearson correlation coefficients (r) between biotech patents and publications.
Still, the strong linear association between bio-science and bio-technology is not seen in East Europe. In agricultural biotech and medical biotech, the coefficients are around 0.35. In the field of industrial biotechnology, the coefficient (r = 0.1059) shows there is almost no linear association between bioscience and biotechnology. Though the correlation is significant in the field of medical and agricultural biotech, the coefficients are extremely low, around 0.35.
Perez and Soete (Citation1988, p. 476) reason, ‘much of the knowledge required to enter a technology system in its early phase’ is ‘public knowledge available at universities.’ Science developed in universities helps the entry into an innovative technology system that is crucial for the process of catching up (Perez & Soete, Citation1988). Zucker et al. (Citation1998) suggest that biotechnology in the US has been ‘intertwined with the development of the underlying science in a way which illustrates the significance in practice of the localized spillovers concept’ and that ‘biotechnology industry is a testament to the value of basic scientific research’. If this theory also holds for the biotechnology industry in China, the co-evolution of bioscience and biotechnology shows that the biotech upgrading in China is on a feasible path.
4.5. Technological sources in catching-up
We consider patent citations as a proxy to track knowledge sources (Hu & Jaffe, Citation2003). Using citation analysis, we explore the knowledge sources for China’s biotechnology. supplies the shares of country/region origins of patents cited by Chinese inventions.
Table 6. Shares of knowledge sources for patents granted to Chinese inventors.
We classify patents into two groups: the Chinese patent office (i.e. SIPO data) and the foreign patent offices (i.e. non-SIPO data). To capture the dynamic feature of citations, we compare the later stage (2015) with the earlier stage (2006).
Patents from the US had an extremely high share in the citation pool for Chinese inventors to develop new patents earlier on. Later, the share of cited Chinese patents has been growing steadily in all the studied three biotech fields. In the industrial biotech field in 2006, for instance, 39% of cited patents by Chinese patents were from the US, 13% from Japan and 47% from China. However, the shares of cited patents from the US, Japan both reduced to 7% in 2015, while the share of cited patents from China increased to 76%.
In the non-SIPO patents, the weight of cited patents from the US, Europe and Japan is higher than that in the SIPO patents. Nevertheless, the share of local knowledge in both three fields is remarkably increasing, from 11% to 20% in industrial biotech, from 4% to 23% in agricultural biotech, and from 12% to 39% in medical biotech field. Interestingly, while the share of US cited patents is going down in all three fields, the share of cited patents from Europe is going up in most of the cases.
Hu and Jaffe (Citation2003) found that Japan and the US have played an important role in the technology development in Korea and Taiwan based on citation analysis. Our study suggests that in technology upgrading in China, the US has played a dominant role in supplying knowledge sources. However, the citation dependence of China on the US has declined substantially. In all the three fields and in both data samples, evidence shows that local knowledge is on the rise as an important source for developing new biotech inventions in China.
Local technological learning has been important for the development of biotechnology in China. presents the share of local patents cited by Chinese biotech patents in the period between 2006 and 2015. On the top are the three fields in the SIPO sample. Patents filed in SIPO are those with protection from Chinese market. According to the linear line plotted, there is a slope of 0.024, 0.014 and 0.021 in the field of industrial biotech, agricultural biotech, and medical biotech respectively. This implies that every year the share of local patents cited by Chinese biotech patents grows at 2.4%, 1.4% and 2.1%, respectively, in these three fields. In the non-SIPO sample, which includes patents filed and protected outside of China, the share of local patent citations is lower than that of SIPO patents (see the three dotted lines in ).Footnote15
Figure 2. Share of local patents cited by Chinese biotech patents.
Note: We take the share in non-SIPO patents as a two-year moving average.
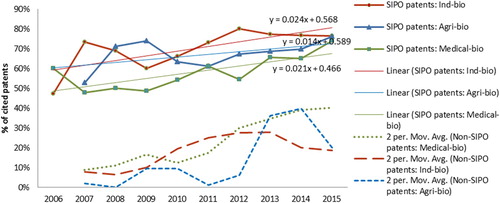
In both patent samples, granted by SIPO and non-SIPO authorities, it is clear that the shares of Chinese local technological capabilities have been steadily growing over years. In accordance with the aim of indigenous innovation promoted by the Chinese government (stated in the “Medium- and Long- Term Programme for Science and Technology Development’), China appears to be on its way in technology upgrading.
5. Conclusions
There has been some controversy over whether China is catching up with the technological leaders in biotechnology. Using the patents from USPTO, EPO and JPO, Hanel (Citation2017) found that the share of biotechnology patents in these three patent offices was extremely low, suggesting that China is far from the technology frontier. Given that SIPO filed the majority of Chinese biotechnology patent applications, we contend it is inappropriate to evaluate invention performance of emerging countries relying only on the USPTO, EPO or JPO data. In this paper, we use patent data from eight different patenting authorities to explore the dynamic change of China in the past 10 years.
We considered technology upgrading in China from two perspectives. First we studied the specialization pattern of the biotech upgrading from the technological and organizational perspectives and then we explored the knowledge sources for technology upgrading, including scientific background and technological knowledge flows.
Over the past 10 years, China has been specialized in the sub-field of industrial biotech. Yet, in the sub-field of medical biotechnology, China still appears weak. China’s successful technology upgrading in industrial biotechnology is due to technological opportunities in this field, non-path-dependency (not relying on large-scale production facilities or long-term trial development), and involvement of enterprises. The literature suggests that research institutes financed by the Chinese government contribute the largest share in total patents in China (Gao & Guan, Citation2009). By contrast, we find that enterprises have been playing a key role in advancing industrial biotechnologies in China. Public research institutes and universities are still the main contributors in the fields of agricultural biotech and medical biotech, as expected.
Taking all sub-fields into consideration, the diversification level shows an increasing trend. This suggests that China has been on the one hand taking the technological opportunities of short-cycle technologies, while on the other hand strengthening technologies in disadvantageous fields.
With regard to the knowledge sources of biotech upgrading, first, we find that biotech-related scientific and technological activities go together. The strong bioscience background seems to signal a promising future for technological and economic development in the long run (Adams, Citation1990; Beise & Stahl, Citation1999). Second, citation analysis on technological sources suggests that, although Chinese inventions were developed heavily based on external knowledge sources in the US, local knowledge has become an increasingly important resource for the development of new biotechnologies in China. This indicates a remarkable move towards the indigenous innovation goal set by Chinese government.
Yet, it is hard to judge whether China has caught up in the field of biotechnology, as it is difficult to compare the quality of patents from different countries. Evidence suggests that China is on a path of technological learning and upgrading that leads to catching up. It takes the technological opportunity by focusing on industrial-biotech, and meanwhile strengthens technologies in disadvantageous fields. The co-evolution of academic research in biotech may have provided a solid foundation for developing competitive biotechnology in the long-run. The increasing importance of local knowledge in the development of new biotechnologies shows that China is moving on a path from imitative to indigenous innovation.
Finally, the empirical analysis of this study is based on patent data. Although being a widely accepted proxy, patent data do not completely capture innovation activities. Future research on non-patented biotech innovations is recommended.
Acknowledgements
The author Lili Wang would like to thank the support from Beijing Academy of Science and Technology (BJAST) and Beijing Research Centre for Science of Science (BJSS).
Disclosure statement
No potential conflict of interest was reported by the authors.
Notes on contributors
Lili Wang obtained her PhD degree from Eindhoven University of Technology and currently works at UNU-MERIT, The Netherlands. Her research interests cover two main strands: (a) S&T economics, innovation systems and policy, emerging technologies, and (b) economic growth and structural change in developing countries. She has widely published in peer-reviewed journals, such as Proceedings of the National Academy of Sciences of the United States of America (PNAS), Research Policy, Regional Studies, Technological Forecasting & Social Change, Journal of Informetrics, Industrial and Corporate Change, Oxford Development Studies, Scientometrics, China Economic Review, Research Evaluation, etc.
Fang Chen is research professor at the Chengdu Library and Information Center of Chinese Academy of Sciences, P. R. China, and Head of Information Research Department. She got her PhD degree in applied chemistry from the University of Chinese Academy of Sciences before she came to Chengdu Library and Information Center to work on biotechnology information research. She has coordinated and conducted various projects for the Ministry of Science and Technology of China (MOST) and Chinese Academy of Sciences in the field of biotechnology since 2006, and specialized in industrial biotechnology area.
Mark Knell is research professor specializing in the economics of innovation at the Nordic Institute for Studies in Innovation, Research and Education (NIFU), Norway. He has published widely on various aspects of technology and innovation, history of economic thought, and the economic transformation of Eastern Europe in international peer-reviewed journals and edited books.
Notes
1 OECD, Statistical Definition of Biotechnology, http://www.oecd.org/sti/biotech/statisticaldefinitionofbiotechnology.htm, 2001.
2 The ‘distance’ between the technological frontier and the laggard country depends on various factors, as well as on innovation in the frontier country. Fagerberg considered patents as a proxy for the development of new knowledge and R&D as a proxy for the assimilation of foreign technology. Fagerberg et al. (Citation2007) developed a straightforward way to use factor analysis to create composite indicators of types of competitiveness that can affect the catching-up process.
3 Specialization in building technological capabilities has been observed in Central and Eastern Europe (Lacasa et al., Citation2017) and in India and Brazil (Franco et al. Citation2011).
4 OECD, A Framework for Biotechnology Statistics, http://www.oecd.org/science/inno/34935605.pdf, 2005.
5 CAS-TWAS and Clarivate Analytics, Biotechnology in Developing Countries Growth and Competitiveness, http://english.cas.cn/newsroom/news/201611/t20161114_170433.shtml, updated on 14 November 2016.
6 The document of ‘Medium- and Long-Term Programme for Science and Technology Development’ (in Chinese) is at http://www.most.gov.cn/http://www.most.gov.cn/kjgh/kjghzcq/.
8 Bio-energy, bio-manufacturing and bio-environmental protection all belong to the field of industrial biotech.
10 Data from 2017.
11 Cantwell and Vertova (Citation2004) standardized RTA indices (keeping the values between −1 and +1) before calculating the diversification index. In our case, we compared both methods (standardized and non-standardized), and the results are similar to each other. Here we report only on the non-standardized results.
12 Covered by the eight studied patent authorities.
14 Country size and national strategy can influence the patterns of technological diversification (Cantwell & Vertova, Citation2004; Lee, Citation2013). We do not intend to compare the diversification values across countries but within country over years.
15 There are more fluctuations in non-SIPO patents than SIPO patents. Because of this, we take the share in the non-SIPO sample as a two-year moving average.
References
- Acs, Z. J., Anselin, L., & Varga, A. (2002). Patents and innovation counts as measures of regional production of new knowledge. Research Policy, 31(7), 1069–1085. doi: 10.1016/S0048-7333(01)00184-6
- Adams, J. D. (1990). Fundamental stocks of knowledge and productivity growth. Journal of Political Economy, 98(4), 673–702. doi: 10.1086/261702
- Allansdottir, A., Bonaccorsi, A., Gambardella, A., Mariani, M., Orsenigo, L., Pammolli, F., & Riccaboni, M. (2002). Innovation and competitiveness in European biotechnology. Directorate-General European Commission, Enterprise Papers-No.7.
- Amsden, A. (2001). The rise of ‘the Rest’: Challenges to the West from late-industrializing economies. New York, NY: Oxford University Press.
- Archibugi, D., & Pianta, M. (1992). The technological specialization of advanced countries. Brussels-Luxembourg: SpringerScience + Business MediaDordrech.
- Arundel, A., Bordoy, C., & Kanerva, M. (2008). Neglected innovators: How do innovative firms that do not perform R&D innovate? Results of an analysis of the innobarometer 2007 survey 215, INNO-Metrics Thematic Paper, March 31, 2008.
- Balassa, B. (1965). Trade liberalization and ‘revealed’ comparative advantage. The Manchester School, 33(2), 99–123. doi: 10.1111/j.1467-9957.1965.tb00050.x
- Beise, M., & Stahl, H. (1999). Public research and industrial innovations in Germany. Research Policy, 28, 397–422. doi: 10.1016/S0048-7333(98)00126-7
- Boroush, M., & Jankowski, J. (2016). Update on U.S. Business Innovation: Findings from 2011 Survey. InfoBrief National Center for Science and Engineering Statistics NSF 16-308.
- Cantwell, J., & Vertova, G. (2004). Historical evolution of technological diversification. Research Policy, 33(3), 511–529. doi: 10.1016/j.respol.2003.10.003
- CAS-TWAS and Clarivate Analytics. (2016). Biotechnology in developing countries growth and competitiveness, CAS-TWAS Centre of Excellence for Biotechnology. http://english.im.cas.cn/ns/es/201611/W020161115403490152491.pdf.
- Chang, H. J. (2002). Kicking away the ladder – development strategy in historical perspective. London: Anthem Press.
- Chung, M. Y., & Lee, K. (2015). How absorptive capacity is formed in a latecomer economy: Different roles of foreign patent and know-how licensing in Korea. World Development, 66, 678–694. doi: 10.1016/j.worlddev.2014.09.010
- Cohen, W. M., & Levinthal, D. A. (1989). The two faces of R&D. Economic Journal, 99(397), 569–596. doi: 10.2307/2233763
- Cohen, W. M., & Levinthal, D. A. (1990). Absorptive capacity: A new perspective on learning and innovation. Administrative Science, 35, 128–152. doi: 10.2307/2393553
- Dosi, G., & Castaldi, C. (2003). Local and divergent patterns of technological learning within (partly) globalized markets. LEM Working Paper Series.
- Eberhardt, M., Helmers, C., & Yu, Z. (2011). Is the dragon learning to fly? An analysis of the Chinese patent explosion. The University of Nottingham Research Paper 2011/16.
- Ernst, D. (1998). Catching-up, crisis and industrial upgrading: Evolutionary aspects of technological learning in Korea’s electronics industry. Asia Pacific Journal of Management, 15, 247–283. doi: 10.1023/A:1015493615652
- Fagerberg, J., Srholec, M., & Knell, M. (2007). The competitiveness of nations: Why some countries prosper while others fall behind. World Development, 35, 1595–1620. doi: 10.1016/j.worlddev.2007.01.004
- Fagerberg, J., Srholec, M., & Verspagen, B. (2010). Innovation and economic development. In B. Hall, & N. Rosenberg (Eds.), Handbook of the economics of innovation (Vol. II, pp. 833–872). Amsterdam: North-Holland.
- Franco, E., Ray, S., & Ray, P. K. (2011). Patterns of innovation practices of multinational-affiliates in emerging economies: Evidences from Brazil and India. World Development, 39(7), 1249–1260. doi: 10.1016/j.worlddev.2011.03.003
- Fu, X. (2015). China's path to innovation. Cambridge: Cambridge University Press.
- Fu, X., & Gong, Y. (2011). Indigenous and foreign innovation efforts and drivers of technological upgrading: Evidence from China. World Development, 39(7), 1213–1225. doi: 10.1016/j.worlddev.2010.05.010
- Fu, X., Pietrobelli, C., & Soete, L. (2011). The role of foreign technology and indigenous innovation in the emerging economies: Technological change and catching-up. World Development, 39(7), 1204–1212. doi: 10.1016/j.worlddev.2010.05.009
- Gambardella, A., Orsenigo, L., & Pammolli, F. (2000). Global competitiveness in pharmaceuticals: A European perspective. Directorate-General European Commission, Enterprise Papers.
- Gao, X., & Guan, J. (2009). A scale-independent analysis of the performance of the Chinese innovation system. Journal of Informetrics, 3(4), 321–331. doi: 10.1016/j.joi.2009.04.004
- Gereffi, G. (1999). International trade and industrial upgrading in the apparel commodity chain. Journal of International Economics, 48, 37–70. doi: 10.1016/S0022-1996(98)00075-0
- Griliches, Z. (1990). Patent statistics as economic indicators: A survey. Journal of Economic Literature, 28(4), 1661–1707.
- Grossman, G. M., & Helpman, E. (1991). Quality ladders in the theory of growth. The Review of Economic Studies, 58(1), 43–61. doi: 10.2307/2298044
- Gu, S., & Lundvall, B-Å. (2006). China’s innovation system and the move towards harmonious growth and endogenous innovation. Innovation: Management, Policy and Practice, 8(1–2), 1–26. doi: 10.5172/impp.2006.8.1-2.1
- Gu, S., Lundvall, B. Å., Ju, L., Malerba, F., & Serger, S. S. (2009). China’s system and vision of innovation: An analysis in relation to the strategic adjustment and the medium- to long-term S&T development plan (2006–20). Industry and Innovation, 16(4–5), 369–388. doi: 10.1080/13662710903053631
- Gu, S., Schwag Serger, S., & Lundvall, BÅ. (2016). China’s innovation system: Ten years on. Innovation: Management, Policy and Practice, 18(4), 441–448. doi: 10.1080/14479338.2016.1256215
- Hanel, P. (2017). Is China catching up? Health-related applications of biotechnology. In T. G. Bas & J. Zhao (Eds.), Comparative approaches to biotechnology development and use in developed and emerging nations (pp. 465–520). Hershey: IGI Global.
- Hu, A. G. Z., & Jaffe, A. B. (2003). Patent citations and international knowledge flow: The cases of Korea and Taiwan. International Journal of Industrial Organization, 21(6), 849–880. doi: 10.1016/S0167-7187(03)00035-3
- Humphrey, J., & Schmitz, H. (2002). How does Insertion in global value chains affect upgrading in industrial clusters? Regional Studies, 36(9), 1017–1027. doi: 10.1080/0034340022000022198
- Jaffe, A., & Trajtenberg, M. (2002). Patents, citations, and innovations: A window on the knowledge economy. Cambridge: MIT Press.
- Katz, J. M. (1984). Domestic technological innovations and dynamic comparative advantage: Further reflections on a comparative case-study program. Journal of Development Economics, 16(1), 13–37. doi: 10.1016/0304-3878(84)90100-7
- Kim, L. (1997). Imitation to innovation: The dynamics of Korea’s technological learning. Harvard: Harvard Business School Press.
- Kim, L., & Nelson, R. R. (2000). Technology, learning, and innovation: Experiences of newly industrialising economies. Cambridge: Cambridge University Press.
- Lacasa, I. D., Giebler, A., & Radošević, S. (2017). Technological capabilities in central and Eastern Europe: An analysis based on priority patents. Scientometrics, 111, 83–102. doi: 10.1007/s11192-017-2277-2
- Lee, K. (2013). Schumpeterian analysis of economic catch-up: Knowledge, path-creation, and the middle-income trap. Cambridge, UK: Cambridge University Press.
- Lee, K., & Lim, C. (2001). Technological regimes, catching-up and leapfrogging: Findings from the Korean industries. Research Policy, 30, 459–483. doi: 10.1016/S0048-7333(00)00088-3
- Lee, K., & Malerba, F. (2017). Economic catch-up by latecomers as an evolutionary process. In R. R. Nelson (Ed.), Modern evolutionary economics (pp. 172–207). Cambridge: Cambridge University Press.
- Linton, K., Wise, J., & Stone, P. (2009). Industrial biotechnology : Patenting and innovation. USITC Staff Research Study Working Paper.
- Malo, S., & Geuna, A. (2000). Science-technology linkages in an emerging research platform: The case of combinatorial chemistry and biology. Scientometrics, 47(2), 303–321. doi: 10.1023/A:1005643127551
- Manning, S. (2017). The rise of project network organizations: Building core teams and flexible partner pools for interorganizational projects. Research Policy, 46(8), 1399–1415. doi: 10.1016/j.respol.2017.06.005
- Marshall, A. (1890/1961). Principles of economics, 9th Variorum Edition, C. W. Guillebaud (Ed.). London: Macmillan.
- Mazzucato, M., & Dosi, G. (eds.). (2006). Knowledge accumulation and industry evolution: The case of pharma-biotech. Cambridge: Cambridge University Press.
- McMillan, G. S., Narin, F., & Deeds, D. L. (2000). An analysis of the critical role of public science in innovation: The case of biotechnology. Research Policy, 29(1), 1–8. doi: 10.1016/S0048-7333(99)00030-X
- Meyer, M. (2000). Does science push technology? Patents citing scientific literature. Research Policy, 29(3), 409–434. doi: 10.1016/S0048-7333(99)00040-2
- Morrison, A., Pietrobelli, C., & Rabellotti, R. (2008). Global value chains and technological capabilities: A framework to study learning and innovation in developing countries. Oxford Development Studies, 36, 39–58. doi: 10.1080/13600810701848144
- Motohashi, K., & Yun, X. (2007). China’s innovation system reform and growing industry and science linkages. Research Policy, 36(8), 1251–1260. doi: 10.1016/j.respol.2007.02.023
- Murray, F. (2002). Innovation as co-evolution of scientific and technological networks: Exploring tissue engineering. Research Policy, 31(8–9), 1389–1403. doi: 10.1016/S0048-7333(02)00070-7
- Narin, F., Hamilton, K. S., & Olivastro, D. (1997). The increasing linkage between U.S. technology and public science. Research Policy, 26, 317–330. doi: 10.1016/S0048-7333(97)00013-9
- Nightingale, P. (2004). Technological capabilities, invisible infrastructure and the un-social construction of predictability: The overlooked fixed costs of useful research. Research Policy, 33(9), 1259–1284. doi: 10.1016/j.respol.2004.08.008
- Niosi, J. (2011). Complexity and path dependence in biotechnology innovation systems. Industrial and Corporate Change, 20, 1795–1826. doi: 10.1093/icc/dtr065
- Niosi, J., & Banik, M. (2005). The evolution and performance of biotechnology regional systems of innovation. Cambridge Journal of Economics, 29(3), 343–357. doi: 10.1093/cje/bei044
- Niosi, J., & Bellon, B. (1996). The globalization of national innovation systems. In J. De La Mothe, & G. Paquet (Eds.), Evolutionary economics and the new international political economy (pp. 138–159). New York, NY: Pinter.
- OECD. (2009). OECD biotechnology statistics. Paris: Organization for Economic Co-operation and Development.
- OECD. (2013). OECD science, technology and industry scoreboard 2013. Paris: OECD.
- Pavitt, K., & Soete, L. (1980). Innovative activities and export shares: Some comparisons between industries and countries. In K. Pavitt (Ed.), Technical innovation and British economic performance (pp. 38–66). London: Macmillan.
- Pavitt, K., & Soete, L. (1981). International differences in economic growth and the international location of innovation. In H. Giersch (Ed.), Emerging technologies: Consequences for economic growth, structural change, and employment (pp. 105–144). Tubingen: Institut für Weltwirtschaft an der Universität Kiel.
- Perez, C., & Soete, L. (1988). Catching up in technology: entry barriers and windows of opportunity. In G. Dosi, C. Freeman, R. Nelson, G. Silverberg, & L. Soete (Eds.), Technical change and economic theory (pp. 458–479). London: Printer Publisher Limited.
- Powell, W. W., Koput, K. W., & Smith-Doerr, L. (1996). Interor- ganizational collaboration and the locus of innovation: Networks of learning in biotechnology. Administrative Science Quarterly, 41, 116–145. doi: 10.2307/2393988
- Radosevic, S., & Yoruk, E. (2016). Why do we need a theory and metrics of technology upgrading? Asian Journal of Technology Innovation, 24(sup1), 8–32. doi: 10.1080/19761597.2016.1207415
- Radosevic, S., & Yoruk, E. (2018). Technology upgrading of middle income economies: A new approach and results. Technological Forecasting and Social Change, 129, 56–75. doi: 10.1016/j.techfore.2017.12.002
- Rosenberg, N. (1974). Science innovation and economic growth. Economic Journal, 84, 90–108. doi: 10.2307/2230485
- Soete, L. (1987). The impact of technological innovation on international trade patterns: The evidence reconsidered. Research Policy, 16, 101–130. doi: 10.1016/0048-7333(87)90026-6
- Sorenson, O., & Fleming, L. (2004). Science and the diffusion of knowledge. Research Policy, 33(10), 1615–1634. doi: 10.1016/j.respol.2004.09.008
- Tijssen, R. J. W. (2001). Global and domestic utilization of industrial relevant science: Patent citation analysis of science-technology interactions and knowledge flows. Research Policy, 30(1), 35–54. doi: 10.1016/S0048-7333(99)00080-3
- Van Looy, B., Callaert, J., & Debackere, K. (2006). Publication and patent behavior of academic researchers: Conflicting, reinforcing or merely co-existing? Research Policy, 35(4), 596–608. doi: 10.1016/j.respol.2006.02.003
- Von Tunzelmann, N. (2009). Competencies versus capabilities: A reassessment. Economia Politica, 24, 435–464.
- Von Wartburg, I., Teichert, T., & Rost, K. (2005). Inventive progress measured by multi-stage patent citation analysis. Research Policy, 34(10), 1591–1607. doi: 10.1016/j.respol.2005.08.001
- Wang, L. (2016). The structure and comparative advantages of China’s scientific research: Quantitative and qualitative perspectives. Scientometrics, 106, 435–452. doi: 10.1007/s11192-015-1650-2
- Wang, L., Huub, M., & Szirmai, A. (2017). Technological spillovers and industrial growth in Chinese regions. Industrial and Corporate Change, 26(2), 233–257. doi: 10.1093/icc/dtw022
- Wang, L., Jacob, J., & Li, Z. (2019). Exploring the spatial dimensions of nanotechnology development in China: The effects of funding and spillovers. Regional Studies, 53(2), 245–260. doi: 10.1080/00343404.2018.1457216
- Wang, L., & Li, Z. (2018). Knowledge transfer from science to technology – The case of nano medical device technologies. Frontiers in Research Metrics and Analytics, 3(11), 1–8. doi: 10.3389/frma.2018.00011
- Wang, L., & Li, Z. (2019). Knowledge flows from public science to industrial technologies. Journal of Technology Transfer. doi: 10.1007/s10961-019-09738-9
- Wong, C.-Y., & Wang, L. (2015). Trajectories of science and technology and their co-evolution in BRICS: Insights from publication and patent analysis. Journal of Informetrics, 9(1), 90–101. doi: 10.1016/j.joi.2014.11.006
- Yoruk, D. E. (2013). Firm-level upgrading in low- and medium-technology industries in emerging markets: The role of learning in networks (Doctoral thesis). University of Sussex, Brighton UK.
- Zucker, L. G., Darby, M. R., & Brewer, M. B. (1998). Intellectual human capital and the birth of U.S. biotechnology enterprises. American Economic Review, 88(1), 290–306.
Appendix
Figure A1. Intensity of biotechnology (log of biotech patents per thousand inhabitants).
Note: Patent intensity is measured by the logarithm of granted patents per thousand inhabitants.