Abstract
Genetic variation was surveyed at four microsatellite loci and 1416 base pairs (bp) of the mitochondrial DNA (mtDNA) cytochrome c oxidase I gene (COI) to clarify the genetic structure of the small yellow croaker, Larimichthys polyactis, in the Yellow and East China Seas, especially regarding four provisional populations, (one Korean and three Chinese populations). Based on microsatellite DNA variations, the estimated expected heterozygosity (H E) in each population ranged from 0.776 to 0.947. The microsatellite pairwise F ST estimates showed no significant genetic differentiation between the populations. MtDNA variations also indicated no genetic structure in L. polyactis, but very high variability. The absence of genetic differentiation among and within populations of L. polyactis may either result from the random migration of the adult or the passive dispersal of the eggs and larvae.
Introduction
The small yellow croaker, Larimichthys polyactis, has received considerable attention because of its great commercial importance in both Korea and China (Han et al. Citation2009). It is geographically distributed in the Bohai Sea, Yellow Sea and East China Sea (Kim et al. Citation2006; Yamada et al. Citation2007; Han et al. Citation2009). In Korea, the catch of L. polyactis peaked at 54,000 tons in 1974, subsequently decreased to 7000 tons in 1984 and then increased to approximately 40,000 tons in the early 1990s. However, it decreased again to 17,000 tons in 2004 (Kim et al. Citation2006). Stocks of this species have been decreasing as a result of overfishing and/or changes in its environments, and further reductions in the availability of this species in nature are anticipated.
In recent years, policies to rebuild the L. polyactis population have been continuously reviewed in Korea to prevent its collapse. Many studies have focused on the population dynamics of L. polyactis and the management of its fisheries in Korea, addressing the age and growth of the species (Chung Citation1970; Lee et al. Citation2000; Kim et al. Citation2006), its ecological parameters and management (Zhang et al. Citation1992a, Citationb) and fisheries conditions (Baik et al. Citation2005). However, few studies of the stock structure of L. polyactis have been undertaken based on molecular markers. Hwang et al. (Citation1994) first demonstrated a lack of genetic structure in the L. polyactis population in the Yellow Sea using restriction fragment length polymorphism (RFLP) analysis of mitochondrial DNA (mtDNA), but suggested the need for further study. In recent years, Xiao et al. (Citation2009), Han et al. (Citation2009) and Kim et al. (Citation2010) have documented the stock structure of L. polyactis in the Yellow and East China Seas. Xiao et al. (Citation2009) and Kim et al. (Citation2010) maintained that L. polyactis comprises a single stock, on the basis of a mtDNA control region, whereas Han et al. (Citation2009) maintained that L. polyactis consists of at least three stocks (northern Yellow Sea stock, southern Yellow Sea stock and East China Sea stock), based on an amplified fragment length polymorphism (AFLP) analysis. These conflicting results reflect the need for additional DNA markers, such as microsatellite loci.
Recently developed mtDNA and nuclear DNA markers, such as microsatellite loci, are expected to detect genetic differences that distinguish populations of fish with increased accuracy and resolution (Dunham Citation2004). Maternally inherited mtDNA has greater sequence variability than most single-copy nuclear genes (Brown et al. Citation1979). The microsatellite loci are often considered more powerful molecular markers in detecting population heterogeneity than mtDNA RFLP or allozyme datasets (Estoup et al. Citation1998; Ross et al. Citation1999), because the former are highly polymorphic and biparentally inherited. Although microsatellite markers for L. polyactis were developed previously by Li et al. (Citation2006), no population genetic studies using these markers in field samples have been undertaken. In addition, it is necessary to study the population structure of L. polyactis using a less-variable mtDNA such as the gene encoding cytochrome c oxidase subunit I (COI), because the non-coding control region may not reflect true relationship among populations. In this study, the genetic variation of L. polyactis was examined at four microsatellite loci in 105 specimens and in mtDNA COI sequences in 49 specimens from four populations to identify the appropriate management unit.
Materials and methods
Sampling and preliminary treatment
Muscle samples were collected for microsatellite analysis from 105 individual fish from four breeding populations: one Korean and three Chinese populations ( and ). For the mtDNA analysis, we used 49 individuals that had also been used for the microsatellite analysis. The muscle samples were kept in ethanol until DNA extraction. DNA was isolated from the specimens described above with the conventional phenol–chloroform method (Sambrook et al. Citation1989). The extracted DNA was diluted with Tris–EDTA buffer (10 mM Tris–HCl, 1 mM EDTA, pH 8.0) to a final concentration of 100–500 ng/µL for PCR amplification. The PCR products were resolved electrophoretically on 1.5% agarose gel and stained in ethidium bromide to check their sizes and quality.
Figure 1. Sampling area for Larimichthys polyactis.
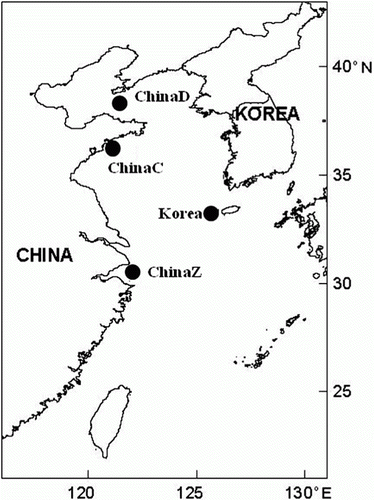
Table 1. Sampling locations, dates and the numbers for Larimichthys polyactis populations.
Microsatellite genotyping and population genetic analysis
In this study, four primer pairs for small yellow croaker microsatellite markers, previously developed by Li et al. (Citation2006), were used. The forward primer of each set was labelled with one of the following fluorescent dyes: 6FAM, NED or HEX. The process of PCR amplification, using a PTC-200 thermal cycler (MJ Research, Reno, NV, USA), was conducted as follows: a first denaturation step at 94°C for 2 min; 35 cycles of 30 s at 94°C, 30 s at the annealing temperature listed by Li et al. (Citation2006) and 30 s at 72°C; and a final extension for 5 min at 72°C. To screen for microsatellite polymorphisms, the size of fluorescence-labelled allele fragments was measured on an ABI PRISM 3130XL automated sequencer, followed by analysis with GeneMapper version 3.7 (Applied Biosystems, Foster, CA, USA). Estimates of the number of alleles (A), product size range (S) and allelic richness (A R), and the observed heterozygosity (H O) and expected heterozygosity (H E) per locus in each population were calculated using the programs FSTAT 2.9.3 (Goudet Citation2001) and GENEPOP version 3.4 (Rousset and Raymond Citation1995). The probability of deviations from Hardy–Weinberg expectation for each locus in all populations was computed with the Markov chain method (dememorisation=10,000, batch=1000, iterations per batch=1000) in GENEPOP version 3.4. Bonferroni adjustments (Rice Citation1989) were applied to correct the effect of multiple tests. Tests for the occurrence of null alleles were performed with MICRO-CHECKER 2.2.3 (Oosterhout et al. Citation2004) and were calculated for the frequencies of null alleles using CERVUS 3.0 (Kalinowski et al. Citation2007). Pairwise F ST values were used to estimate the genetic differentiation between population pairs, according to Slatkin (Citation1995), using the program FSTAT 2.9.3 (Goudet Citation2001). The significance of each F ST value was tested using 10,000 random permutations. After the construction of a genetic distance matrix based on a set of gene frequencies in different populations, estimated according to Nei (Citation1972)a neighbour-joining tree was constructed for each replicated genetic distance matrix, with 1000 bootstrap replications, using Neighbor in the PHYLIP version 3.5 software package (Felsenstein Citation1993). Genetic population structure was investigated using the Bayesian clustering approach implemented in the STRUCTURE program (Pritchard et al. Citation2000). We used an admixture model with correlated allele frequencies with a burn-in period of 50,000 iterations and 1 million Markov chain Monte Carlo (MCMC) repetitions to calculate the probable number of genetic clusters (K).
Mitochondrial DNA sequencing and population genetic analysis
The mtDNA COI sequences were amplified using a light-strand COI-F primer (5′-TAAATCTCAGCCATCTTACCTATG-3′) and a heavy-strand COI-R primer (5′-TTCGAGTCCTCCTTTTCTCGC-3′). The PCR reaction mixture contained 1 µL of genomic DNA (50 ng/µL), 18.25 µL of ddH2O, 2.5 µL of 10×PCR buffer (50 mM KCl, 2 mM MgCl2, 10 mM Tris–HCl; Biomedic Co., Korea), 2 µL of 2.5 mM dNTPs, 1 µL of each primer (0.5 µM COI-F and COI-R) and 0.25 µL of Taq DNA polymerase (5 unit/µL; Biomedic) in a 25 µL reaction volume. The PCR reactions proceeded with an initial denaturation at 95°C for 5 min; 35 cycles of denaturation at 95°C for 1 min, 55°C for 1 min and extension at 72°C for 1 min; and a final extension at 72°C for 5 min. The PCR products were purified with a PCR purification kit (Qiagen, Hilden, Germany) and subsequently used in direct cycle sequencing reactions with the BigDye Terminator v3.1 Cycle Sequencing Kit (Applied Biosystems). The DNA sequences were determined using the ABI 3730xl automated DNA sequencer (Applied Biosystems). The nucleotide sequence data reported here have been submitted to the DDBJ/EMBL/GenBank nucleotide sequence databases (accession numbers HQ385755–HQ385803). The DNA sequences were edited and aligned by eye using the BioEdit software (version 7.0.0). Pairwise fixation indices (F ST) between populations were calculated using the ARLEQUIN 3.1 program (Excoffier et al. Citation2005), and the significance of each F ST value was tested using 100,000 random permutations. The genetic distances within and between populations were calculated using the MEGA 3.1 program (Kumar et al. Citation1993). Phylogenetic relationships were estimated by the minimum spanning network (MSN) constructed according to the manual for ARLEQUIN 3.1.
Results and discussion
A total of 77 different alleles were observed across all loci for all the populations (Jejudo in Korea, and Zhoushan, Qingdao and Dalian in China). The observed alleles ranged from 12 alleles at LP11 to 25 alleles at LP11 over all the populations, indicating considerable variation among the four microsatellite loci. The observed and expected values for heterozygosity for all the populations ranged from 0.622 at LP7 to 0.861 at LP11, and from 0.818 at LP12 to 0.920 at LP11, respectively (). These results suggest that all the microsatellite loci were polymorphic, with large differences in the numbers of alleles. As shown in , the total number of alleles in each population ranged from 45 (ChinaC) to 57 (Korea), and followed the same trend as the trend for A R in the four populations. The H O of the overall loci per population ranged from 0.742 (ChinaZ) to 0.862 (ChinaD), and the H E of the overall loci ranged from 0.810 (ChinaD) to 0.913 (Korea). Although no meaningful difference in heterozygosity was found among the four populations, the H E and the number of observed alleles in the Korean population were the highest among the populations examined. The values for the inbreeding coefficient F IS and the evaluations of Hardy–Weinberg equilibrium (HWE) are shown in . The F IS value over all loci was higher in ChinaD (0.613) than in the other populations (0.088–0.151). Four of the 16 evaluations of HWE showed significant deviations from equilibrium, suggesting null alleles at some loci, as determined with MICRO-CHECKER and CERVUS (). No significant differences in the pairwise F ST estimates were detected among any of the population pairs (). A UPGMA tree suggests that all the populations of L. polyactis clustered together (). The Bayesian population clustering using STRUCTURE also supported the existence of a single, panmictic population at the microsatellite loci ().
Figure 2. UPGMA tree constructed from microsatellite loci for Larimichthys polyactis populations from Korea and China, according to Nei's genetic distance (1972) in Phylip v. 3.6.
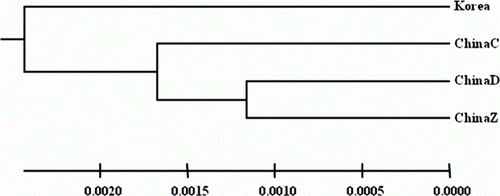
Figure 3. Bayesian inference of population structure for Larimichthys polyactis populations from Korea and China as determined by STRUCTURE. 1: Korea; 2: ChinaC; 3: ChinaD and 4: ChinaZ.
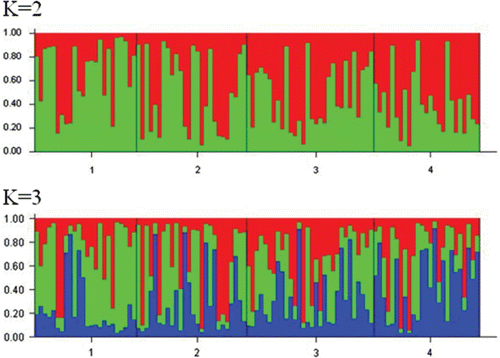
Table 2. Total number of alleles (A T), sizes of alleles in base pair (S), allelic richness (A R), observed (H O) and expected (H E) heterozygosities, probability of deviation from Hardy–Weinberg proportions (P HW) and inbreeding coefficient (F IS) of four microsatellite loci for Larimichthys polyactis populations from Korea and China.
Table 3. Pairwise F ST estimates among the four populations for Larimichthys polyactis based on four microsatellite loci and probability of differentiation with P value in F ST estimate and Fisher's exact test.
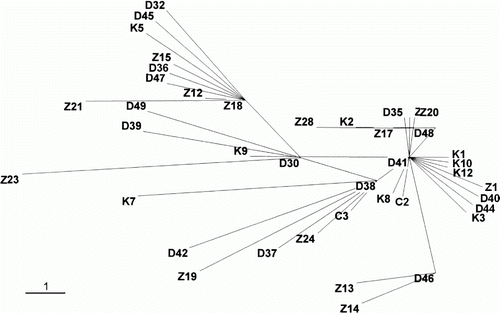
Sequences of 1416 bp of mtDNA COI were isolated from specimens collected from the four areas. Analysis of molecular variance showed that all the populations were genetically very diverse. All specimens displayed unique haplotypes, suggesting a high level of genetic variability in L. polyactis in the Yellow and East China Seas. Intra-populational genetic divergence was highest in ChinaZ (0.0047), followed by ChinaD (0.0036) and Korea (0.0034). Inter-populational genetic divergence was greatest between ChinaZ and ChinaD (0.0042) and smallest between Korea and ChinaC (0.0027). The differentiation index (F ST) was greatest between ChinaD and ChinaC (0.0271) and smallest between ChinaZ and ChinaC (0.0026), but these values do not have significant meaning in distinguishing populations (P>0.05). The MSN showed that all the specimens clustered as a mixture, regardless of population (). These results indicate that there is no population structure of L. polyactis in the Yellow and East China Seas, according to mtDNA COI analysis.
Figure 4. Minimum spanning network constructed using mtDNA COI for Larimichthys polyactis populations from Korea and China. K1–K14, C1–C3, D30–D49 and Z11–Z28 indicate individuals of L. polyactis from Jeju Island in Korea, and Qingdao, Dalian and Zhoushan in China, respectively. The bar reflects a one nucleotide difference.
Our analyses of microsatellite loci and mtDNA COI give congruent estimates of the population genetic structure of L. polyactis in the Yellow and East China Seas: (1) high levels of genetic variation in all the populations examined and (2) no significant differentiation between the populations of the Yellow and East China Seas. The latter finding carefully suggests that L. polyactis in the Yellow and East China Seas may be considered a single panmictic population, although the number of individuals examined here is slightly lower than 30 (). Our results were consistent with those of mtDNA CR (Xiao et al. Citation2009; Kim et al. Citation2010) but different from that of AFLP (Han et al. Citation2009). Han et al. (Citation2009) suggested the existence of four populations of L. polyactis in the Yellow and East China Seas with an AFLP analysis. According to Han et al. (Citation2009), the overall genetic differentiation among these four populations of small yellow croaker is small but significant (F ST=0.0422, P<0.001). Regarding the two types of molecular markers discussed above, microsatellite markers are more powerful markers, especially in the ecological applications (Selkoe and Toonen Citation2006), but AFLP can be a good alternative to microsatellite (Bensch and Åkesson Citation2005; Sønstebø et al. Citation2007). Nevertheless, in the case of small or recently bottlenecked populations, only the microsatellite with highest mutation rates are likely to be informative (Hedrick Citation1999).
Previous studies based on mtDNA CR have suggested that the L. polyactis in the Yellow and East China Seas comprises a single population (Xiao et al. Citation2009; Kim et al. Citation2010). According to those studies, mtDNA CR of L. polyactis has very high variability. In particular, Kim et al. (Citation2010) demonstrated that all 83 specimens collected from Korea and China represented unique haplotypes. Our mtDNA COI results are very consistent with the previous results for mtDNA CR (Xiao et al. Citation2009; Kim et al. Citation2010). The high haplotype diversity and the low nucleotide diversity in L. polyactis suggest historically rapid population growth from an ancestral population with a small effective population size (Avise Citation2000).
The population structures of many marine fishes often depend on the active migration of the adults and the passive dispersal of the larvae (Waples Citation1998; Cowen et al. Citation2000, Citation2003). The Tsushima Warm Current runs into the Yellow Sea, influencing the west coast of Korea, north to the Bohai Sea. The Tsushima Warm Current may transport eggs and larvae from the southern to the northern Yellow Sea. Generally, marine organisms whose planktonic larvae are passively dispersed form only a limited population substructure and may be strongly affected by sea currents (Lessios et al. Citation2001, Citation2003; Sekino and Hara Citation2001; Waters and Roy Citation2004; Saito et al. Citation2008). The spawning season of L. polyactis extends from April to June on the west coast of Korea (NFRDI Citation2005), at which time the Tsushima Warm Current is becoming stronger than it is in winter. As a result, the eggs and planktonic larvae of L. polyactis might be transported to the Bohai Sea. Therefore, the low pairwise F ST estimates and the lack of a relationship between their haplotype distributions and geographic locations suggest that sea currents are responsible for the high gene flow among the breeding populations of L. polyactis. Aguilar and John (Citation2006) reported that the genetic variation calculated from nuclear DNA (major histocompatibility complex sequences) correlated with that calculated with microsatellite markers in the coastal steelhead, Oncorhynchus mykiss. The present study shows similar patterns of genetic variation in L. polyactis populations based on the allelic variation at microsatellite loci and the haplotype diversity based on mtDNA COI. Moreover, the absence of genetic differentiation estimated with the microsatellite and mtDNA COI analyses among and within populations of L. polyactis may either result from the random migration of the adult or the passive dispersal of the eggs and larvae. Not with standing, further studies using larger number of populations and other microsatellite loci are required for more detailed population structure of the species. In addition, future studies based on isotope analysis are required to clarify the ecological characteristics such as natal homing.
Acknowledgements
We are grateful to anonymous reviewers for their valuable comments. This study was supported by the National Fisheries Research and Development Institute (Contribution number: ED-2011-FR-002) and Pukyong National University.
References
- Aguilar , A and John , CG. 2006 . A comparison of variability and population structure for major histocompatibility complex and microsatellite loci in California coastal steelhead (Oncorhynchus mykiss Walbaum) . Mol Ecol , 15 : 923 – 937 .
- Avise , JC. 2000 . Phylogeography: the history and formation of species , 1 – 447 . Cambridge : Harvard University Press .
- Baik , CI , Lee , CI , Choi , KH and Kim , DS. 2005 . Variation of fisheries conditions of fishing ground of yellow croaker (Pseudosciaena polyactis Bleeker) in the East China Sea and the Yellow Sea . J Kor Fish Soc , 38 : 413 – 424 .
- Bensch , S and Åkesson , M. 2005 . Ten years of AFLP in ecology and evolution: why so few animals? . Mol Ecol , 14 : 2899 – 2914 .
- Brown , WM , George , M Jr and Wilson , AC. 1979 . Rapid evolution of animal mitochondrial DNA . Proc Natl Acad Sci USA , 76 : 1967 – 1971 .
- Chung , SC. 1970 . Age and growth of the yellow croaker, Pseudosciaena manchurica Jordan et Thompson, in the western coastal waters of Korea . Bull Kor Fish Soc , 3 : 154 – 160 .
- Cowen , RK , Lwiza , KM , Sponaugle , S , Paris , CB and Olson , DB. 2000 . Science , 287 : 857 – 859 .
- Cowen , RK , Paris , CB , Olson , DB and Fortuna , JL. 2003 . The role of long distance dispersal in replenishing marine populations . Gulf and Caribbean Res , 14 : 129 – 137 .
- Dunham , RA. 2004 . Aquaculture and fisheries biotechnology , 85 – 103 . Wallingford : CABI Publishing Press .
- Estoup , A , Rousset , F , Michalakis , Y , Cornuet , JM , Adriamanga , M and Guyomard , R. 1998 . Comparative analysis of microsatellite and allozyme markers: a case study investigating microgeographic differentiation in brown trout (Salmo trutta) . Mol Ecol , 7 : 339 – 353 .
- Excoffier , L , Laval , G and Schneider , S. 2005 . Arlequin ver 3.1: an integrated software package for population genetics data analysis . Evol Bioinform Online , 1 : 47 – 50 .
- Felsenstein J. 1993 . PHYLIP (Phylogeny Interference Package) version 3.5c . Department of Genetics, Washington State University , Seattle .
- Goudet J. 2001 . FSTAT, a program to estimate and test gene diversities and fixation indices (version 2. 9. 3) .
- Han , ZQ , Lin , LS , Shui , BN and Gao , TX. 2009 . Genetic diversity of small yellow croaker Larimichthys polyactis revealed by AFLP markers . African J Agri Res , 4 : 605 – 610 .
- Hedrick , PW. 1999 . Perspective: highly variable loci and their interpretation in evolution and conservation . Evolution , 53 : 313 – 318 .
- Hwang , GL , Lee , YC , Chang , CS and Hue , HK. 1994 . Mitochondrial DNA analysis of the small yellow croaker (Pseudosciaena polyactis Bleeker) in the Yellow Sea . Bull Kor Fish Soc , 27 : 613 – 619 .
- Ikeda , I. 1964 . Studies on the fishery biology of the yellow croaker in the East China and Yellow Seas . Bull Seikai Reg Fish Res Lab , 31 : 49 – 81 .
- Kalinowski , ST , Taper , ML and Marshall , TC. 2007 . Revising how the computer program CERVUS accommodates genotyping error increases success in paternity assignment . Mol Ecol , 16 : 1099 – 1006 .
- Kim , JK , Kim , YH , Kim , MJ and Park , JY. 2010 . Genetic diversity, relationships and demographic history of the small yellow croaker, Larimichthys polyactis (Pisces: Sciaenidae) from Korea and China inferred from mitochondrial control region sequence data . Anim Cells Syst , 14 : 1 – 7 .
- Kim , YH , Lee , SK , Lee , JB , Lee , DW and Kim , YS. 2006 . Age and growth of small yellow croaker, Larimichthys polyactis in the south sea of Korea . Kor J Ichthyol , 18 : 45 – 54 .
- Kumar S , Tamura K , Nei M. 1993 . Guidelines for choosing distance measures . MEGA: Molecular Evolutionary Genetics Analysis. Version 1.01 . University Park Pennsylvania . p. 27 – 29 .
- Lee , MW , Zhang , CI and Lee , JU. 2000 . Age determination and estimation of growth parameters using otoliths of small yellow croaker, Pseudosciaena polyactis Bleeker in Korean waters . Bull Kor Soc Fish Tech , 36 : 222 – 233 .
- Lessios , HA , Kessing , BD and Pearse , JS. 2001 . Population structure and speciation in tropical seas: global phylogeography of the sea urchin Diadema . Evolution , 55 : 955 – 975 .
- Lessios , HA , Kane , J and Robertson , DR. 2003 . Phylogeography of the pantropical sea urchin Tripneustes: contrasting patterns of population structure between oceans . Evolution , 57 : 2026 – 2036 .
- Li , J , Feng , F and Yue , GH. 2006 . Twelve novel polymorphic microsatellites in a marine fish species, yellow croaker Larimichthys polyactis . Mol Ecol Note , 6 : 188 – 190 .
- Nei , M. 1972 . Genetic distances between populations . Amer Nat , 106 : 283 – 292 .
- NFRDI (National Fisheries Research and Development Institute) . 2005 . Ecology and fishing grounds . Busan : Ye-mun-Sa . p. 1 – 397 .
- Oosterhout , CV , Hutchinson , WF , Derek , P , Wills , M and Shipley , P. 2004 . MICRO-CHECKER: software for identifying and correcting genotyping errors in microsatellite data . Mol Ecol Notes , 4 : 535 – 538 .
- Pritchard , JK , Stephens , M and Donnelly , P. 2000 . Inference of population structure using multilocus genotype data . Genetics , 155 : 945 – 959 .
- Rice , W. 1989 . Analyzing tables of statistical tests . Evolution , 43 : 223 – 225 .
- Ross , KG , Shoemaker , DD , Krieger , MJB , DeHeer , CJ and Keller , L. 1999 . Assessing genetic structure with multiple classes of molecular markers: a case study involving the introduced fire ant (Solenopsis invicta) . Mol Biol Evol , 16 : 525 – 543 .
- Rousset , F and Raymond , M. 1995 . Testing heterozygote excess and deficiency . Genetics , 140 : 1413 – 1419 .
- Saito , T , Washio , S , Dairiki , K , Shimojo , M , Itoi , S and Sugita , H. 2008 . High gene flow in Girella punctata (Perciformes, Kyphosidae) among the Japanese Islands inferred from partial sequence of the control region in mitochondrial DNA . J Fish Biol , 73 : 1937 – 1945 .
- Sambrook , J , Fritsch , EF and Maniatis , T. 1989 . Molecular cloning. A laboratory manual , 2nd ed , New York : Cold Spring Harbor Laboratory Press .
- Sekino , M and Hara , M. 2001 . Application of microsatellite markers to population genetics studies of Japanese flounder Paralichthys olivaceus . Mar Biotech , 3 : 572 – 589 .
- Selkoe , KA and Toonen , RJ. 2006 . Microsatellites for ecologists: a practical guide to using and evaluating microsatellite markers . Ecol Lett , 9 : 615 – 629 .
- Slatkin , M. 1995 . A measure of population subdivision based on microsatellite allele frequencies . Genetics , 139 : 462 – 475 .
- Sønstebø , JH , Borgstrøm , R and Heun , M. 2007 . A comparison of AFLPs and microsatellites to identify the population structure of brown trout (Salmo trutta L.) populations from Hardangervidda, Norway . Mol Ecol , 16 : 1427 – 1438 .
- Waples , RS. 1998 . Separating the wheat from the chaff: patterns of genetic differentiation in high gene flow species . J Heredity , 89 : 438 – 450 .
- Waters , JM and Roy , MS. 2004 . Phylogeography of a high dispersal New Zealand sea-star: does upwelling block gene-flow? . Mol Ecol , 13 : 2797 – 2806 .
- Xiao , Y , Zhang , Y , Gao , T , Yanagimoto , T , Yabe , M and Sakurai , Y. 2009 . Genetic diversity in the mtDNA control region and population structure in the small yellow croaker Larimichthys polyactis . Environ Biol Fishes , 85 : 303 – 314 .
- Yamada , U , Tokimura , M , Horikawa , H and Nakabo , T. 2007 . Fishes and fisheries of the East China and Yellow Seas , 808 – 815 . Kanagawa : Tokai University Press .
- Zhang , CI , Kim , YM , Yoo , SJ , Kim , CK and Ahn , SM. 1992a . A study on fluctuations in biomass of small yellow croaker, Pseudosciaena polyactis, off Korea . Bull Kor Fish Soc , 25 : 37 – 44 .
- Zhang , CI , Kim , YM , Yoo , SJ , Park , CS , Kim , SA , Kim , CK and Yoon , SB. 1992b . Estimation of population ecological characteristics of small yellow croaker, Pseudosciaena polyactis, off Korea . Bull Kor Fish Soc , 25 : 29 – 36 .