
Abstract
Advertisement calls of some cicadas are so loud that they are a nuisance to city-dwellers in Korea. We hypothesized that the densities of cicada species were directly correlated with the availability of host plant species. We conducted complete enumeration surveys of exuviae in Hyalessa fuscata, Cryptotympana atrata, Meimuna spp., and Graptopsaltria nigrofuscata in three representative habitats in Republic of Korea: metropolitan, suburban, and country. We measured resource-weighted density of each species based on the area and the number of trees, and used those values to calculate organism-weighted density, which measures the intensity of competition that an individual experiences sharing its host with others of its own species. H. fuscata was the dominant species in all three habitats. H. fuscata and C. atrata comprised a minimum of 75.2% of all cicadas across all habitats and sampling periods. Resource-weighted densities of H. fuscata and C. atrata were much higher in the metropolitan habitat than in the country habitat. Habitat was a significant factor for variations in organism-weighted densities in C. atrata and G. nigrofuscata, but it was not in Meimuna spp. and H. fuscata. Some of the results concerning the percentages of trees without exuviae and preferred plants seemed to support the host availability hypothesis in C. atrata, Meimuna spp. and G. nigrofuscata, but they may not in H. fuscata. The similarity between resource-weighted and organism-weighted densities suggests that factors other than host availability, speculatively abiotic factors and predators, may also account for the patterns of population densities in C. atrata and G. nigrofuscata.
Introduction
Male cicadas typically produce loud advertisement calls to attract female cicadas for mating. The cicada choruses typically occur during the day, but often extend late into the night especially in cities. There are several hypotheses that might explain uneven cicada densities across habitats: (1) favorable abiotic conditions, (2) low predation pressure, and (3) host plant availability. Abiotic factors influence the density of cicadas because these factors directly affect life history traits, such as survival rate, hatching, oviposition, habitat selection, and so on. Abiotic factors that might influence cicada density include light, temperature, humidity, and rainfall. Light condition was found to be a critical factor for oviposition site selection in periodical cicadas (Magicicada spp.; Yang Citation2006), and the photoperiod was suggested to affect hatching rate in Cryptotympana atrata (Sun et al. Citation2011). Although a causal effect of temperature on the density of cicada populations has not yet been established, temperature is implicated in the induction and termination of diapause, and also affects embryonic development in cicadas (Moriyama & Numata Citation2008). Hatching is induced by high humidity, and is important to the survival of the first instar nymphs. This is because high humidity prevents desiccation and reduces the failure to dig successfully underground (Moriyama & Numata Citation2006).
The low predation pressure hypothesis predicts that low predator densities are directly related to high densities of cicadas. Birds are known to be one of the most dominant predators for cicadas (Sazima Citation2009). There is a spatial synchrony between avian predators and periodical cicadas in eastern North America, and the emergence of periodical cicadas has significant demographic effects on key avian predators, mostly during or immediately after emergences (Koenig & Liebhold Citation2005). Furthermore, avian species richness has been observed to decline in relation to a gradient of increasing urbanization, as measured by local- and landscape-level habitat features (Blair Citation1996; Melles et al. Citation2003). Thus, the low densities of avian species that prey on cicadas might explain high cicada densities.
The host availability hypothesis predicts that the density of a given cicada species is directly correlated with the availability of that species' host plant. Over 80% of all phytophagous hemipterans are monophagous or oligophagous, due to the high degree of tissue specialization in sucking roots (Bernays & Chapman Citation1994). In addition, the structure and shape of forests (Rodenhouse et al. Citation1997; Lin Citation2007) and the age of forests or trees (Clay et al. Citation2009; Yang & Karban Citation2009) affect the distribution and abundance of cicada species. Periodical cicadas in North America prefer to oviposit in some species of trees, such as Carya, Quercus, Ulmus, Acer, Cornus, and Fraxinus species, and do not prefer other tree species, such as Asimina triloba, Lindera benzoin, Robinia pseudoacacia, Rhus species, and conifers (Skeels Citation1907). Furthermore, preferences of tree species were different among three periodical cicada species (Williams & Smith Citation1991). Thus, the distribution of host plant species can affect the occurrence and dispersal of cicadas.
We estimated both resource-weighted and organism-weighted densities to determine the abundance of cicada species (Lewontin & Levins Citation1989; Begon et al. Citation2006). The resource-weighted density is the ratio of total population to total resource. However, the individuals are usually distributed unevenly in the resource, and the resource-weighted density may not reflect the density that typical individuals experience. Instead, in many cases, the resource consists of small patches within which individuals are uniformly distributed. The organism-weighted density is the summation of the patch density for every individual divided by total population (Lewontin & Levins Citation1989). In essence, the organism-weighted density measures the intensity that an individual has to share its patch with other individuals.
In this study, we investigated population densities of cicada species using enumeration of exuviae in three habitats in Korea: metropolitan, suburban, and country. If the host availability hypothesis is correct, the resource-weighted density of a cicada species should be high in habitats where available resource is abundant, whereas the organism-weighted density should be similar across habitats. The patch used to estimate organism-weighted density in this study was a tree. Thus, a difference in organism-weighted density between habitats may indicate that factors other than host availability may also contribute to densities of a species. We used percentage of trees without exuviae and percentage of the preferred trees as measures of resource for cicada juveniles.
Methods
Study species
A mated female cicada lays eggs by stabbing her ovipositor inside the branch of a tree. The eggs hatch in the summer next year. The first-stage instars fall from the branch to the ground and go into the ground. They feed on the sap of the tree's roots. Cicada larvae stay underground from 1 to 17 years, depending on species. The final-instar larvae make a tunnel to the surface and emerge from the ground. They climb the tree and molt on trunks, branches, or leaves.
There are 13 cicada species distributed on the Korean peninsula (Lee Citation2008). The morphology, life history, and distributions of all cicada species in Korea are well described (Lee Citation2005). In central Korean peninsula where this study was conducted, five species of the subfamily Cicadinae are typically found (Lee et al. Citation2012): Cryptotympana atrata Fabricius (Tribe Cryptotympanini), Hyalessa fuscata Distant (Tribe Sonatini), Graptopsaltria nigrofuscata Motschulsky (Tribe Polyneurini), Meimuna opalifera Walker (Tribe Cicadini), and Meimuna mongolica Distant (Tribe Cicadini). In this study, we combined M. opalifera and M. monoglica as Meimuna spp. for statistical analyses, because these two species were generally fewer than other species.
Sampling localities
Exuviae collection was conducted in three regions that differed in their degree of urbanization: metropolitan, suburban, and country. For the metropolitan habitat, we chose four localities in the city of Seoul, a city with a population of >10 million (). Seoul has limited forests, but has abundant high-rise buildings, roads, and residential complexes. The city of Gwacheon is a suburban, located south of Seoul. Because Gwacheon is surrounded by the Green Belt, a series of protected forests surrounding the capital region, development is restricted in the immediate vicinity. We chose four country localities in Gyeonggi Province surrounding Seoul: Yangpyeong, Pocheon, Gapyeong, and Yeoju. These country localities typically include large proportions of forested and agricultural areas. For replicates, we chose one to four sites within each locality for exuviae sampling. All sampling sites were located within a narrow latitudinal zone between 37°17′ and 37°54′ N.
Table 1. Sampling localities for the measurement of cicada density in this study.
To limit bias in sample site selection, with respect to cicada species, we predetermined the sampling sites using Google map, selecting urbanized areas where landscaping trees typically occur. A sampling site was a contiguous area in which landscaping trees were planted. The sampling units for statistical analyses were the area of one such predetermined site and the trees included in that site, regardless of occurrence of cicada exuviae.
Although we identified three habitat types for this study, landscape covers may be critical for cicada occurrence. Thus, to standardize the sampling localities across different habitat types, we restricted exuviae sampling to urbanized areas where landscaping trees were typically found, such as gardens of apartment complexes, schools, and parks. Thus, the immediate landscape surrounding sampling sites were quite similar across all three habitats. The standardization of landscapes surrounding samplings sites in all three localities were confirmed by the Geographic Information System (GIS) analysis. We analyzed the proportions of eight land cover types with radii of 100 m and 1000 m for each locality: city, road, agriculture, forest, grassland, wetland, wasteland, and water. GIS analysis was performed in ArcView™ (ESRI inc.; Redlands, CA, USA). The land cover data used in this analysis were from the Korean National Geographic Information Institute.
The GIS analysis with 100 m radius showed that urban area dominated the landscape in all three habitats (). Agricultural field and forest occupied more than 23.1% of landscape in the country. However, the result of MANOVA showed that none of the three habitats differed in types of land cover in the 100 m radius (Wilk's λ = 0.425; F16,30 = 1.001, P = 0.481). With the 1000 m radius, the three habitats differed markedly in types of land cover (). Urban area was still dominant in the metropolitan habitat, with 65.2% of the total area being urban. In the suburban and country habitats, although the urban area still made up the largest percentages, forest area became increasingly common. In the country habitat, agricultural field composed a large percentage of the landscape. Accordingly, the results of MANOVA showed that habitat was a significant factor for differences in types of land cover when examined with a 1000-m radius (Wilk's λ = 0.006; F 16,30 = 21.466, P < 0.001). Thus, the sampling sites were very similar in land covers across all three habitats within the radius of 100 m, but they were quite different when examined with a 1000 m radius.
Table 2. Percentages of land cover types for three habitats using the GIS analysis.
Cicada collection
To measure the density of cicadas, a complete enumeration of exuviae was conducted. In each sampling site, we collected all exuviae attached on the tree trunks or branches. We collected the exuviae three times at an interval of 11 days between consecutive samplings. The first time we collected exuviae was prior to sampling, wherein we gathered all exuviae at every site to ensure that exuviae collected at the first sampling had emerged within the 11 days following the pre-sampling. Similarly, our methodology dictated that the exuviae we picked up at the second sampling had emerged within the 11 days subsequent to the first sampling. The first sampling was conducted between 3 and 5 August 2010, and the second sampling between 14 and 16 August 2010.
We estimated resource-weighted density and organism-weighted density of cicada exuviae in all three habitats. In the resource-weighted density, both the area-weighted density, which was the number of cicada exuviae divided by the area of a site, and the tree-weighted density, which was the number of cicada exuviae divided by the number of trees in a site, were estimated. Area-weighted density may be relevant because the larvae of cicada spend their time underground until they become imago. Tree-weighted density may also be important, because cicadas use trees for egg-laying and foraging. The collected exuviae were sorted by the tree that the exuviae were attached to, and classified by sex and species (Lee et al. Citation2012). Furthermore, all trees in the sampling localities were recorded and identified to species. We estimated the organism-weighted density using the formula below:
Statistical analyses
We conducted the analysis of multivariate general linear model (GLM) to determine the factors critical for the distributions of cicada densities. Response variables of multivariate GLM were densities of H. fuscata, C. atrata, Meimuna spp. and G. nigrofuscata, whereas predictor variables were habitat, locality, site, and date. Habitat was metropolitan, suburban, or country. Locality was nested within habitat, and site was nested within locality. Date indicated one of two sampling periods. The multivariate GLM was conducted for both area-weighted and tree-weighted densities of cicada species. The total numbers of localities and sites were 10 and 25, respectively. However, the second sampling was not conducted for Pocheon, Gapyeong, and Yeoju in the country habitat. Thus, the sample sizes for area-weighted and tree-weighted densities were 38.
To determine tree species preferred by each cicada species, multiple linear regressions were employed for cicada species. The predictor variables were habitat and tree species that were found in all sampling localities. For three variables, organism-weighted density, percentage of trees without exuviae, and percentage of preferred trees, we conducted MANOVA to test whether these variables were different among the three habitats. Predictor variables of MANOVA were habitat and locality that was nested within habitat.
Results
Resource-weighted density
Across all cicada species, the area-weighted density was 104,624 km−2 for the suburban, 49,582 km−2 for the metropolitan, and 7853 km−2 for the country in the first sampling period (3 and 5 August 2010). During the second sampling period (14 and 16 August 2010), the area-weighted density was 24,872 km−2 for the suburban, 22,039 km−2 for the metropolitan, and 9743 km−2 for the country. Two cicada species, H. fuscata and C. atrata dominated in all three habitats (). These two species comprised at least 75.2% of all exuviae across all habitats and sampling periods were at least 97.0% in the metropolitan habitat. Both the area-weighted and tree-weighted densities were highest for H. fuscata, regardless of habitat and sampling period ( and ). The densities of C. atrata were the next highest in the metropolitan and suburban habitats. In the country, the densities of C. atrata were second highest in the first sampling period, but the densities of Meimuna spp. were second highest in the second sampling period.
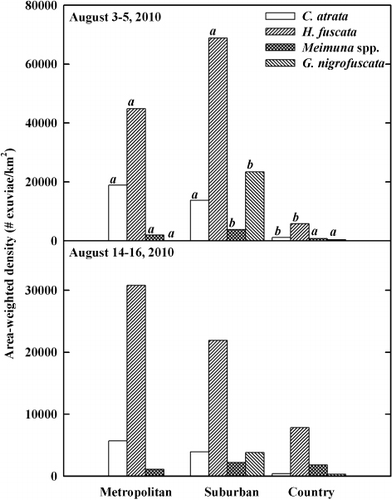
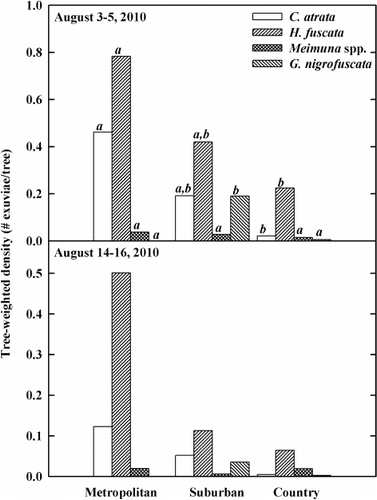
Table 3. The resource-weighted densities of cicada species for three habitat types.
The results of multivariate GLM showed that habitat (Wilks' λ = 0.239, F = 6.535, hypothesis df = 8, error df = 50, P < 0.001), locality (Wilks' λ = 0.443, F = 1.998, hypothesis df = 12, error df = 66.435, P = 0.038), and date (Wilks' λ = 0.504, F = 6.143, hypothesis df = 4, error df = 25, P = 0.001) were significant for the area-weighted density, whereas site (Wilks' λ = 0.540, F = 1.454, hypothesis df = 12, error df = 66.435, P = 0.165) was not significant. The results of univariate GLM determined that habitat was a significant factor for all species (). The post hoc analyses showed that the area-weighted densities for C. atrata and H. fuscata in both metropolitan and suburban habitat were significantly different from those in the country (). The densities of C. atrata were at least 9.5 times higher in the metropolitan and suburban habitats than in the country habitat for both sampling periods. Likewise, the area-weighted densities for H. fuscata were at least 2.8 times higher in the metropolitan and suburban habitats than in the country habitat in both sampling periods. The area-weighted densities for Meimuna spp. and G. nigrofuscata in the suburban habitat were significantly higher than those in the metropolitan and country habitats (). Compared to the first sampling period, the area-weighted densities of C. atrata and H. fuscata during the second sampling period had decreased by 24% and 42.5%, respectively. In the country habitat, however, the area-weighted densities of H. fuscata and Meimuna spp. had increased by 135% and 248%, respectively, during the second sampling period.
Table 4. The results of univariate GLM on area-weighted densities of cicada species.
Table 5. Post hoc comparisons of cicada densities among three habitat types.
In multivariate GLM for the tree-weighted densities, habitat (Wilks' λ = 0.309, F = 4.990, hypothesis df = 8, error df = 50, P < 0.001) was significant, whereas date (Wilks' λ = 0.711, F = 2.539, hypothesis df = 4, error df = 25, P = 0.065), locality (Wilks' λ = 0.468, F = 1.842, hypothesis df = 12, error df = 66.435, P = 0.059) and site (Wilks' λ = 0.574, F = 1.294, hypothesis df = 12, error df = 66.435, P = 0.243) were not. The results of univariate GLM showed that habitat was a significant factor for densities of all species as well (). The tree-weighted densities for C. atrata and H. fuscata were significantly higher in the metropolitan habitat than in the country habitat (). The tree-weighted densities for G. nigrofuscata were significantly higher in the suburban habitat than in the metropolitan and country habitats. The trends of both area-weighted and tree-weighted densities were similar to each other for all cicada species.
Table 6. The results of univariate GLM on tree-weighted densities of cicada species.
Organism-weighted density
The results of the multivariate analysis of variance (MANOVA) showed that habitat was significant for variation in organism-weighted densities for C. atrata and G. nigrofuscata, but was not significant for H. fuscata and Meimuna spp. (). Site was not significant for organism-weighted densities of any cicada species. In C. atrata and G. nigrofuscata, organism-weighted density was higher in a habitat where resource-weighted density was high. Although habitat was not significant, organism-weighted densities of H. fuscata were generally higher in the metropolitan and suburban habitats than they were in the country habitat.
Table 7. Organism-weighted density (A), percentage of trees without exuviae (B), and percentage of preferred trees (C) for three habitats: metropolitan, suburban, and country.
Testing the host availability hypothesis
The percentages of trees without C. atrata exuviae were significantly lower in the metropolitan and suburban habitats than in the country habitat (). Although the percentages of trees without exuviae for H. fuscata were generally lower in the metropolitan and suburban habitats than in the country, this result was not significant. In G. nigrofuscata, the percentages of trees without exuviae were significantly lower in the suburban habitat than in the metropolitan and country habitats. In general, cicada juveniles of C. atrata and H. fuscata did not use larger proportions of available trees in the country. Population densities of C. atrata and G. nigrofuscata were high in habitats, where percentages of trees without exuviae were low, generally consistent with the prediction of the host availability hypothesis.
The results of multiple linear regressions showed that tree preferences for exuviae occurrence were generally different for each cicada species. Based on exuviae collected on trees, Zelkova serrata, Magnolia kobus, Alnus firma, Rhododendron schlippenbachii, Buxus koreana were significant for occurrence of C. atrata exuviae, whereas M. kobus, Prunus serrulata, A. firma, Ginkgo biloba were significant for occurrence of H. fuscata exuviae. Although exuviae of Meimuna spp were found in a wide range of tree species, Ulmus davidiana was the most preferred species. Finally, the preferred tree species for exuviae of G. nigrofuscata were Metasequoia glyptostroboides, M. kobus, and R. schlippenbachii ().
Table 8. Results of multiple linear regressions for the exuviae occurrence in cicada species.
We hypothesized that the resource-weighted density for a cicada species was directly correlated with the percentage of preferred trees in a habitat, which was the number of preferred trees divided by the total number of trees in a locality. Preferred tree species were derived from the analyses of multiple linear regressions (). The results of univariate ANOVA showed that percentages of preferred trees were not significantly different among the three habitat types for C. atrata and H. fuscata, but were significantly different among the three habitat types for Meimuna spp and G. nigrofuscata (). Although resource-weighted densities of C. atrata and H. fuscata in the metropolitan and suburban habitats were sometimes an order of magnitude higher than those in the country habitat, percentages of preferred trees for these two species were quite similar among the three habitats. The percentage of preferred host species for Meimuna spp. was highest in the metropolitan habitat. However, the area-weighted density of Meimuna spp. was highest in the suburban habitat, while the tree-weighted density was highest in the metropolitan. In G. nigrofuscata, percentages of preferred trees were highest in the suburban habitat where the resource-weighted densities were highest.
Discussion
Parts of our results regarding percentages of trees without exuviae and preferred plants seemed to support the host availability hypothesis in C. atrata, Meimuna spp. and G. nigrofuscata. The cicada's distribution among trees is largely determined by the oviposition of female cicadas in the previous generation (Yang & Karban Citation2009). Cicadas may select hosts based on structural characteristics of branches, such as bark thickness or wood toughness (White Citation1980). Female cicadas prefer to oviposit on young branches of trees in sunny areas (Marlatt Citation1907; Lloyd & White Citation1976; Yang Citation2006). Alternatively, cicadas may choose trees for reasons unrelated to offspring success, such as a preference for their natal tree species (Barron Citation2001) or to maximize their egg-laying success rather than offspring fitness (Scheirs et al. Citation2004). There are some tree species that cicadas avoid to oviposit. For example, the coniferous species were generally avoided, because coniferous species' sap production makes it hard to spawn eggs in the branches (White et al. Citation1982). Rhus species, which belong to the Anacardiaceae family that typically produce sap with a vesicant or blistering effect, is also less preferred (Simpson Citation2006). Juglans nigra and Sassafras albidum produce defensive compounds to cicada oviposition (Clay et al. Citation2009). Because of oviposition site preference, the availability of host plant species may be closely related to the density of cicada species.
Based on analyses of the enumeration survey of cicada exuviae, there was no clear relationship between host availability and resource-weighted density and between organism-weighted and resource-weighted densities in H. fuscata. However, organism-weighted densities tended to be higher in the metropolitan and suburban habitats than in the country. Furthermore, H. fuscata exuviae were found in more trees in the metropolitan and suburban habitats than in the country, albeit the difference was not significant. Close examination revealed a tremendous variation of organism-weighted density even within a locality in H. fuscata, suggesting that conditions for aggregation may be local, rather than habitat-wide. Studies investigating site-specific conditions for population density may be required in this species.
In C. atrata and G. nigrofuscata, organism-weighted densities were high in habitats where resource-weighted densities were high. That is, the intensity of competition was significantly different among habitats in these species. The coincident relationship suggests that host availability is not the only factor underlying the patterns of population density in these species. In the case of C. atrata, temperature might be the key factor for its abundance. For example, in Japan, C. facialis, which is in the same genus as C. atrata and possibly shares similar ecological preferences with that species, the ideal temperature of post-diapause morphogenesis is 3–5°C higher than it is for G. nigrofuscata (Moriyama & Numata Citation2008). The mean annual temperature of the Seoul metropolitan area is a few degrees higher than the surrounding countryside (Kim & Baik Citation2002, Citation2004). This is known as the urban heat island (UHI) phenomenon, which, due to human disturbance, makes cities significantly warmer than the surrounding area (Oke Citation1988). The metropolitan localities in this study are one of the most urbanized areas in Seoul, and are especially subjected to the UHI effect (Sugawara et al. Citation2005). If higher temperatures are beneficial for development of C. atrata, the density of C. atrata may increase in the metropolitan or suburban areas, rather than in the country areas, because of the UHI.
Although the metropolitan and suburban localities were in close geographic proximity, the densities of G. nigrofuscata were starkly different across these two habitats. The density of this species was highest in the suburban localities, and absent in the metropolitan habitat. The distribution of G. nigrofuscata may be constrained by access to forested areas (Lee Citation2005). Relatively high percentages of forested areas in the suburban localities may provide a necessary habitat resource for G. nigrofuscata. Alternatively, the high density of G. nigrofuscata in the suburban region might be related to avian predation (Takakura & Yamazaki Citation2007). In a comparison between the metropolitan and suburban habitats in a Japanese city, G. nigrofuscata was subject to extremely high predation pressure in the metropolitan habitat, whereas C. facialis, a species of the same genus as C. atrata in our study, predation pressure was constant across all measured habitats (Takakura & Yamazaki Citation2007). In the metropolitan habitat, the viable habitats were fragmented, and predation pressure was highest at the habitat edge. Thus, predation pressure and habitat fragmentation might be a key determinant for the distribution of G. nigrofuscata.
The cicada densities in the suburban habitat may also be influenced by the edge effect, which is the change of the community and population structure at an area where two habitat types meet. Mingling between the biotas of each habitat results in increased biodiversity at the interface (Gundersen Citation1977). In one suburban area of Southern Indiana, for example, Magicicada septendecula, a cicada species that is common in the suburbs appears together with two species, Magicicada cassini and Magicicada septendecim that are dominant in other habitats (Clay et al. Citation2009). The suburban habitat in our study included both urban landscape and a significant portion of forested area. The cicada densities were high in this habitat due to C. atrata and H. fuscata, which were abundant mostly in the urban habitats, and G. nigrofuscata, which occurred in the forested area.
The results of our enumeration survey showed that conditions for cicada nymphal development may be quite different between urban and country habitats in our study. Densities of all cicada species dropped from the first to the second sampling periods in the metropolitan and suburban habitats in our study. However, densities of H. fuscata, Meimuna spp., and G. nigrofuscata increased from the first to the second sampling periods in the country habitat. One possible explanation is that cicadas develop faster in the urban environment, possibly due to UHI. If this is true, the UHI effect may lead to increased population densities of cicada species in urban habitats.
We tested the host availability hypothesis to explain the densities of cicada species, in part because they appear to be increasing in urban environments. If the host availability is the sole reason for the densities of cicada species, resource-weighted density should be proportional to the availability of host plants, and organism-weighted density should be similar across habitats. Some results supported the host availability hypothesis. For example, in C. atrata and G. nigrofuscata, percentages of trees without exuviae were low in the habitats where cicada densities were high. Likewise, percentages of the preferred trees of Meimuna spp. and G. nigrofuscata were significantly higher in habitats where overall cicada densities were high. However, resource-weighted and organism-weighted densities were quite similar in C. atrata and G. nigrofuscata, conflicting with the predictions of the host availability hypothesis, suggesting that other factors may also influence the pattern of population densities, speculatively abiotic factors and predator densities.
Acknowledgments
We are indebted to Sunghee Kim, Jaeho Woo, and So Young Won for field assistance. Yongjun Jang provided invaluable advice during the formation of this project. We are also grateful to Myron Shekelle for critical comments. This work was supported financially by the National Research Foundation of Korea (NRF) grant [2012R1A2A2A01046977] and by Ewha Global Top 5 Project to YJ.
References
- Barron AB. 2001. The life and death of Hopkins' host-selection principle. J Insect Behav. 14:725–737. 10.1023/A:1013033332535
- Begon M, Townsend CR, Harper JL. 2006. Ecology. 4th ed. Malden (MA): Blackwell.
- Bernays EA, Chapman RF. 1994. Host-plant selection by phytophagous insects. New York: Springer.
- Blair RB. 1996. Land use and avian species diversity along an urban gradient. Ecol Appl. 6:506–519. 10.2307/2269387
- Clay K, Shelton AL, Winkle C. 2009. Differential susceptibility of tree species to oviposition by periodical cicadas. Ecol Entomol. 34:277–286. 10.1111/j.1365-2311.2008.01071.x
- Gundersen HJG. 1977. Notes on the estimation of the numerical density of arbitrary profiles: the edge effect. J Microsc. 111:219–223. 10.1111/j.1365-2818.1977.tb00062.x
- Kim Y-H, Baik J-J. 2002. Maximum urban heat island intensity in Seoul. J Appl Meteor. 41:651–659. 10.1175/1520-0450(2002)041%3C0651:MUHIII%3E2.0.CO;2
- Kim Y-H, Baik J-J. 2004. Daily maximum urban heat island intensity in large cities of Korea. Theor Appl Climatol. 79:151–164. 10.1007/s00704-004-0070-7
- Koenig WD, Liebhold AM. 2005. Effects of periodical cicada emergences on abundance and synchrony of avian populations. Ecology. 86:1873–1882. 10.1890/04-1175
- Lee HY, Oh SY, Jang Y. 2012. Morphometrics of the final instar exuviae of five cicada species occurring in urban areas of central Korea. J Asia Pac Entomol. 15:627–630. 10.1016/j.aspen.2012.07.004
- Lee YJ. 2005. Cicada of Korea Seoul. Korea: Geobook.
- Lee YJ. 2008. Revised synonymic list of Cicadidae (Insecta: Hemiptera) from the Korean Peninsula, with the description of a new species and some taxonomic remarks. Proc Biol Soc Wash. 121:445–467. 10.2988/08-09.1
- Lewontin RC, Levins R. 1989. On the characterization of density and resource availability. Am Nat. 134:513–524. 10.1086/284994
- Lin YH. 2007. Community composition and the pattern of resource uses in sympatric cicada assemblages [thesis]. Tainan: National Cheng Kung University.
- Lloyd M, White JA. 1976. On the oviposition habits of 13-year versus 17-year periodical cicadas of the same species. J New York Entomol Soc. 84:148–155.
- Marlatt CL. 1907. The periodical cicada. USDA Bureau Entomol Bull. 71:1–181.
- Melles S, Glenn S, Martin K. 2003. Urban bird diversity and landscape complexity: species-environment associations along a multiscale habitat gradient. Conserv Ecol.7:5.
- Moriyama M, Numata H. 2006. Induction of egg hatching by high humidity in the cicada Cryptotympana facialis. J Insect Physiol. 52:1219–1225.
- Moriyama M, Numata H. 2008. Diapause and prolonged development in the embryo and their ecological significance in two cicadas, Cryptotympana facialis and Graptopsaltria nigrofuscata. J Insect Physiol. 54:1487–1494.
- Oke TR. 1988. Boundary layer climates. 2nd ed. London: Routledge.
- Rodenhouse NL, Bohlen PJ, Barrett GW. 1997. Effects of woodland shape on the spatial distribution and density of 17-year periodical cicadas (Homoptera: Cicadidae). Am Midl Nat. 137:124–135.
- Sazima I. 2009. Insect cornucopia: various bird types prey on the season's first giant cicadas in an urban park in southeastern Brazil. Biota Neotropica. 9:259–262.
- Scheirs J, Zoebisch TG, Schuster DJ, De Bruyn L. 2004. Optimal foraging shapes host preference of a polyphagous leafminer. Ecol Entomol. 29:375–379.
- Simpson MG. 2006. Plant systematics. Oxford: Elsevier Academic Press.
- Skeels HC. 1907. Trees injured by the seventeen-year cicada. Am Bot. 12:9–17.
- Sugawara H, Ji DW, Tomine K. 2005. Re-examination of city air temperature in heat island intensity evaluation-case study in Seoul Korea. Tenki. 52:119–128.
- Sun H-Z, Song Y-Q, Dong J-F, Jiu M. 2011. Study on effects of different factors to eggs hatching rate of Cryptotympana atrata by orthogonal design. Agr Sci Technol. 12:551–553.
- Takakura KI, Yamazaki K. 2007. Cover dependence of predation avoidance alters the effect of habitat fragmentation on two cicadas (Hemiptera: Cicadidae). Ann Entomol Soc Am. 100:729–735.
- White JA. 1980. Resource partitioning by ovipositing cicadas. Am Nat. 115:1–28.
- White JA, Lloyd M, Karban R. 1982. Why don't periodical cicadas normally live in coniferous forests? Environ Entomol. 11:475–482.
- Williams KS, Smith KG. 1991. Dynamics of periodical cicada chorus centers (Homoptera: Cicadidae: Magicicada). J Insect Behav. 4:275–291.
- Yang LH. 2006. Periodical cicadas use light for oviposition site selection. Proc Roy Soc B. 273:2993–3000.
- Yang LH, Karban R. 2009. Long-term habitat selection and chronic root herbivory: explaining the relationship between periodical cicada density and tree growth. Am Nat. 173:105–112.