
Abstract
The present study compared the cellular properties based on cell surface differentiation markers, telomerase activity, stem cell-specific transcripts and differentiation capacity into adipocytes, osteocytes and neurocytes in multipotent mesenchymal stem cells (MSCs) isolated from bone marrow (BMSCs), adipose (ASCs), ovarian (OSCs), muscle (MuSCs) and skin (SSCs) tissues of the same donor mini-pig. Using flow cytometry, all isolated MSCs expressed stem cell-positive surface markers CD29, CD44 and Vimentin, at a high level. Using reverse transcription-polymerase chain reaction, BMSCs, ASCs and SSCs showed higher expression of stem cell-specific transcripts (NANOG, OCT-4 and SOX-2) as compared to OSCs and MuSCs. Telomerase activity was detected by relative-quantitative telomerase repeats amplification protocol at a similar level in all MSCs. Further, analysis of cytochemical staining and lineage-specific transcripts demonstrated that all MSCs get easily differentiated into adipocytes, except for OSCs, whereas, BMSCs and MuSCs easily differentiated into osteocytes, compared to ASCs, OSCs and SSCs. Furthermore, all MSC groups showed the same level of capacity for neurocytes differentiation. Based on these results, the cellular properties were dominantly expressed in BMSCs, ASCs and SSCs, whereas the differentiation capacity was dominantly expressed in BMSCs and MuSCs, compared to others MSCs. Taken together, BMSCs could potentially be used as a good source of MSCs for clinical application and fundamental stem cell research.
Introduction
Adult stem cells, particularly multipotent mesenchymal stem cells (MSCs) that are derived from the mesoderm tissues have been found in almost every tissue of the body and MSCs have been isolated from diverse tissues of bone marrow, adipose, skin, dental pulp and others in humans and pigs (Rojewski et al. Citation2008; Jeon et al. Citation2011a; Song et al. Citation2011; Lee et al. Citation2013). Further, MSCs generally exhibit two basic cellular properties of self-renewality to produce more stem cells and multilineage differentiation ability, which have been demonstrated in isolated MSCs (Jeon et al. Citation2011a; Song et al. Citation2011; Lee et al. Citation2013). The MSCs with multipotent capacity are the most commonly used cells in regenerative medicine for clinical application of various diseases including cancer, heart disorders, auto-immune diseases, bone/cartilage defects, graft versus host diseases and many others (Sensebé et al. Citation2010; Wang et al. Citation2011). Even though MSCs derived from various tissues have been successfully isolated and characterized, a recent report has been emphasized to show that cellular properties and differentiation capacity are different among various MSCs, depending on the tissue source and the age of the donor (Dominici et al. Citation2006; Wegmeyer et al. Citation2013). However, yet so far, the cellular properties and differentiation capacity have not been fully investigated among MSCs derived from various tissues of the same donor. Moreover intrinsic investigations on the cellular characterizations of the MSCs are foremost required for their use in clinical applications and understanding the fundamental mechanisms of stem cells.
One of the minimal criteria to define MSCs in humans is CD (cluster of differentiation) markers that are used for the identification and investigation of cell surface proteins, which often act as receptors, ligands or cell signaling (Dominici et al. Citation2006). Previous reports have demonstrated that CD29 (integrin beta-1), CD44 (cell-surface glycoprotein for cell interactions), CD105 (endoglin) and Vimentin (type III intermediate filament protein) are highly expressed in undifferentiated MSCs derived from various tissues, whereas CD44 (hematopoietic progenitor cell antigen), CD45 (leukocyte common antigen), cytokeratin and MHC II are expressed in the cells of differentiated hematopoietic lineage (Rojewski et al. Citation2008; Song et al. Citation2011; Corselli et al. Citation2013), and their expression has been successfully applied for the identification of the isolated MSCs (Jeon et al. Citation2011a; Song et al. Citation2011; Lee et al. Citation2013). Stem cell-specific genes, early transcription factors such as NONOG, OCT-4 and SOX-2, are expressed in undifferentiated stem cells at a high level (Rodda et al. Citation2005; Kashyap et al. Citation2009). Transcription factors are thought to be the main factors for maintaining multipotency and self-renewality capacity and their positive expressions are considered as markers of stem cells (Reddel et al. Citation2001; Chambers et al. Citation2003; Song et al. Citation2011). Further, it has been shown that multipotency and self-renewality capacity of stem cells are tightly associated with length of telomere repeats that exist at each end of a linear chromatid for protecting the linear DNA and maintains genomic integrity (Hiyama & Hiyama Citation2007; Artandi & DePinho Citation2010; Jeon et al. Citation2011c). The cells with the telomeric repeats nearly consumed by multiple cell division leads to programmed cellular senescence and subsequently apoptotic cell death (Artandi & DePinho Citation2010; Jeon et al. Citation2011c). Moreover up-regulated telomerase activity plays an essential role for self-renewality capacity and prolonged cell proliferation, resulting in the maintenance of telomeric repeats (Artandi & DePinho Citation2010; Jeon et al. Citation2011c). Therefore, the up-regulated telomerase activity is also used as a marker to characterize stem cells (Serakinci et al. Citation2008; Jeon et al. Citation2011a, Citation2011c).
The cellular characterization including CD marker profiles, expression of transcription factors, multilineage differentiation capacity and therapeutic potential for clinical applications are some of the defined criteria for comparing stem cells derived from different sources. After in vitro induction with specific media, MSCs have been shown to differentiate into mesodermal phenotypes such as osteocytes, adipocytes and chondrocytes (Dominici et al. Citation2006). Moreover, recent studies have demonstrated that MSCs can be induced into neurogenic, cardio myogenic, or epithelial and endothelial cells, implying that their cells can be differentiated to tissues and cells of non-mesodermal origin, such as endodermal and ectodermal lineage, known as cellular plasticity (Yan et al. Citation2007; Kumar et al. Citation2012).
Furthermore, to prove the opinion that each of the MSCs from various tissues probably exhibits the different stem cell properties, we have isolated the MSCs originated from bone marrow, adipose, ovarian, muscle and skin tissue of the same mini-pig donor. We subsequently investigated and compared each MSC for the expression of CD surface markers (positive makers; CD29, CD44 and Vimentin, and negative markers; CD34 and 45) by flow cytometry, expression of stem cell-specific transcripts (NONOG OCT-4 and SOX-2) by reverse transcription-polymerase chain reaction (RT-PCR), level of telomerase activity by relative-quantitative telomerase repeats amplification protocol (RQ-TRAP) and their differentiation capacity into adipocytes, osteocytes and neurocytes. The investigations of the biological properties considered as general markers of stem cells and each of MSCs should contribute to understanding the biological similarities or differences for the clinical applications in regenerative medicine as well as fundamental stem cell research.
Materials and methods
Isolation and culture of each MSC
All chemicals used in this study were purchased from Sigma Chemical Company (USA) and media from Gibco (Invitrogen, USA), unless otherwise specified. All experiments were authorized by the Animal Center for Biomedical Experimentation at Gyeongsang National University. Cells were surgically collected from bone marrow of the hind limb, adipose tissue of subcutaneous abdominal, ovarian cortical tissue, epidermis and dermis of the skin and semitendinosus muscle tissue of the hind limb in three six-month-old female mini-pigs, respectively, as described previously (Wilschut et al. Citation2008; Song et al. Citation2011; Kumar et al. Citation2012). Briefly, all isolated cells were cultured in Advanced Dulbecco's Modified Eagle Medium (A-DMEM) supplemented with 10% fetal bovine serum (FBS) and 1.0% penicillin-streptomycin (10,000 IU and 10,000 μg/ml, respectively) at 37.5°C in a humidified atmosphere of 5% CO2 in air. At approximately 70–80% confluence (passage 0), cells were dissociated using 0.1% (w/v) trypsin-ethylenediaminetetraacetic acid (EDTA) solution and made into pellets at 300 × g for 5 min, followed by sub-culturing up to passage 5 with change of media twice a week for further analysis.
Cell surface marker profile by flow cytometry
Isolated MSCs were characterized for the presence of mesenchymal positive markers (CD29, CD44, CD90 and Vimentin; Santa Cruz biotechnology, USA) and negative markers (CD34 and CD45; Santa Cruz biotechnology, USA) using fluorescence-activated cell sorting with a flow cytometer (BD FACS Calibur, USA) before performing further experiments. Cells at ∼80% confluence were collected by treating with 0.25% (w/v) trypsin-EDTA and fixed with 3.7% formaldehyde for 30 min. Subsequently, cells were incubated with a fluorescein isothiocyanate (FITC)-conjugated primary antibodies on ice for 1 h. Cells were then analyzed with a flow cytometer with CellQuest software (Becton Dickinson, USA). At least 1 × 10⁵ cells were analyzed for each experiment. The standard was established by isotype-matched control.
Analysis of transcripts' expression by RT-PCR
To analyze the expression level of stem cell-specific and lineage-specific transcripts, total RNA was extracted using the QIA shredder column and RNeasy Micro Kit (Qiagen, USA). Homogenization, isolation, precipitation and purification of RNA were performed according to the manufacturer's procedures with an extra step of DNase I treatment for the removal of DNA contamination. The concentration of total RNA was determined by a spectrophotometer (Mecasys, Korea). A total of 1 µg RNA was converted to the first-strand cDNA with an Omniscript RT Kit (Qiagen, USA) according to the manufacturer's instructions. A total of three reverse transcription reactions were used for each RNA sample. The PCR amplification was carried out in a thermal cycler (TaKaRa, Japan) using Maxime-PCR PreMix Kit (iNtRON Biotechnology, Korea) in 30 cycles. The PCR products were fractionated by 1% agarose gel electrophoresis. In each of the cDNA samples, at least three replicates of PCRs were carried out. The relative quantification of transcripts was calculated to ratio based on the level of GAPDH (D-glyceraldehyde-3-phosphate dehydrogenase) in each cDNA sample using a Gel viewer image-processing software (Innogene, Korea). Primer sequences, the size of amplified products and annealing temperatures for Homeobox protein NANOG, OCT-4 (octamer-binding transcription factor 4), SOX-2 (sex determining region Y-box 2), PPAR-γ2 (peroxisome proliferator-activated receptor gamma 2), aP2 (adipocyte protein 2), ON (osteonectin), OC (osteocalcin), nestin and NF-M (nuerofilament0-M) are previously described (Kumar et al. Citation2012; Lee et al. Citation2013).
In vitro differentiation into adipocytes, osteocytes and neurocytes
To evaluate the differentiation capacity of same donor MSCs derived from different sources, cells were induced into mesodermal adipocytes and osteocytes by culturing at a density of 1 × 10³ cell/cm2 in A-DMEM supplemented with 10% FBS following previously published protocols (Kumar et al. Citation2012). Following differentiation induction for four weeks, adipocytes and osteocytes were detected by using Oil red O and 5% sliver nitrate (von Kossa) staining methods, respectively, and the expression levels of aP2 and PPARγ2 for adipogenic differentiation and ON and OC for osteogenic differentiation were analyzed by RT-PCR. Further, MSCs were induced into neuronal differentiation of ectodermal lineage, according to previously described protocols (Chao et al. Citation2007; Kumar et al. Citation2012). Following differentiation induction into neurocytes for 10 days, expression of neuronal-specific markers, nestin, NF-M and NGF (nerve growth factor), were analyzed with immunofluorescence staining. Briefly, differentiated neurocytes were fixed in 3.7% paraformaldehyde overnight and permeabilized by 0.2% Triton X-100 for 30 min. Cells were incubated in the nestin (BD Pharmigen, goat polyclonal IgG, USA, 1:100), NF-M (Santa Cruz Biotechnology; goat polyclonal IgG, USA, 1:100) and NGF (Santa Cruz Biotechnology, rabbit polyclonal IgG, USA, 1:100). After being washed with PBS, cells were subsequently incubated with FITC-conjugated secondary antibodies (donkey anti-goat and anti-rabbit IgG, Jackson Immunoresearch, USA, 1:200) for 1 h. The nucleus was counterstained with 1 μg/ml 4′,6-diamidino-2-phenylindole (DAPI) for 5 min at room temperature and the slides were mounted with Vectashield (Vector Laboratories, USA). Images were acquired under a fluorescence microscope (Leica CTR600, Switzerland).
Analysis of telomerase activity by RQ-TRAP
RQ-TRAP assay was carried out by a conventional TRAP assay for its use on the LightCycler 3.0 (Roche, USA) as previously described (Betts et al. Citation2006; Jeon et al. Citation2011c). Briefly, cells were lysed in 3-[(3-cholamidopropyl) dimethylammonio]-1-propanesulfonate (CHAPS) lysis buffer. After measuring the protein concentration using a spectrophotometer (Mecasys, Korea), 5 µg of total protein was analyzed by RQ-TRAP assay. RQ-TRAP was optimized using the PCR reagent LightCycler FastStart DNA Master SYBR Green 1 (Roche, USA) according to the manufacturer's protocols. All samples were quantified using the LightCycler Quantification Software's (Roche, USA) and the level of telomerase activity was calculated as a ratio based on the level of telomerase activity in 293T telomerase positive cells.
Statistical analysis
One-way analysis of variance was employed to analyze the differences (SPSS 15.0, Chicago, IL, USA) and the data were expressed as mean ± SEM. Comparisons of mean values were analyzed using a Tukey's multiple comparisons test. The level of significance was tested when P < .05.
Results
Analysis of cell surface markers in MSCs
Expression of cell surface markers was analyzed in MSCs isolated from bone marrow (BMSCs), adipose (ASCs), ovarian (OSCs), muscle (MuSCs) and skin (SSCs) skin (SSCs) tissues of the same donor mini-pig by fluorescence-activated cell sorting method using flow cytometry, as shown in . Expression of CD29, CD44 and vimentin in each MSC was detected at a high level (∼over 90%), whereas the expression of CD34 and CD45 was detected at a low level (∼10%), respectively. The expression level of each of the cell surface markers did not differ among BMSCs, ASCs, OSCs, MuSCs and SSCs.
Figure 1. Expression (%, mean ± SEM) of cell surface markers analyzed by flow cytometer in mini-pig BMSCs, ASCs, OSCs, MuSCs and SSCs, respectively. Expression of CD29, CD44 and Vimentin was positive, whereas that for CD34 and CD45 was negative in all examined MSCs, despite their different origins. A representative example of three samples is shown.
Expression of stem cell-specific transcripts in MSCs
Stem cell-specific transcripts (NANOG, SOX-2 and OCT-4) were analyzed by RT-PCR in BMSCs, ASCs, OSCs, MuSCs and SSCs, as shown in . Expression of NANOG was significantly (P < .05) higher in BMSCs and ASCs than those of OSCs, MuSCs and SSCs. Significantly (P < .05) higher expression of OCT4 was particularly observed in BMSCs followed by ASCs among all MSCs. Further, expression of SOX-2 was detected at significantly (P < .05) higher levels in BMSCs and SSCs than those of ASCs, OSCs and MuSCs. As a whole, expression of stem cell-specific transcripts was highly observed in BMSCs than those of ASCs, OSCs, MuSCs and SSCs.
Figure 2. Expression of stem cell-specific transcripts, NANOG, OCT-4 and SOX-2, analyzed by RT-PCR in mini-pig BMSCs, ASCs, OSCs, MuSCs and SSCs, respectively. Values indicated the mean transcript levels (mean ± SEM) of three replicates and were calculated as the ratio based on the level of GAPDH. A, B, C and D indicate significant (P < .05) difference on NANOG transcript among MSCs, respectively. *, ** and *** indicate significant (P < .05) difference on OCT-4 transcript among MSCs, respectively. a, b, c and d indicate significant (P < .05) difference on SOX-2 transcript among MSCs, respectively.
Analysis of telomerase activity in MSCs
Level of telomerase activity analyzed by RQ-TRAP in BMSCs, ASCs, OSCs, MuSCs and SSCs was described in . Level of telomerase activity in 293T telomerase-positive cells was considered as 100% for comparison with other MSCs lines. Telomerase activity in BMSCs, ASCs, OSCs, MuSCs and SSCs was 15.1 ± 6.55%, 17.9 ± 3.45%, 13.8 ± 5.23%, 14.9 ± 7.56% and 16.8 ± 9.12%, respectively. No significant (P < .05) differences were observed among MSCs for telomerase activity, but its expression level was very low, indicating that the levels were below ∼20% when compared to that of 293T telomerase-positive cells.
Figure 3. Telomerase activity by RQ-TRAP assay in mini-pig BMSCs, ASCs, OSCs, MuSCs and SSCs, respectively. Values indicated the mean telomease activity of five replicates (mean ± SEM) and telomerase activity in 293T telomerase positive cells was considered as 100% for comparison with other MSC lines.
In vitro differentiation of MSCs into adipocytes
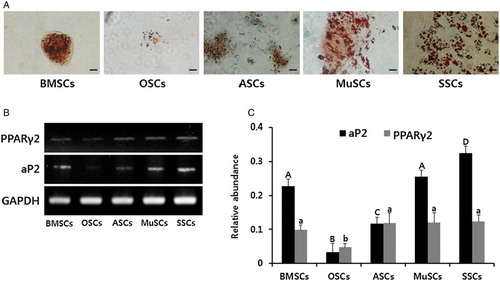
Under specific conditions, BMSCs, ASCs, OSCs, MuSCs and SSCs were evaluated for their ability to undergo adipocyte differentiation of mesodermal lineage. After four weeks of induction, adipocytes were analyzed by Oil red O staining for the accumulation of neutral lipids and RT-PCR for quantitative levels of adipocyte-specific transcripts in BMSCs, ASCs, OSCs, MuSCs and SSCs, respectively (). Accumulation of lipids by Oil red O staining was observed in all MSC lines, but the intensity of staining in BMSCs, MuSCs, ASCs and SSCs was higher than in OSCs ((A)). Further, adipocyte-specific transcripts (aP2 and PPARγ2) were also significantly (P < .05) higher in BMSCs, MuSCs, ASCs and SSCs than in OSCs.
Figure 4. In vitro differentiation ability into adipocytes and the expression of lineage specific genes in mini-pig BMSCs, ASCs, OSCs, MuSCs and SSCs, respectively. (A) Each cell line was induced into adipogenic lineages for four weeks and intracellular accumulation of neutral lipids was stained by Oil red O solution. Scale bars, 50 µm. (B) Adipogenic differentiation was evidenced by the expression of aP2 and PPARγ2 by RT-PCR. (C) Values indicated the mean transcript levels (mean ± SEM) of three replicates and calculated to ratio based on the level of GAPDH, an internal control gene. A, B, C and D indicate significant (P < .05) difference on aP2 transcript among MSCs, respectively. a, and b indicate significant (P < .05) difference on PPARγ transcript MSCs, respectively.
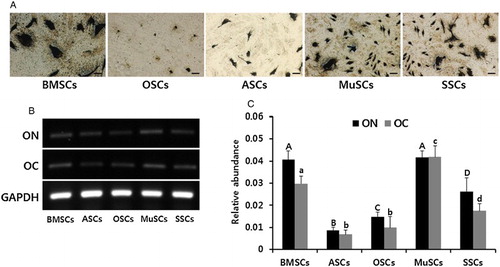
In vitro differentiation of MSCs into osteocytes
Following differentiation induction into osteocytes of mesodermal lineage under specific conditions, formation of a mineralized matrix was evaluated by silver nitrate (von Kossa) staining and quantitative levels of osteocyte-specific transcripts in BMSCs, ASCs, OSCs, MuSCs and SSCs were assessed by RT-PCR (). Similar to adipocyte differentiation, accumulation of lipids by sliver nitrate staining was observed in all types of MSCs, but the intensity of staining in BMSCs, MuSCs and SSCs was higher than in ASC and OSCs ((A)). Osteocyte-specific transcripts (ON and OC) were also significantly (P < .05) higher in BMSCs, MuSCs and SSCs than in OSCs and ASCs
Figure 5. In vitro differentiation ability into osteocytes and the expression of lineage-specific genes in mini-pig BMSCs, ASCs, OSCs, MuSCs and SSCs, respectively. (A) Each cell line was induced into adipogenic lineages for four weeks and intracellular accumulation of mineralization was stained by silver nitrate solution. Scale bars, 50 µm. (B) Adipogenic differentiation was evidenced by the expression of ON and OC by RT-PCR. (C) Values indicated the mean transcript levels (mean ± SEM) of three replicates and calculated to ratio based on the level of GAPDH, an internal control gene. A, B, C and D indicate significant (P < .05) difference on ON transcript among MSCs, respectively. a, b, c and d indicate significant (P < .05) difference on OC transcript among MSCs, respectively.
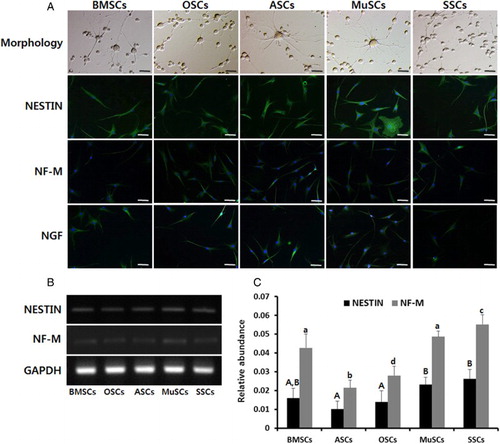
In vitro differentiation of MSCs into neurocytes
Differentiation capacity into neurocytes of ectodermal lineage was examined in BMSCs, ASCs, OSCs, MuSCs and SSCs. After 10 days of differentiation induction under specific conditions, the morphological alterations were investigated under an inverted microscope, and expression of neurocyte-specific proteins and transcripts was investigated by immunofluorescence staining and RT-PCR, respectively. Morphological alterations, like typical neurocytes with multipolar and round cell bodies forming a network structure, were observed in all types of MSCs ((A)). Further, expression of neurocyte-specific proteins (nestin, NF-M and NGF) were exhibited in all types of MSCs by immunofluorescence staining ((A)), but transcript levels of Nestin and NF-M revealed by RT-PCR were significantly (P < .05) higher in BMSCs, MuSCs and SSCs than in OSCs and ASCs, but expression level was not markedly different in all types of MSCs ((B) and 6(C)).
Figure 6. In vitro differentiation capacity into neurocytes and expression of lineage-specific genes in mini-pig BMSCs, ASCs, OSCs, MuSCs and SSCs, respectively. (A) Following neuronal induction, each MSC exhibited a typical neuron-like cells with multipolar, round cell bodies forming a network-like structure at day 10 of induction. Scale bar, 100 μm. Expression of neuronal markers, nestin, NF and NGF, were confirmed by immunofluorescence staining. DNA was counterstained with DAPI (blue) and antibodies against NESTIN, NF and NGF were detected by FITC-conjugated secondary antibody (green). (B) Neurogenic differentiation was further evidenced by the expression of NESTIN and NF-M by RT-PCR. (C) Values indicated the mean transcript levels (mean ± SEM) of three replicates and calculated to ratio based on the level of GAPDH, an internal control gene. A, B and C indicate significant (P < .05) difference on Nestin transcript among MSCs, respectively. a, b, c and d indicate significant (P < .05) difference on NF-M transcript among MSCs, respectively.
Discussion
Mesenchymal stem cells can be derived from various adult tissues, in vitro cultured into any lineage under specific conditions and can be used in the fields of regenerative medicine and tissue engineering. In this study, different MSCs were successfully isolated from the bone marrow, adipose, ovarian, muscle and skin tissues of the same donor mini-pig. Then all the MSCs were compared by analyzing the expression of CD surface markers, stem cell-specific transcripts, level of telomerase activity, differentiation capacity into mesodermal adipocytes and osteocytes lineages, and ectodermal neurocytes lineage. Present results have shown that even though each of the isolated MSCs were derived from the same donor mini-pig, all of them exhibited slightly different cellular properties in the form of CD markers' expression, transcription factors and differentiation potential.
The profiles of specific CD surface markers have been applied to characterize the MSCs isolated from different sources or animals. CD34 is hematopoietic progenitor cell antigen that functions as a cell–cell adhesion factor, and CD45 is a member of the protein tyrosine phosphatase family to regulate a variety of cell growth, differentiation, mitotic cycle, oncogenic transformation and others. CD34 and CD45 are known to mainly express in hematopoietic cells, such as monocytes, macrophages, neutrophils, basophils, eosinophils, erythrocytes, T-cells and B-cells. Therefore, these two types of the CD makers have been used as negative markers to define characterizations of stem cells (Dominici et al. Citation2006; Rojewski et al. Citation2008; Kumar et al. Citation2012; Corselli et al. Citation2013). CD29 is known as an integrin unit associated with very late antigen receptors, CD44 is involved in cell–cell interactions, cell adhesion and migration and vimentin is a type III intermediate filament protein. These three types of the CD markers are expressed in undifferentiated mesenchymal stem cells and have been also used as positive markers. Previous studies have demonstrated that specific CD surface markers are expressed in MSCs derived from mini-pig (Ock et al. Citation2010; Song et al. Citation2011; Jeon et al. Citation2011c; Kumar et al. Citation2012). In the present study, all stem cell-positive markers, namely CD29, CD44 and vimentin, were shown to be strongly expressed by all the MSCs at a similar level (∼over 90%) whereas CD34 and CD45, stem cell-negative markers, were expressed at a lower level (∼10%) without any significant differences. However, the expression level of CD markers in present results was slightly different when compared to other studies. Our previous study has reported that expression level of vimentin in SSCs is significantly higher than in ASCs (Song et al. Citation2011), but the present study demonstrates a near about similar vimentin expression by two different MSCs. Expression of CD34 and CD45 was observed at an ∼2% level in both SSCs and BMSCs of mini-pig (Ock et al. Citation2010; Kumar et al. Citation2012), but our results have demonstrated that their expression level is slightly higher than the level of MSCs examined in the previous study. It has already been reported by previous studies that the expression level of CD markers slightly varies among MSCs derived from different species and origins using different isolation and culture methods (Jeon et al. Citation2011a, Citation2011b; Song et al. Citation2011; Wegmeyer et al. Citation2013) and the variation on the expression of CD surface markers is likely to be due to population of MSCs contaminated with progenitor or differentiated somatic cells.
Homeobox protein NANOG, OCT-4 and SOX-2 proteins are unquestionably the main regulators of differentiation and self-renewability of pluripotent stem cells by transcriptional and epigenetic regulation of essential stemness genes (Rodda et al. Citation2005). Previous others' studies have also demonstrated that transcripts of these transcription factors were detected in BM-MSCs, ASCS, SSCs and MuSCs of mini-pigs, porcine, humans and others, as shown in our results (Wilschut et al. Citation2008; Ock et al. Citation2010; Song et al. Citation2011). However, expression levels of their transcripts were slightly different according to previous studies. MSCs examined in previous studies were originated from porcine donors with different ages, and their expression might be observed at varying levels among types of MSCs (Ock et al. Citation2010; Song et al. Citation2011). Proteins of NONOG and SOX-2 were detected by western blot analysis, whereas OCT-4 protein was not detectable in SSCs, ASCs and OSCs derived from mini-pig donors with different ages (Song et al. Citation2011). Moreover, transcript levels of OCT-4 and SOX-2 were markedly higher than NANOG in BMSCs and SSCs of mini-pig derived from a same donor mini-pig (Ock et al. Citation2010). In the present study, we also observed variations on the expression of their transcripts among different types of MSCs derived from a same donor mini-pig. Further, it has been reported that transcripts of OCT-4 are undetectable or at a low level in muscle progenitor cells or MSCs of porcine, as shown in our observations (Wilschut et al. Citation2008). In the present study, expression of the transcription factors in MuSCs was markedly at a low level, compared to those of other MSCs. However, MuSCs examined in the present study interestingly possessed high differentiation capacity into adipocyte, osteocyte and neurocyte lineages. Differences on stemness transcription factors in each of the studies might be due to a rare population of purified stem cells in MSCs isolated from tissues consisting of complex and various cells. A previous study has strongly suggested that it is considerably not easy to isolate purified MSCs in most tissues with comparatively rare stem cells, probably with the exception of bone marrow (Alison & Islam Citation2009).
Maintenance of telomeric repeats localized at the end of eukaryotic chromosomes is concededly important for the genetic stability without the DNA destruction. The telomeric repeats can be continually maintained or extended by telomerase complex that add a repeating sequence of telomere to the 3′ strand of chromosomes. The level of telomerase activity is quite high in mammalian embryos, embryonic stem cells (ESCs) or malignant tumor cells with unrestricted proliferation capacity. Most of the differentiated somatic cells exhibit the down-regulated telomerase activity, and the telomeric repeats of the somatic cells are gradually shortened by replication error in the 3′ strand of chromosomes during each cell division; subsequently the cells enter the cellular senescent status and arrest cell cycle (Campisi & Yaswen Citation2009). It has been demonstrated that stemness maintenance of ESCs, including self-renewality with immortality and differentiation capacity, is tightly associated with the up-regulated telomerase activity (Armstrong et al. Citation2005), and down-regulation of telomerase activity is one of an early cellular event during ESCs' differentiation process into the specific lineages (Yamada et al. Citation1998). However, even though MSCs for cell or tissue regeneration possess self-renewality and multi-lineage differentiation capacity like ESCs, most of the previous reports have reported that level of telomerase activity in various MSCs found to be undetected or low, or at a similar level to that of in the differentiated somatic cells, and their proliferation capacity is restricted and displayed to early senescent status and apoptotic cell death during long-term cultivation, when compared to those of ESCs or malignant tumor cells (Czyz et al. Citation2003; Zimmermann et al. Citation2003; Serakinci et al. Citation2008; Sensebé et al. Citation2010; Jeon et al. Citation2011a, Citation2011c). It has been reported that telomeric repeats are continually maintained despite down-regulated telomerase activity in various MSCs, and their mechanism has not been fully understood until now. However, it has been suggested by previous studies that the telomeric repeats are maintained by mechanisms of alternative lengthening of telomeres under a low level of telomerase activity (Reddel et al. Citation2001; Henson et al. Citation2002). Meanwhile, our earlier studies have also demonstrated that telomerase activity in various MSCs derived from bone marrow, adipose, skin and dental tissue of mini-pigs and humans was significantly higher than those of normal muscle and MRC-5 fibroblasts by real-time RQ-TRAP assay, but the level was still critically low, compared to malignant tumors or ESCs (Jeon et al. Citation2011a, Citation2011c). Most previous studies have reported that the level of telomerase activity is undetected in normal somatic cells such as fibroblasts, as pointed out above, but the activity in the present study is also quantitatively detected by a real-time RQ-TRAP assay. It has been suggested that the RQ-TRAP assay applying real-time PCR has sometimes exhibited false results, but the real-time RQ-TRAP with more PCR cycles seems to be a suitable assay method for the detection of telomerase activity at a low level by its high sensitivity or speed (Betts et al. Citation2006; Jeon et al. Citation2011a, Citation2011c). Further, it has been suggested that down-regulated telomerase activity in bone marrow MSCs is potentially connected with contamination of hematopoietic progenitor or differentiated hematopoietic cells, implying that isolation of purified MSCs in most tissues with comparatively rare stem cells is considerably not easy, as well (Alison & Islam Citation2009). We strongly believe that the telomerase activity in exactly authentic or purified MSCs should be up-regulated to the level of ESCs.
The differentiation capacity of MSCs into multi-lineage cell types is the most universally accepted criterion to characterize MSCs, especially in the cell-based therapy for clinical studies and their applications (Dominici et al. Citation2006). It has been extensively reported by other studies that upon induction with specific chemicals under suitable in vitro conditions, MSCs derived from various tissues of different donors possess differentiation capacity into specialized lineages like bone, fat, endothelial progenitors, cardiomyocytes along with mesenchymal cells (Ock et al. Citation2010; Song et al. Citation2011; Kumar et al. Citation2012). Recently, the MSCs have found to be differentiated into different lineage cell types, including neurocytes of ectodermal lineage and hepatocytes of endodermal lineage (Yan et al. Citation2007; Kumar et al. Citation2012). In support of these observations, all types of MSCs examined in the present study were successfully differentiated into adipocytes, osteocytes and neurocytes. However, degrees of differentiation evidenced by specific cytochemical staining and expression of lineage-specific transcripts were slightly different among types of MSCs derived from the same donor mini-pig. Previously it has been shown that differentiation capacity into osteocytes and adipocytes was slightly different between porcine BMSCs and SSCs (Ock et al. Citation2010). The cause of different differentiation capacities among various MSCs also seems to be due to difference of purified MSCs isolated in most tissues with comparatively rare stem cells. Further, present results showed that the cellular property on expression of stem cell-specific transcripts, such as NANOG, OCT-4 and SOX-2, is generally exhibited at a high level in BMSCs, but at a low level in MuSCs. Meanwhile, differentiation capacity into adipocytes, osteocytes and neurocytes in both BMSCs and MuSCs is similar, and higher than those of other MSCs except SSCs because according to our results SSCs exhibited comparable or slightly higher more adipogenic and neurogenic differentiation potential than BMSCs and MuSCs. Previous reports have clearly demonstrated that the main function of stem cell-specific transcripts, such as NANOG, OCT-4 and SOX-2, is to maintain the pluripotency of the stem cells, and ESCs with high expression of their transcripts are difficult to differentiate into specific cell types, compared to MSCs (Rodgerson & Harris Citation2011). Following these results, BMSCs with high expression level of stem cell-specific transcripts should possess hard differentiation capacity into specific cell types, compared to MuSCs with low expression level of stem cell-specific transcripts. The cause of difference on cellular properties and differentiation capacity in both BMSCs and MuSCs is not clear.
In conclusion, the present study compared each MSC derived from bone marrow, adipose, ovarian, muscle and skin tissue of a same mini-pig on basic stem cell characterizations and differentiation capacity. All MSCs isolated from different tissues revealed to possess basic stem cell characterizations, such as positive expression of CD markers and stem cell-specific transcripts, and lineage differentiation capacity. However, some differences in the cellular characterizations were observed among the five types of MSCs. Our findings demonstrate that different types of MSCs can be successfully isolated from various adult tissues of the same mini-pig and proved to be good sources of MSCs, especially MSCs derived from bone marrow showed high stem cell characterizations and differentiation capacity, and therefore can be efficiently used as suitable candidates for regenerative medicine and tissue engineering.
Disclosure statement
No potential conflict of interest was reported by the authors.
Additional information
Funding
References
- Alison MR, Islam S. 2009. Attributes of adult stem cells. J Pathol. 217:144–160. doi: 10.1002/path.2498
- Armstrong L, Saretzki G, Peters H, Wappler I, Evans J, Hole N, von Zglinicki T, Lako M. 2005. Overexpression of telomerase confers growth advantage, stress resistance, and enhanced differentiation of ESCs toward the hematopoietic lineage. Stem Cells. 23:516–529. doi: 10.1634/stemcells.2004-0269
- Artandi SE, DePinho RA. 2010. Telomeres and telomerase in cancer. Carcinogenesis. 31:9–18. doi: 10.1093/carcin/bgp268
- Betts DH, Perrault S, Harrington L, King WA. 2006. Quantitative analysis of telomerase activity and telomere length in domestic animal clones. Methods Mol Biol. 325:149–180.
- Campisi J, Yaswen P. 2009. Aging and cancer cell biology. Aging Cell. 8:221–225. doi: 10.1111/j.1474-9726.2009.00475.x
- Chambers I, Colby D, Robertson M, Nichols J, Lee S, Tweedie S, Smith A. 2003. Functional expression cloning of Nanog, a pluripotency sustaining factor in embryonic stem cells. Cell. 113:643–655. doi: 10.1016/S0092-8674(03)00392-1
- Chao YX, He BP, Cao Q, Tay SS. 2007. Protein aggregate-containing neuron-like cells are differentiated from bone marrow mesenchymal stem cells from mice with neurofilament light subunit gene deficiency. Neurosci Lett. 417:240–245. doi: 10.1016/j.neulet.2007.02.082
- Corselli M, Crisan M, Murray IR, West CC, Scholes J, Codrea F, Khan N, Péault B. 2013. Identification of perivascular mesenchymal stromal/stem cells by flow cytometry. Cytometry. 83:714–720. doi: 10.1002/cyto.a.22313
- Czyz J, Wiese C, Rolletschek A, Blyszczuk P, Cross M, Wobus AM. 2003. Potential of embryonic and adult stem cells in vitro. Biol Chem. 384:1391–1409. doi: 10.1515/BC.2003.155
- Dominici M, Le Blanc K, Mueller I, Slaper-Cortenbach I, Marini F, Krause D, Deans R, Keating A, Prockop Dj, Horwitz E. 2006. Minimal criteria for defining multipotent mesenchymal stromal cells. The International Society for Cellular Therapy position statement. Cytotherapy. 8:315–317. doi: 10.1080/14653240600855905
- Henson JD, Neumann AA, Yeager TR, Reddel RR. 2002. Alternative lengthening of telomeres in mammalian cells. Oncogene. 21:598–610. doi: 10.1038/sj.onc.1205058
- Hiyama E, Hiyama K. 2007. Telomere and telomerase in stem cells. Br J Cancer. 96:1020–1024. doi: 10.1038/sj.bjc.6603671
- Jeon BG, Kumar BM, Kang EJ, Ock SA, Lee SL, Kwack DO, Byun JH, Park BW, Rho GJ. 2011a. Characterization and comparison of telomere length, telomerase and reverse transcriptase activity and gene expression in human mesenchymal stem cells and cancer cells of various origins. Cell Tissue Res. 345:149–161. doi: 10.1007/s00441-011-1191-9
- Jeon BG, Kumar BM, Kang EJ, Maeng GH, Lee YM, Hah YS, Ock SA, Kwack DO, Park BW, Rho GJ. 2011b. Differential cytotoxic effects of sodium meta-arsenite on human cancer cells, dental papilla stem cells and somatic cells correlate with telomeric properties and gene expression. Anticancer Res. 31:4315–4328.
- Jeon BG, Kwack DO, Rho GJ. 2011c. Variation of telomerase activity and morphology in porcine mesenchymal stem cells and fibroblasts during prolonged in vitro culture. Anim Biotechnol. 22:197–210. doi: 10.1080/10495398.2011.624651
- Kashyap V, Rezende NC, Scotland KB, Shaffer SM, Persson JL, Gudas LJ, Mongan NP. 2009. Regulation of stem cell pluripotency and differentiation involves a mutual regulatory circuit of the NANOG, OCT4, and SOX2 pluripotency transcription factors with polycomb repressive complexes and stem cell microRNAs. Stem Cells Dev. 18:1093–1108. doi: 10.1089/scd.2009.0113
- Kumar BM, Maeng GH, Lee YM, Kim TH, Lee JH, Jeon BG, Ock SA, Yoo JG, Rho GJ. 2012. Neurogenic and cardiomyogenic differentiation of mesenchymal stem cells isolated from minipig bone marrow. Res Vet Sci. 93:749–757. doi: 10.1016/j.rvsc.2011.09.012
- Lee YM, Kumar BM, Lee JH, Lee WJ, Kim TH, Lee SL, Ock SA, Jeon BG, Park BW, Rho GJ. 2013. Characterization and differentiation of porcine ovarian theca-derived multipotent stem cells. Vet J. 197:761–768. doi: 10.1016/j.tvjl.2013.04.011
- Ock SA, Jeon BG, Rho GJ. 2010. Comparative characterization of porcine mesenchymal stem cells derived from bone marrow extract and skin tissues. Tissue Eng Part C Methods. 16:481–491. doi: 10.1089/ten.tec.2010.0149
- Reddel RR, Bryan TM, Colgin LM, Perrem KT, Yeager TR. 2001. Alternative lengthening of telomeres in human cells. Radiat Res. 155:194–200. doi: 10.1667/0033-7587(2001)155[0194:ALOTIH]2.0.CO;2
- Rodda DJ, Chew JL, Lim LH, Loh YH, Wang B, Ng HH, Robson P. 2005. Transcriptional regulation of nanog by OCT4 and SOX2. J Biol Chem. 280:24731–24737. doi: 10.1074/jbc.M502573200
- Rodgerson DO, Harris AG. 2011. A comparison of stem cells for therapeutic use. Stem Cell Rev. 7:782–796. doi: 10.1007/s12015-011-9241-y
- Rojewski MT, Weber BM, Schrezenmeier H. 2008. Phenotypic characterization of mesenchymal stem cells from various tissues. Transfus Med Hemother. 35:168–184. doi: 10.1159/000129013
- Sensebé L, Krampera M, Schrezenmeier H, Bourin P, Giordano R. 2010. Mesenchymal stem cells for clinical application. Vox Sang. 98:93–107. doi: 10.1111/j.1423-0410.2009.01227.x
- Serakinci N, Graakjaer J, Kolvraa S. 2008. Telomere stability and telomerase in mesenchymal stem cells. Biochimie. 90:33–40. doi: 10.1016/j.biochi.2007.09.005
- Song SH, Kumar BM, Kang EJ, Lee YM, Kim TH, Ock SA, Lee SL, Jeon BG, Rho GJ. 2011. Characterization of porcine multipotent stem/stromal cells derived from skin, adipose and ovarian tissues and their differentiation in vitro into putative oocyte-like cells. Stem Cells Dev. 20:1359–1370. doi: 10.1089/scd.2010.0203
- Wang F, Yu M, Yan X, Wen Y, Zeng Q, Yue W, Yang P, Pei X. 2011. Gingiva-derived mesenchymal stem cell-mediated therapeutic approach for bone tissue regeneration. Stem Cells Dev. 20:2093–2102. doi: 10.1089/scd.2010.0523
- Wegmeyer H, Bröske AM, Leddin M, Kuentzer K, Nisslbeck AK, Hupfeld J, Wiechmann K, Kuhlen J, von Schwerin C, Stein C, Knothe S, Funk J, Huss R, Neubauer M. 2013. Mesenchymal stromal cell characteristics vary depending on their origin. Stem Cells Dev. 22:2606–2618. doi: 10.1089/scd.2013.0016
- Wilschut KJ, Jaksani S, Van Den Dolder J, Haagsman HP, Roelen BA. 2008. Isolation and characterization of porcine adult muscle-derived progenitor cells. J Cell Biochem. 105:1228–1239. doi: 10.1002/jcb.21921
- Yamada O, Takanashi M, Ujihara M, Mizoguchi H. 1998. Down-regulation of telomerase activity is an early event of cellular differentiation without apparent telomeric DNA change. Leuk Res. 22:711–717. doi: 10.1016/S0145-2126(98)00065-4
- Yan L, Han Y, Wang J, Liu J, Hong L, Fan D. 2007. Effects of Notch-1 signalling pathway on differentiation of marrow mesenchymal stem cells into neurons in vitro. Neuroreport. 18:1443–1447. doi: 10.1097/WNR.0b013e3280c1e28c
- Zimmermann S, Voss M, Kaiser S, Kapp U, Waller CF, Martens UM. 2003. Lack of telomerase activity in human mesenchymal stem cells. Leukemia. 17:1146–1149. doi: 10.1038/sj.leu.2402962