
ABSTRACT
Human neuroblastoma SH-SY5Y cells treated with 1-methyl-4-phenyl-pyridinium (MPP+) have been utilized as a cell model for Parkinson’s disease (PD) because they mimic many aspects of the neuronal death observed in PD. Apomorphine hydrochloride (APO) is a non-selective dopamine (DA) agonist and has been used to treat patients with advanced PD showing no response to levodopa or other DA agonists. Besides its receptor-mediated action, APO functions as a potent antioxidant and free radical scavenger with a neuro-protective effect. For the safe and successful use of APO in PD treatment, an understanding of the genomic response in PD patients to APO is essential. In this study, genome-wide transcriptional analysis with microarray technology was performed to identify the genes, ontology and pathways affected by the addition of APO to MPP+-treated SH-SY5Y cells. Our results indicate that the addition of APO to MPP+-treated SH-SY5Y cells may induce anaerobic glycolysis, which might enhance the survival of MPP+-treated SH-SY5Y cells showing inhibition of cellular energy (adenosine triphosphate) production via mitochondrial aerobic pathway.
Introduction
Apomorphine hydrochloride (APO) is a non-selective dopamine (DA) agonist that activates DA D1- and D2-like receptors, serotonin receptors (5HT1A, 5HT2A, 5HT2B, and 5HT2C) and α-adrenergic receptors (α1B, α1D, α2A, α2B, and α2C) (Ribarič Citation2012). APO’s dopaminergic (DAergic) activity results from its polycyclic and tertiary amine structures. Besides its receptor-mediated actions, APO plays a role as a potent antioxidant and free radical scavenger with a neuro-protective effect in vitro and in vivo (Gassen et al. Citation1996; Grunblatt et al. Citation1999). These bioactivities of APO made it to become the first DA agonist used to treat patients with Parkinson’s disease (PD). However, oral administration of APO shows disadvantages such as peripheral DAergic adverse effects and short duration of action, which resulted in its replacement with levodopa (l-dihydroxyphenylalanine) (Ribarič Citation2012). Since alternative routes of APO administration bypassing first-pass liver metabolism (e.g. subcutaneous, sublingual, nasal and rectal administration) have been introduced, interest in APO as a PD drug was renewed. Recently, APO is chiefly utilized in patients with advanced PD showing no response to levodopa or other DA agonists.
A main characteristic of PD is loss of DAergic neurons in the substantia nigra pars compacta (SNpc) leading to depleted striatal DA levels (Choi et al. Citation2014). Therefore, DA replacement therapy using DA precursors such as levodopa is the gold standard for the initial treatment of PD (Deleu et al. Citation2004; Sydow Citation2008). As the conversion of levodopa to DA occurs in the presynaptic DAergic nerve endings, the intactness of the presynaptic apparatus is important for PD treatment with levodopa. Unlike levodopa, APO does not require decarboxylation for its activation and its effect on PD patients is not dependent on the presence of functional presynaptic nerve endings (Muguet Citation1995). Long-term use of levodopa will lead to development of motor fluctuations, which can significantly reduce the patient’s quality of life (Marsden et al. Citation1981; Muguet et al. Citation1995; Ahlskog & Muenter Citation2001; Sydow Citation2008). The frequency of motor fluctuations can be reduced through continuous infusion of levodopa or DA agonists. Intermittent subcutaneous injection or continuous subcutaneous infusion of APO has been used in patients with advanced PD for the treatment of persistent and disabling motor fluctuations (De Gaspari et al. Citation2006; Antonini et al. Citation2011; Carron et al. Citation2011). Improvement of motor symptoms in PD patients by APO might be due to the attenuation of thalamic inhibition by the internal globus pallidus with subsequent activation of the cerebral cortex (Deleu et al. Citation2004).
Although APO exerts beneficial effects on patients with advance PD, its regulation mechanisms at the genomic level are unclear. In this study, we used microarrays and a PD cell model to explore the genome-wide gene expression response to APO in PD. Microarray technology provides the opportunity to simultaneously analyze a large number of genes associated with APO treatment. Undifferentiated SH-SY5Y human neuroblastoma cells were employed as a PD cell model because they mimic many aspects of the DAergic neuronal death observed in PD when treated with 1-methyl-4-phenyl-pyridinium (MPP+), an active metabolite of 1-methyl-4-phenyl-1,2,3,6-tetrahydropyridine (MPTP) (Do Citation2015). In this study, genome-wide gene expression changes in MPP+-treated SH-SY5Y cells with APO were examined using with a commercial whole-genome expression array and compared with the study of Choi et al. (Citation2014) including gene expression changes in SH-SY5Y cells treated with MPP+ alone. Differentially expressed genes (DEGs) of MPP+-treated SH-SY5Y cells, with and without APO shared only 10.7% of DEGs and enrichment analysis showed that anaerobic glycolysis may be activated in MPP+-treated SH-SY5Y cells with APO. Our result might enhance understanding of the transcriptional response to APO in PD patient.
Materials and methods
Cell culture and co-treatment of MPP+ with APO
Human neuroblastoma SH-SY5Y cells (ATCC CRL-2266; Manassas, VA, USA) were cultured at 37°C in 95% air and 5% CO2 in a humidified incubator and maintained in Dulbecco’s modified Eagle’s Medium (DMEM; Sigma-Aldrich, St. Louis, MO, USA) supplemented with 10% fetal bovine serum (FBS; Gibco BRL, Grand Island, NY, USA), 100 units/mL penicillin and 100 mg/mL streptomycin. Freshly prepared MPP+ toxin and APO were added simultaneously to the 100 mm2 cell culture dishes (Corning, Cambridge, MA, USA) plated with 1 × 10⁶ cells and incubated at 37°C for 26 h. The concentrations of MPP+ and APO in the cultures were 1 mM and 10 μM, respectively. The control and treatment experiments were repeated three times.
Rna preparation and microarray experiment
Extraction of total RNA from the cultures and microarray experiment were carried out according to the protocols in the study of Choi et al. (Citation2014). Briefly, total RNA was isolated, amplified and purified using the Ambion Illumina RNA amplification kit (Ambion, Austin, USA). For the preparation of biotinylated cRNA, 550 ng of purified total RNA was reverse-transcribed to cDNA using a T7 oligo (dT) primer. Second-strand cDNA was synthesized, in vitro transcribed, and labeled with biotin-NTP. Then, 750 ng of labeled cRNA samples were hybridized to each human HT-12 expression v.4 bead array for 16-18 h at 58°C, according to the manufacturer’s instructions (Illumina, Inc., San Diego, USA). Detection of the array signal was carried out using Amersham fluorolink streptavidin-Cy3 (GE Healthcare Bio-Sciences, Little Chalfont, UK) following the bead array manual. Arrays were scanned using an Illumina bead array Reader confocal scanner according to the manufacturer’s instructions. A total of six bead arrays were used for three controls (before treatment) and three samples at 26 h after co-treatment of MPP+ with APO.
Normalization
Bead array data were exported using the Illumina GenomeStudio software v2011.1. After log2 transformation of probe signal values, quantile normalization was performed using the function lumiN() from the R package lumi (Du et al. Citation2008). The normalized probe signals were checked for detection against negative controls with the GenomeStudio internal algorithm, and missing values were introduced to replace signals that were under the detection limit. Ratios of each signal against the average control signal were calculated, and probes with two missing of the three replicates were filtered out.
Selection of DEGs
Genes differentially expressed between MPP+ with APO-treated and untreated (control) samples were identified using the R package samr (Tusher et al. Citation2001). A score is assigned to each gene based on the change in gene expression relative to the standard deviation of repeated measurements and the percentage of genes identified by chance, the false discovery rate (FDR), was estimated with permutation of the repeated measurements. As the number of MPP+ with APO-treated and untreated samples is three for each, the total number of distinct permutations is 20 (). Genes with >1.5-fold change and FDR <20% were considered significantly regulated.
Microarray data for MPP+-treated SH-SY5Y cells
To clarify the role of APO in MPP+-treated SH-SY5Y cells, microarray data without APO addition, that is, gene expression data for MPP+-only-treated SH-SY5Y cells, are required for comparison. Therefore, the microarray data of MPP+-only-treated SH-SY5Y cells and their controls were employed from the study of Choi et al. (Citation2014).
Go and pathway enrichment analysis
To explore enriched GO terms and pathways in the set of DEGs, two functions, enrichGO() and enrichKEGG() in the R package clusterProfiler (Yu et al. Citation2012) were utilized, respectively. These two functions calculate a p-value using the hypergeometric distribution to determine whether any terms annotate a list of DEGs at frequency greater than that expected by chance.
In the above formula, N and M represent the total number of genes in the background and the number of genes within that distribution annotated to the terms of interest, respectively, while n and k are the size of the list of DEGs and the number of genes within that list which are annotated to the term, respectively. The p-values were adjusted for multiple comparisons.
Visualization of pathway
For the visualization of enriched pathways, the R package pathview was employed. This program automatically downloads the pathway graph data through html access, parse the data file using the Bioconductor (www.bioconductor.org) software package KEGGgraph (Zhang & Wiemann Citation2009), maps user data to the pathway, and renders pathway graph with the mapped data. KEGG view (in PNG or PDF format) generated by pathview shows all meta-data on pathways, special and temporal information, tissue/cell types, inputs, outputs and connections.
Results and discussion
Identification of DEGs and Gene Ontology (GO) analysis
To examine DEGs from SH-SY5Y cells co-treated with MPP+ and APO, an Illumina whole-genome array (human HT-12 expression v.4 bead array) was employed. Among a total of 47,231 genes with well-established or provisional annotation on the array, only 30,486 genes showed a unique Entrez Gene (http://www.ncbi.nlm.nih.gov/gene) identifier (ID) after filtration. Entrez Gene is the NCBI database for gene-specific information and records in it are assigned unique, stable and tracked integers as identifiers (Maglott et al. Citation2011). Thus, these 30,486 genes with a unique Entrez Gene ID were considered for this study. DEGs by co-treatment of MPP+ and APO were identified using the smar() function of the R package samr (Tusher et al. Citation2001). The smar() function requires a data list including an expression data matrix and a response variable. Here, the expression data matrix comprised a total of six columns including triplicates for control (untreated) and sample (co-treated by MPP+ and APO), respectively. The response variable signified group labels coded 1 for control and 2 for sample. The smar() function calculates relative difference in gene expression between control and sample using the expression data matrix and computes an appropriate Δ value representing the distance from the expected relative difference and the percentage of genes identified by chance, the FDR with permutation of the repeated measurements.
The gene number considered significant and the FDR were 169 and 20%, respectively, when the values of Δ and minimum fold change were 0.5 and 1.5, respectively. The number of up- and downregulated gene was 128 and 41, respectively. This result is in clear contrast to the case of SH-SY5Y cells treated with MPP+ alone, which exhibited 68 upregulated genes and 101 downregulated genes (Choi et al. Citation2014). The number of common DEGs between MPP+-treated SH-SY5Y cells, with and without APO was only 18, and their regulation was identical (). The high expression of MIR1974 (has-miR-1974) may lead to dysfunction of mitochondria because its potential targets are ND1, ND4, ND5, and ND6, which encode components of electron transport chain complex I (Bandiera et al. Citation2011). Downregulation of histone genes such HIST1H2BK, HIST1H2BD, HIST2H2AA4, and HIST2H2BE might result in defects of nucleosome structure that can inhibit or facilitate a transcription factor. The upregulation of DDIT3 might be associated with endoplasmic reticulum (ER) stress (Choi et al. Citation2014; Do Citation2014). The fact that common DEGs between MPP+-treated SH-SY5Y cells, with and without APO are closely related to the key mechanisms of MPP+-induced neuronal toxicity suggests that the addition of APO to MPP+-treated SH-SY5Y cells might not prevent the major activity of MPP+ as a mitochondrial toxin.
Table 1. Fold changes for 18 common DEGs between MPP+-treated SH-SY5Y cells with and without APO. DEGs of SH-SY5Y cells treated with MPP+ alone were obtained from the study of Choi et al. (Citation2014).
However, the co-treatment of MPP+ with APO resulted in upregulation of 119 genes, which were not observed in SH-SY5Y cells treated with MPP+ alone. To examine GO terms that were significantly enriched for DEGs obtained from MPP+-treated SH-SY5Y cells with APO, the function enrichGO() in the R package clusterProfiler (Yu et al. Citation2012) was employed. Enriched GO terms for biological process (BP), molecular function (MF), and cellular component (CC) are shown in . Enriched GO terms for BP included many metabolic processes such as pyruvate (GO:0006090), glucose (GO:0006006), carboxylic acid (GO:0019752), and carbohydrate (GO:0005975) metabolic processes, while enriched GO terms for CC involved many genes located in cell organelles in the cytoplasm; that is, cytoplasmic genes, which are shown in cytoplasmic genes cytoplasmic part (GO:0044444) and cytoplasm (GO:00055737). This result shows that the addition of APO to MPP+-treated SH-SY5Y cells might affect energy metabolism in the cytoplasm.
Table 2. Enriched GO terms in DEGs obtained from MPP+-treated SH-SY5Y cells with APO. GO terms are ranked by adjusted p-value and the cut-off for the adjusted p-value was .01.
Pathway enrichment analysis based on the Kyoto Encyclopedia of Genes and Genomes (KEGG)
The assumption that genes involved in the same BP, MFs, or cellular locations represent behavior correlated with regard to gene expression levels facilitates application of statistical tests to identify enriched pathways (Hung Citation2013). Information regarding enriched pathways for DEGs would enhance understanding of the molecular mechanisms underlying the gene expression changes. Here, pathway enrichment analysis was carried out using the function enrichKEGG() in the R package clusterProfiler with well-characterized human gene signaling pathways in KEGG (Kanehisa et al. Citation2012). The function enrichKEGG(), similar to the function enrichGO() in the above section, calculates a p-value using the hypergeometric distribution to determine whether any terms annotate a list of DEGs at frequency greater than that expected by chance (see Materials and Methods section for detail). shows enriched KEGG pathways for DEGs of MPP+-treated SH-SY5Y cells, with and without APO. A total of 15 enriched KEGG pathways were observed in DEGs of MPP+-treated SH-SY5Y cells with APO, while only one enriched KEGG pathway was observed for DEGs of SH-SY5Y cells treated with MPP+ alone.
Table 3. Enriched KEGG pathways in DEGs of MPP+-treated SH-SY5Y cells, with and without APO. GO terms are ranked by adjusted p-value and the cut-off for the adjusted p-value was .05.
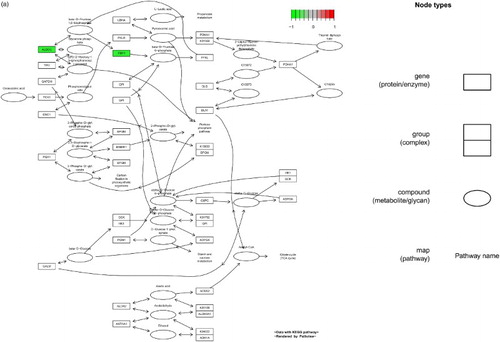
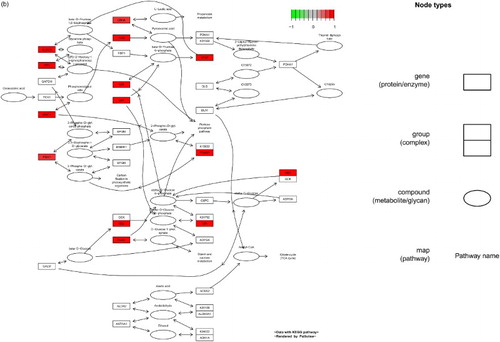
Enriched pathway in DEGs of MPP+-treated SH-SY5Y cells with APO included many metabolism-associated pathways such as hsa00010 (glycolysis/gluconeogenesis), hsa01200 (carbon metabolism), hsa00520 (amino sugar and nucleotide sugar metabolism), hsa00500 (starch and sucrose metabolism), and so on. It is notable that many genes involved in glycolysis/gluconeogenesis were upregulated in MPP+-treated SH-SY5Y cells with APO, which were not observed in SH-SY5Y cells treated with MPP+ alone (). As MPP+ binds to mitochondrial complex I and leads to inhibition of NAD+-linked mitochondrial respiration (Nicklas et al. Citation1985; Ramsay & Singer Citation1986; Dauer & Przedborski Citation2003), energy production through the aerobic glycolytic pathway might be disrupted in MPP+-treated cells. Therefore, energy production through anaerobic glycolysis might contribute to the viability of MPP+-treated cells. Our result shows that the cellular energy deficiency caused by the mitochondrial dysfunction in MPP+-treated SH-SY5Y cells might be overcome by APO-induced activation of anaerobic glycolysis.
Figure 1. DEGs in the glycolysis/gluconeogenesis pathway. (a) MPP+-treated SH-SY5Y cells, (b) MPP+-treated SH-SY5Y cells with APO. Scale bar at the top left represents the log2 fold change.
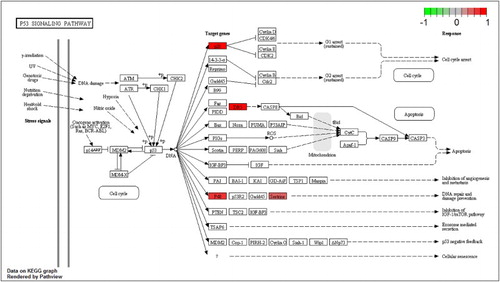
Anaerobic metabolism might also be induced by the HIF-1 (hypoxia-inducible factor-1) signaling pathway (hsa04066), which is included the enriched pathway list (). However, the expression of HIF1A was not changed while PHD (prolyl hydroxylase), here, EGLN1 (hypoxia-inducible factor prolyl hydroxylase 2), was upregulated in MPP+-treated SH-SY5Y cells with APO (). PHDs are iron-dependent enzymes that decrease levels of HIFs through their ability to hydroxylate these proteins, targeting them for subsequent degradation by the ubiquitin-proteasome (Lee at al. Citation2009). As the induction of several HIF-dependent genes has been shown to be protective against either oxygen depletion or oxidative stress within the brain (Wang & Semenza Citation1993; Hochachka et al. Citation1996; Siddiq et al. Citation2005), the upregulation of PHD might not be unfavorable for SH-SY5Y cells with MPP+-induced mitochondrial dysfunction. However, APO induced the activation of genes associated with anaerobic metabolism, including GLUT1 (glucose transporter type 1), HK (hexokinase), ENO1 (enolase 1), PFK2 (6-phosphofructo-2-kinase/fructose-2,6-biphosphatase 3), LDHA (lactate dehydrogenase A), ALDOA (aldolase A, fructose-bisphosphate), and PGK1 (phosphoglycerate kinase 1) in the HIF-1 signaling pathway without the activation of HIF1A (). The activation of those genes associated with anaerobic metabolism was not observed in SH-SY5Y cells treated with MPP+ alone. Partial pathway activation without activation of its main signal gene was also observed in the P53 signaling pathway (hsa04115) (). The expression of the key signal gene, that is, P53, in this pathway was not changed, but DEGs such as P21, P48, and DR5 in the pathway were upregulated. P21 (cyclin-dependent kinase inhibitor 1A) functions as regulator of cell cycle progression at G1, whereas P48 (damage-specific DNA binding protein 2) is necessary for the repair of ultraviolet light-damaged DNA. DR5 is a member of the TNF-receptor superfamily and can transduce an apoptosis signal. The upregulation of P48 might be beneficial for cellular survival against MPP+-induced toxicity, such as mitochondrial DNA oxidative damage. In SH-SY5Y cells treated with MPP+ alone, these genes were not upregulated. Instead, three genes – REPRIMO (P53-dependent G2 arrest mediator candidate), GADD45 (growth arrest and DNA-damage-inducible protein), and P53R2 (ribonucleoside-diphosphate reductase subunit M2) – were downregulated.
Figure 2. DEGs in the HIF-1 signaling pathway for MPP+-treated SH-SY5Y cells with APO. Scale bar at the top left represents the log2 fold change.
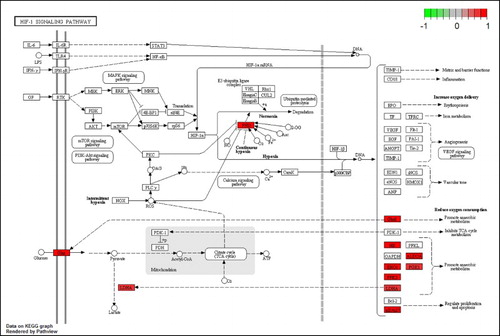
Figure 3. P53 signaling pathway for MPP+-treated SH-SY5Y cells with APO. Scale bar at the top left represents the log2 fold change.
Conclusions
APO activates DA receptors (D1, D2, D3, D4, D5), serotonin receptors (5HT1A, 5HT2A, 5HT2B, 5HT2C), and α-adrenergic receptors (α1B, α1D, α2A, α2B, α2C) (Millan et al. Citation2002; LeWitt Citation2004). The antiparkinsonian effectiveness of APO is similar to that of levodopa, but APO does not require decarboxylation to be activated. Currently, APO is utilized mainly for advanced PD patients who do not respond to levodopa or other DA agonists (Okun & Foote Citation2010). In addition to its receptor-mediated action, APO functions as a potent antioxidant and free radical scavenger and exerts a neuro-protective effect in vitro and in vivo (Gassen et al. Citation1996; Grunblatt et al. Citation1999). For the safe and successful use of APO in PD treatment, an understanding of genomic response to APO in PD is essential. In this study, we examined genome-wide gene expression changes by APO in a PD cell model, that is, MPP+-treated human neuroblastoma SH-SY5Y cells. The addition of APO to MPP+-treated SH-SY5Y cells induced upregulation of genes associated with anaerobic glycolysis, including ALDOA, TPI1, ENO1, PGK1, LDHA, PKM, GPI, PFKP, PGAM1, and HK2 ((b)). Activation of these genes might be beneficial for the survival of MPP+-treated SH-SY5Y cells because MPP+ induces inhibition of mitochondrial complex I, which results in inhibition of cellular energy (ATP) production via the mitochondrial aerobic pathway. Induction of genes associated with anaerobic glycolysis was not observed in SH-SY5Y cells treated with MPP+ alone. This suggests that APO may contribute to the viability of MPP+-treated SH-SY5Y cells through anaerobic glycolysis. It has been reported that the toxic effect of mitochondrial aerobic pathway inhibition by MPP+ was reduced by stimulation of anaerobic glycolysis using glucose in C6 glioma cells (Williams et al. Citation2007). Organs that require high oxidative energy, such as brain or muscle, are particularly vulnerable and rely on glycolysis for energy production (Agani et al. Citation2000). Therefore, anaerobic glycolysis might be an alternative cellular energy production pathway when the mitochondrial aerobic pathway is inhibited. The activation of anaerobic metabolism can also be induced by HIF1A because it stimulates glucose transport into cells and increases glycolytic capacity via upregulation of genes encoding glucose transporters and glycolytic enzymes during hypoxia (Agani et al. Citation2000). That is, at low-oxygen concentrations, HIF1A promotes a metabolic shift from mitochondrial metabolism (TCA cycle and fatty acid β-oxidation) toward glycolysis, which allows cells to adapt metabolically to hypoxia by switching from aerobic to anaerobic metabolism to produce ATP (Correia et al. Citation2013). This suggests that the induction of HIF1A might be beneficial for survival of MPP+-treated SH-SY5Y cells. However, the upregulation of HIF1A was not observed in MPP+-treated SH-SY5Y cells with and without APO. Instead, EGLN1, a class of PHD, was upregulated in MPP+-treated SH-SY5Y cells with APO. As PHDs serve to hydroxylate proline residues situated within HIFs and inhibit stabilization of HIF1A, the upregulation of EGLN1 might result in an increase in proryl-hydroxylated HIF1A, which is targeted for proteasomal degradation. A growing body of evidence supports an inverse relationship between prolyl-hydroxylated HIF1A and reactive oxygen species (ROS) (Correia et al. Citation2013). This suggests that the addition of APO to MPP+-treated SH-SY5Y cells could reduce ROS levels. It was reported that APO treatment increases GPx (glutathione peroxidase), which can detoxify ROS such as H2O2 (Ma et al. Citation2011). This indicates that the induction of HIF1A might be more difficult in MPP+-treated SH-SY5Y cells with APO rather than SH-SY5Y cells treated with MPP+ alone. Although the addition of APO to MPP+-treated SH-SY5Y cells exerts beneficial effects on cell survival, the main toxicity of MPP+ seems to be unavoidable. That is, both MPP+-treated SH-SY5Y cells with and without APO showed 18 DEGs related to mitochondrial function and nucleosome structure and their regulation patterns were identical. This shows the limitation of APO as a neuro-protective agent against MPP+-induced neural cell death.
Disclosure statement
No potential conflict of interest was reported by the author.
Additional information
Funding
References
- Agani FH, Pichiule P, Chavez JC, LaManna JC. 2000. The role of mitochondria in the regulation of hypoxia-inducible factor 1 expression during hypoxia. J Biol Chem. 275:35863–35867. doi: 10.1074/jbc.M005643200
- Ahlskog JE, Muenter MD. 2001. Frequency of levodopa-related dyskinesias and motor fluctuations as estimated from the cumulative literature. Mov Disord. 16:448–458. doi: 10.1002/mds.1090
- Antonini A, Isaias IU, Rodolfi G, Landi A, Natuzzi F, Siri C, Pezzoli G. 2011. A 5-year prospective assessment of advanced Parkinson disease patients treated with subcutaneous apomorphine infusion or deep brain stimulation. J Neurol. 258:579–585. doi: 10.1007/s00415-010-5793-z
- Bandiera S, Rüberg S, Girard M, Cagnard N, Hanein S, Chrétien D, Munnich A, Lyonnet S, Henrion-Caude A. 2011. Nuclear outsourcing of RNA interference components to human mitochondria. PLoS One. 6:e20746. doi: 10.1371/journal.pone.0020746
- Carron R, Fraix V, Maineri C, Seigneuret E, Piallat B, Krack P, Pollak P, Benabid AL, Chabardès S. 2011. High frequency deep brain stimulation of the subthalamic nucleus versus continuous subcutaneous apomorphine infusion therapy: a review. J Neural Transm. 118:915–924. doi: 10.1007/s00702-010-0556-7
- Choi DK, Kim IS, Do JH. 2014. Signaling pathway analysis of MPP+-treated human neuroblastoma SH-SY5Y cells. Biotechnol Bioprocess Eng. 19:332–340. doi: 10.1007/s12257-013-0754-x
- Correia SC, Carvalho C, Cardoso S, Santos RX, Plácido AI, Candeias E, Duarte AI, Moreira PI. 2013. Defective HIF signaling pathway and brain response to hypoxia in neurodegenerative diseases: not an “iffy” question! Curr Pharm Des. 19:6809–6822. doi: 10.2174/1381612811319380013
- Dauer W, Przedborski S. 2003. Parkinson’s disease: mechanisms and models. Neuron. 39:889–909. doi: 10.1016/S0896-6273(03)00568-3
- De Gaspari D, Siri C, Landi A, Cilia R, Bonetti A, Natuzzi F, Morgante L, Mariani CB, Sganzerla E, Pezzoli G, Antonini A. 2006. Clinical and neuropsychological follow up at 12 months in patients with complicated Parkinson’s disease treated with subcutaneous apomorphine infusion or deep brain stimulation of the subthalamic nucleus. J Neurol Neurosurg Psychiatr. 77:450–453. doi: 10.1136/jnnp.2005.078659
- Deleu D, Hanssens Y, Northway MG. 2004. Subcutaneous apomorphine: an evidence-based review of its use in Parkinson’s disease. Drugs Aging. 21:687–709. doi: 10.2165/00002512-200421110-00001
- Do JH. 2014. Neurotoxin-induced pathway perturbation in human neuroblastoma SH-EP cells. Mol Cells. 37:672–684. doi: 10.14348/molcells.2014.0173
- Do JH. 2015. Genome-wide transcriptional comparison of MPP+ treated human neuroblastoma cells with the state space model. AIMS Mol Sci. 2:440–460. doi: 10.3934/molsci.2015.4.440
- Du P, Kibbe WA, Lin SM. 2008. Lumi: a pipeline for processing Illumina microarray. Bioinformatics. 24:1547–1548. doi: 10.1093/bioinformatics/btn224
- Gassen M, Glinka Y, Pinchasi B, Youdim MB. 1996. Apomorphine is a highly potent free radical scavenger in rat brain mitochondrial fraction. Eur J Pharmacol. 308:219–225. doi: 10.1016/0014-2999(96)00291-9
- Grunblatt E, Mandel S, Gassen M, Youdim MB. 1999. Potent neuroprotective and antioxidant activity of apomorphine in MPTP and 6-hydroxydopamine induced neurotoxicity. J Neural Transm Suppl. 55:57–70.
- Hochachka PW, Buck LT, Doll CJ, Land SC. 1996. Unifying theory of hypoxia tolerance: molecular/metabolic defense and rescue mechanisms for surviving oxygen lack. Proc Natl Acad Sci USA. 93:9493–9498. doi: 10.1073/pnas.93.18.9493
- Hung JH. 2013. Gene set/pathway enrichment analysis. Methods Mol Biol. 939:201–213. doi: 10.1007/978-1-62703-107-3_13
- Kanehisa M, Goto S, Sato Y, Furumichi M, Tanabe M. 2012. KEGG for integration and interpretation of large-scale molecular data sets. Nucleic Acids Res. 40:D109–D114. doi: 10.1093/nar/gkr988
- Lee DW, Rajagopalan S, Siddiq A, Gwiazda R, Yang L, Beal MF, Ratan RR, Andersen JK. 2009. Inhibition of prolyl hydroxylase protects against 1-methyl-4-phenyl-1,2,3,6-tetrahydropyridine-induced neurotoxicity: model for the potential involvement of the hypoxia-inducible factor pathway in Parkinson disease. J Biol Chem. 284:299065–29076.
- LeWitt PA. 2004. Subcutaneously administered apomorphine: Pharmacokinetics and metabolism. Neurology. 62:S8–S11. doi: 10.1212/WNL.62.6_suppl_4.S8
- Ma L, Ohyagi Y, Nakamura N, Iinuma KM, Miyoshi K, Himeno E, Soejima N, Yanagihara YT, Sakae N, Yamasaki R, Kira J. 2011. Activation of glutathione peroxidase and inhibition of p53-related apoptosis by apomorphine. J Alzheimers Dis. 27:225–237.
- Maglott D, Ostell J, Pruitt KD, Tatusova T. 2011. Entrez Gene: gene-centered information at NCBI. Nucleic Acids Res. 39:D52–D57. doi: 10.1093/nar/gkq1237
- Marsden CD, Parkes JD, Quinn N. 1981. Fluctuations and disability in Parkinson’s disease: clinical aspects. In: Marsden CD, Fahn S, editors. Neurology 2: movement disorders. London: Butterworth Scientific; p. 96–122.
- Millan MJ, Maiofiss L, Cussac D, Audinot V, Boutin JA, Newman-Tancredi A. 2002. Differential actions of antiparkinson agents at multiple classes of monoaminergic receptor. I. A multivariate analysis of the binding profiles of 14 drugs at 21 native and cloned human receptor subtypes. J Pharmacol Exp Ther. 303:791–804. doi: 10.1124/jpet.102.039867
- Muguet D, Broussolle E, Chazot G. 1995. Apomorphine in patients with Parkinson’s disease. Biomed Pharmacother. 49:197–209. doi: 10.1016/0753-3322(96)82620-5
- Nicklas WJ, Vyas I, Heikkila RE. 1985. Inhibition of NADH-linked oxidation in brain mitochondria by 1-mehthyl-4-phenylpyridine, a metabolite of the neurotoxin 1-methyl-4-phenyl-1,2,3,6-tetrahydropyridine. Life Sci. 36:2503–2508. doi: 10.1016/0024-3205(85)90146-8
- Okun MS, Foote KD. 2010. Parkinson’s disease DBS: what, when, who and why? The time has come to tailor DBS targets. Expert Rev Neurother. 10:1847–1857. doi: 10.1586/ern.10.156
- Ramsay RE, Singer RP. 1986. Energy-dependent uptake of N-methyl-4-phenylpyridinium, the neurotoxic metabolite of 1-methyl-4-phenyl-1,2,3,6-tetrahydropyridine by mitochondria. J Biol Chem. 75:7585–7587.
- Ribarič S. 2012. The pharmacological properties and therapeutic use of apomorphine. Molecules. 17:5289–5309. doi: 10.3390/molecules17055289
- Siddiq A, Ayoub IA, Chavez JC, Aminova L, Shah S, LaManna JC, Patton SM, Connor JR, Cherny RA, Volitakis I, et al. 2005. Hypoxia-induced factor prolyl 4-hydroxylase inhibition. A target for neuroprotection in the central nervous system. J Biol Chem. 280:41732–41743. doi: 10.1074/jbc.M504963200
- Sydow O. 2008. Parkinson’s disease: recent development in therapies for advanced disease with a focus on deep brain stimulation (DBS) and duodenal levodopa infusion. FEBS J. 275:1370–1376. doi: 10.1111/j.1742-4658.2008.06295.x
- Tusher VG, Tibshirani R, Chu G. 2001. Significance analysis of microarrays applied to the ionizing radiation response. Proc Natl Acad Sci USA 98:5116–5121. doi: 10.1073/pnas.091062498
- Wang GL, Semenza GL. 1993. Desferrioxamine induces erythropoietin gene expression and hypoxia-inducible factor 1 DNA-binding activity: implications for models of hypoxia signal transduction. Blood. 82:3610–3615.
- Williams ZR, Goodman CB, Soliman KF. 2007. Anaerobic glycolysis protection against 1-methyl-4-phenyl-pyridinium (MPP+) toxicity in C6 glioma cells. Neurochem Res. 32:1071–1080. doi: 10.1007/s11064-006-9276-7
- Yu G, Wang LG, Han Y, He QY. 2012. ClusterProfiler: an R package for comparing biological themes among gene clusters. OMICS. 16:284–287. doi: 10.1089/omi.2011.0118
- Zhang JD, Wiemann S. 2009. KEGGgraph: a graph approach to KEGG PATHWAY in R and bioconductor. Bioinformatics. 25:1470–1471. doi: 10.1093/bioinformatics/btp167