
ABSTRACT
Mature forms of the microRNAs miR-96, -182, and -183 originate from a single genomic locus and have been shown to be elevated approximately 50-fold in the livers of sterol regulatory element-binding protein-1a and -2 (SREBP-1a and -2) transgenic mice. Our study attempted to identify the possible targets of these microRNAs using miRNA target prediction software. This revealed putative sites in insulin-induced genes (INSIGs). The 3′ untranslated region (UTR) of insulin-induced gene 1 (INSIG1) contained sites corresponding to miR-182, and -183, while the 3′ UTR of INSIG2 featured an miR-96 site. Among these putative sites, only miR-96 demonstrated an inhibitory effect that was specific to the 3′ UTR of INSIG2. As INSIG proteins are the main components of SREBP cleavage complexes that act to release active SREBPs, we assessed the effects of miR-96 on INSIG and SREBP levels and activities. We found that miR-96 reduced the levels of INSIG2 in INSIG1 knockout human fibroblasts, resulting in an increase in SREBP-1 and -2 nuclear forms and a subsequent increase in the abundance of the mRNA of their target genes. These results suggest that miR-96, an miRNA induced by SREBP-2 activation, regulates downstream targets of SREBPs and may increase the abundance of active SREBP.
Introduction
Cholesterol and fatty acids are the main components of cell membranes and are primarily synthesized from acetyl-CoA. The enzymes responsible for de novo cholesterol and fatty acid synthesis are regulated by sterol regulatory element-binding proteins (SREBPs). Three isoforms of SREBPs have been identified in mammals, SREBP-1a, -1c, and -2. SREBP-1c and SREBP-2 are the most prevalent isoforms found in adult tissue and are produced as inactive precursors. These are typically found as integral membrane proteins in the endoplasmic reticulum (ER). SREBPs contain an N-terminal transcription factor region that is released in the Golgi apparatus by two proteases, site-1 (S1P) and site-2 protease (S2P). This cleaved region moves to the nucleus where it activates target genes by binding sterol response elements (SREs). SREBP-1c preferentially regulates genes involved in fatty acid and triglyceride synthesis, while SREBP-2 activates genes involved in cholesterol synthesis, low-density lipoprotein receptors, and PCSK9 (Brown & Goldstein Citation1997; Horton & Shimomura Citation1999; Horton et al. Citation2002).
N-terminal cleavage of these SREBPs is regulated by several accessory proteins, such as SREBP cleavage activating protein (SCAP), insulin-induced gene 1 (INSIG1), and INSIG2. In situations where there is sufficient ER cholesterol, INSIGs bind to SCAP and prevent the SCAP-SREBP complex from moving to the Golgi apparatus (Yabe et al. Citation2002; Yang et al. Citation2002). However, when cholesterol is low in the ER, SCAP undergoes a conformational change that results in dissociation from INSIG proteins. This enables SCAP-SREBP to be incorporated into COP-II-coated vesicles that move to the Golgi apparatus, where the N-terminal region of SREBP is released (Sun et al. Citation2005). Free INSIG1 that dissociates from SCAP undergoes rapid ubiquitin-mediated proteosomal degradation, while INSIG2 has a longer half-life and is not regulated by sterols (Gong et al. Citation2006; Lee et al. Citation2006).
The target genes of each SREBP isoform have been identified through the study of livers from three types of mice that either overexpress nSREBP-1a (TgSREBP-1a), overexpress nSREBP-2 (TgSREBP-2), or are liver-specific SCAP knockouts (KO) (Scap−/− ) that have reduced expression for all SREBPs in liver (Shimano et al. Citation1996; Horton et al. Citation1998; Matsuda et al. Citation2001). In particular, genes that encode enzymes required for fatty acid and cholesterol synthesis were identified as the likely targets for SREBP-1 and -2, respectively (Horton et al. Citation2002; Horton et al. Citation2003). Additionally, SREBPs can also regulate non-coding RNAs. For example, a polycistronic microRNA (miRNA) locus that contains miR-96, -182, and -183 was identified as a non-coding RNA region that is directly activated by SREBP-2 (Jeon et al. Citation2013). In our study, we have identified a predicted binding site for miR-96 in the 3′ untranslated region (UTR) of INSIG2 and determined its role in the regulation of INSIG2 protein and SREBPs.
Experimental procedures
RNA isolation and miRNA qPCR
C57BL/6J mice were fed a normal chow diet ad libitum until the start of the experiment (Teklad Mouse/Rat Diet 2018, Harlan Teklad Premier Laboratory Diets). One group of mice (n = 5) were fasted for 12 h and then their livers were collected and frozen (low insulin group). A second group (n = 5) was fed a high carbohydrate diet (MP Biomedicals, Cat. No. 960238) for 12 h after the initial 12 h fasting period (high insulin group). Livers from the mice described above and livers from Tg-albumin-Cre;Scapf/f mice (n = 5) (liver-specific Scap KO mice) were obtained from Dr. Jay Horton in University of Texas Southwestern Medical Center. All animal studies were approved by the IACUC of University of Texas Southwestern Medical Center. RNA was isolated from frozen livers as indicated in the manufacturer’s manual with minor modification. RNA was precipitated overnight in 70% isopropanol at –20°C. Reverse transcription reactions were performed using a TaqMan microRNA Reverse Transcription Kit (Life Technologies) and the quantity of each miRNA was measured using TaqMan microRNA Assays (Life Technologies). miR-96 levels were normalized to U6 RNA levels.
Generation of pFOXO1, -INSIG1, and -INSIG2 clones
The 3′ UTR regions of INSIG1, INSIG2, and FOXO1 were amplified using genomic DNA isolated from HepG2 cells and the primers FOXO1, 5′-TCTAGAGGGTTAGTGAGCAGGTTACACTTAA-3′ and 5′-GTCGACAGGTCCAAGGCTGTTCAATGGAGAT-3′; INSIG1A, 5′-TCTAGAAGATCGGGCTGACTGTACAAATGAC-3′ and 5′-GTCGACATTGTCTACACAAACTGCCACGGGA-3′; INSIG1B, 5′-TCTAGATCAGCAGAATGGAAGCTTAGAGGAA-3′ and 5′-GTCGACCTTAGTATGAATGTGAACCTCACTAG-3′; INSIG2, 5′-TCTAGATACTGCAATCTGTGATTGCTTCATC-3′ and 5′-GTCGACTCTGCTCATCACATATACTTCCAGT-3′. PCR products were digested using XbaI and SalI and inserted into the XbaI and SalI sites of a pmirGLO dual-luciferase plasmid (Promega). Resulting plasmids were designated pFOXO1, pINSIG1A, pINSIG1B, and pINSIG2. The putative binding sites of miR-183 in INSIG1A and miR-96 in INSIG2 were deleted from pINSIG1A and pINSIG2 plasmid using a Quick Change Lightning Multi Site Directed Mutagenesis Kit (Agilent) and 5′-CATGTGATTAAAACAAGTTTTCAAAGCCTTGAACTA-3′, and 5′-TGTATCACAATGTTAATGATATTGTTCCTGTCATG-3′ primers, respectively. The putative sites for miR-182 and -96 in FOXO1 were deleted from pFOXO1 using the primer 5′-AAATTTCATTACAATGAACTCACTACACCATATAAT-3′, and for miR-183 using primer 5′-CTGCTGTAGATAAGGACTTGGAAATTTCATTACAAT-3′.
Luciferase assays using pmirGLO clones
CHO-K1 cells were obtained from the Korean Cell Line Bank (KCLB No. 10061) and cultured in Ham’s F-12 medium containing 10% fetal bovine serum and 1 × Antibiotic-Antimycotic (Life Technologies). Human mirVANA miRNA mimics were obtained from Life Technologies. These included hsa-miR-96 (assay ID: MC10422), hsa-miR-182 (assay ID: MC12369), hsa-miR-183 (assay ID: 12830), and negative control #1 (cat# 4464058). Cells were plated at a density of 2.5 × 10³ in 48-well plates on day 0. On day 2, pGLO plasmids (0.3 μg/well) and mirVANA miRNA mimics (0, 1, 3, 10, and 20 nM) were transfected into cells using DharmaFECT-Duo Transfection Reagent (GE Healthcare). Cell lysates were prepared in 1× lysis buffer (Promega). Firefly luciferase and Renilla luciferase activities were measured using a Dual-luciferase System (Promega). Firefly luciferase activity was normalized to Renilla luciferase activity.
Transfection of miRNAs and analysis of protein and mRNA levels
INSIG1 (TR4145, INSIG1-KO) or INSIG 2 (TR4148, INSIG2-KO) KO human fibroblasts were kind gifts from Dr. Russell DeBose-Boyd at the University of Texas Southwestern Medical Center. On day 0, INSIG1-KO and INSIG2-KO cells were plated onto 100 mm dishes at densities of 5 × 10⁵ and 6 × 10⁵, respectively. On days 1 and 2, cells were transfected with 20 nM mirVANA miRNA mimics and 20 μL Lipofectamine RNAiMAX (Life Technologies) per plate. On day 3, cells were harvested and the membrane and nuclear proteins, and total RNA, were prepared as described previously (Jo, Sguigna et al. Citation2011). A 30 μg aliquot of protein from each sample was subjected to sodium dodecyl sulfate polyacrylamide gel electrophoresis and immunoblots using antibodies raised against INSIG1 (13F5), INSIG2 (17H1), SREBP-1 (20B12), SREBP-2 (22D5), SCAP, cAMP response element-binding protein, and calnexin (Jo, Lee et al. Citation2011; Moon et al. Citation2012; Jo et al. Citation2013; Rong et al. Citation2017). Total RNA was isolated using an RNA STAT solution and treated with DNaseI from a DNA-free kit (Ambion). cDNA was synthesized using a TaqMan Reverse Transcription Kit (Life Technologies). Real-time qPCR was performed using 2×SYBR Green PCR Master Mix (Life Technologies), as previously described (Liang et al. Citation2002).
Results
miR-96 levels were not regulated by insulin
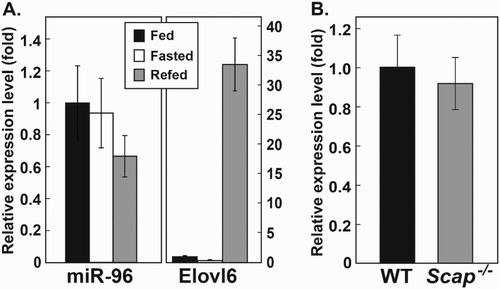
miR-96 was previously identified as a miRNA originating from the polycistronic miRNA locus that also contains miR-182 and -183. This miRNA has previously been shown to be highly elevated (approximately 50-fold) in the livers of TgSREBP-1a, and TgSREBP-2 transgenic mice when compared to wild-type (WT) (Jeon et al. Citation2013). To determine whether insulin also regulates miR-96, levels of the miRNA were measured in livers of mice fasted for 12 h (low insulin) and mice refed a high carbohydrate diet for 12 h after 12 h of fasting (high insulin). No significant changes were detected in the levels of mature miR-96 between the fasting and refeeding periods ((A)). The basal expression level of miR-96 was extremely low in WT mice but there was no further reduction in miR-96 levels in Scap−/− mice compared to WT. This suggests that SREBPs are not critical to the maintenance of basal levels of miR-96 ((B)). These results also indicate that short-term changes in insulin level do not play a significant role in regulating miR-96.
Figure 1. Mature miR-96 levels in the livers of mice. (A) Mature miR-96 levels were measured in the liver of mice fed on a chow diet ad libitum, fasted for 12 h (low insulin), or fed a high carbohydrate diet for 12 h after the 12 h fasting period (high insulin). The mRNA levels of ELOVL6 were used to assess the response to each dietary condition. (B) Mature miR-96 levels were measured in the livers of WT mice and liver-specific SCAP knockout mice. miR-96 levels were normalized to the level of U6 and ELOVL6 mRNA levels were normalized to cyclophilin. The values obtained in WT mice were regarded as 1.0 and used to estimate relative expression in other groups. Values indicate the means ± S.E. (n = 5 mice). ELOVL6, elongation of very long chain fatty acid-like family member 6.
The 3′ UTR of INSIG2 is inhibited by miR-96
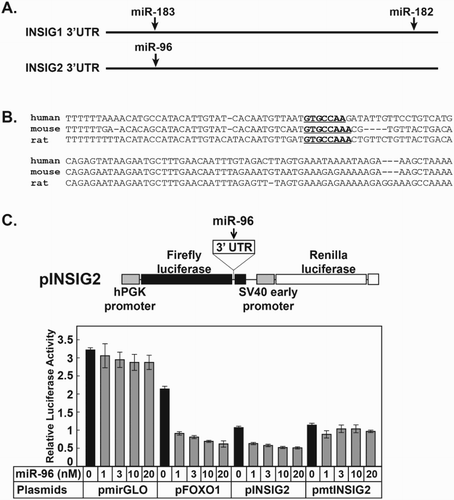
Targetscan and miRDB software were used to search for the target genes of miR-96, -182, and -183. This identified putative binding sites for miR-96 in the 3′ UTR of INSIG1 and for miR-183 in the 3′ UTR of INSIG2. Furthermore, these sites were found to be conserved in the mouse and rat genomes ((A)). Putative binding sites for miR-182 were also identified in the 3′ UTR of human and mouse INSIG1 ((A)). To determine whether the putative binding sites for miR-96, -182, and -183 in the 3′ UTRs of INSIG1 and INSIG2 were regulated by miRNAs, we cloned a 500 bp region from INSIG1 and INSIG2 containing these binding sites into a pmirGLO plasmid downstream of a firefly luciferase reporter gene. The 3′ UTR of FOXO1 was used as a positive control (Guttilla & White Citation2009; Myatt et al. Citation2010). CHO-K1 cells were co-transfected with each plasmid and miR-96, -182, and -183 mimics. The firefly luciferase activity of each cell extract was then measured. This revealed that the luciferase activity of pFOXO1 was significantly inhibited by the presence of miR-96, -182, and -183. The luciferase activity of the pINSIG2 plasmid was inhibited by approximately 50% in cells transfected with miR-96, even when using concentrations as low as 1 nM. The inhibitory effects of miR-96 were abolished when the putative binding site for miR-96 was deleted from the 3′ UTR of INSIG2 ((C)). The luciferase activities of plasmids containing the 3′ UTR regions of INSIG1 and INSIG2 with the putative binding sites for miR-182 and miR-183 were unaffected by the addition of miR-182 or miR-183 mimics (data not shown). These results suggest that miR-96 may inhibit INSIG2 by binding to the predicted site we identified in the 3′ UTR of INSIG2. Finally, we confirmed that the miR-96 binding site found in the 3′ UTR of mouse Insig2 behaved similarly.
Figure 2. Inhibitory effects of miR-96 on the 3′ UTR of INSIG2. (A) Putative binding sites for miR-96, –182, and –183 were identified across the genome. The 3′ UTRs of INSIGs were predicted as possible targets. The predicted binding sites for each miR are shown. (B) The same putative miR-96 binding site was found in the 3′ UTR regions of human, mouse, and rat INSIG2. The binding sequence for miR-96 is shown in bold, underlined characters. (C) A region approximately 500 bp in length encompassing the 3′ UTR of human INSIG2 containing the miR-96 binding site was cloned into a pmirGLO plasmid downstream of a firefly luciferase gene (pINSIG2). The same 3′ UTR region, but with the putative miR-96-binding site deleted was also cloned into a similar plasmid (pmtINSIG2). A plasmid containing the 3′ UTR of human FOXO1 was used as a positive control. Plasmids were then co-transfected into CHO-K1 cells with miR-96 mimics. Cell extracts were prepared and the firefly and Renilla luciferase activities measured. Firefly luciferase activity was normalized to the Renilla luciferase activity. Values shown are means ± S.E. (n = 4 wells).
Endogenous INSIG2 is inhibited by miR-96
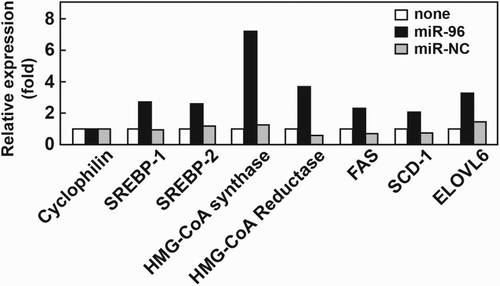
To establish whether miR-96 can regulate endogenous INSIG1 or INSIG2 protein and affect SREBP processing in cells, human fibroblasts were transfected with miR-96 and the abundances of INSIG1 and INSIG2 were compared to cells transfected with a negative control miRNA (miR-NC) and non-transfected controls. Human fibroblasts in which INSIG1 or INSIG2 had individually been deleted (designated INSIG1-KO and INSIG2-KO) were used to assess the changes to each protein and any downstream effects more clearly. In INSIG1-KO cells, INSIG2 levels were significantly decreased in the presence of miR-96. The mature forms of SREBP-1 and SREBP-2 were also increased in the INSIG1-KO cells transfected with miR-96, suggesting an association with INSIG2 and miR-96. No changes were detected in the levels of SCAP (). However, we found that adding miR-96 did not affect INSIG1 levels in INSIG2-KO cells and there was no subsequent effect on SREBP activation. Changes in the expression of the target genes of SREBP-1 and SREBP-2 were also assessed in INSIG1-KO cells transfected with miR-96 or miR-NC (). These genes are primarily involved in the cholesterol synthesis pathway and include 3-hydroxy-3-methylglutaryl-coenzyme A (HMG-CoA) synthase and HMG-CoA reductase. We found that the transcript levels of these genes were increased fourfold to sixfold in INSIG1-KO cells exposed to miR-96. Additionally, transcripts for genes involved in the fatty acid synthesis pathway, such as FAS, SCD-1, and ELOVL6, were increased twofold to fourfold in cells transfected with miR-96, alongside an increase in SREBP activation (). These results suggested that miR-96 can inhibit endogenous INSIG2 and consequently enhance SREBP processing, leading to increased expression of SREBP target genes.
Figure 3. Immunoblots of INSIGs and SREBPs in human fibroblasts transfected with a miR-96 mimic. INSIG1 (INSIG-1 KO) or INSIG2 (INSIG-2 KO) knockout human fibroblasts were transfected with a control miRNA (miR-NC) or a miR-96 mimic. Nuclear and membrane proteins were prepared from the cells and immunoblotting performed using the indicated antibodies. ‘None’ indicates cells without transfection.
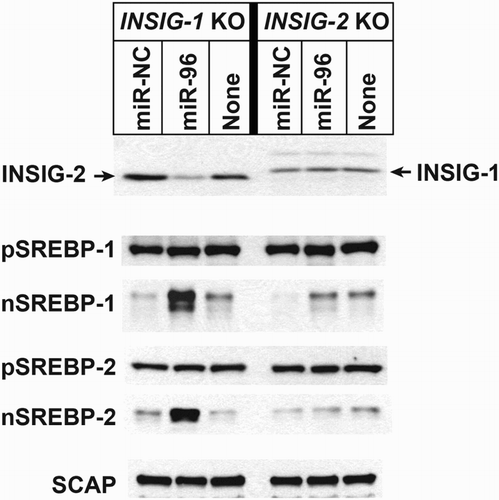
Figure 4. mRNA expression levels of SREBP target genes in human fibroblasts transfected with miR-96. Total RNA was prepared from cells transfected with either miR-NC or a miR-96 mimic. The expression levels of the target genes of SREBP-1 (FAS, SCD-1, and ELOVL6) and SREBP-2 (HMG-CoA synthase and HMG-CoA reductase) were measured. The expression levels in cells without transfection were regarded as 1.0 and levels in other groups determined relative to this group. Data were normalized to a cyclophilin endogenous control (n = 2). FAS, fatty acid synthase; SCD-1, stearoyl-CoA desaturase; ELOVL6, elongation of very long chain fatty acid-like family member 6.
Discussion
The roles of SREBPs in the regulation of enzymes required for fatty acid and cholesterol metabolism have been extensively investigated using various transgenic and KO mice models. This detailed analysis has contributed to a better understanding of how lipid metabolism is regulated (Shimano et al. Citation1996; Shimano et al. Citation1997; Matsuda et al. Citation2001; Liang et al. Citation2002). Regulation of non-coding genes by SREBPs, particularly miRNAs, has also been investigated (Jeon et al. Citation2013). For example, SREBP-2 was found to induce transcription of miR-96, -182, and -183, from a single region. Our study has shown that miR-96 targets the 3′ UTR of INSIG2, reducing its expression and thereby accelerating SREBP processing. This results in an increase in the abundance of the nuclear forms of SREBP-1 and -2, both of which have further roles in SREBP regulation. Another miRNA from the same transcript, miR-182 was shown to increase SREBP levels by inhibiting Fbxw7 (Jeon et al. Citation2013). We were unable to determine a role for miR-183 in our study and found no effect on INSIG or SREBP activation.
miR-96 and miR-183 both have an additional role in controlling FOXO1, a major transcription factor in the liver that regulates glucose production genes, such as glucose 6-phophatase and phosphoenolpyruvate carboxykinase. The FOXO1 3′ UTR was used as a positive control in our study of regulation by miR-96 and miR-183. Although FOXO1 does not directly regulate SREBPs, a reduction in FOXO1 may increase the flow of substrates into the lipid synthesis pathway. By reducing the flow of glucose 6-phosphate into glucose production, it may be more available for fatty acid and cholesterol synthesis. The expression and subsequent regulation of miRNAs transcribed together may be both a way to rapidly activate SREBPs and a method to increase fatty acid and cholesterol synthesis. In concert with other regulation methods, including transcriptional and post-translational mechanisms, our study reveals that miRNAs act to control SREBP levels and also play a role in directing metabolic flow.
Acknowledgements
We thank Dr. Jay Horton for providing the mouse liver tissues and Dr. Russell DeBose-Boyd for the INSIG-KO cells.
Disclosure statement
No potential conflict of interest was reported by the authors.
Additional information
Funding
References
- Brown MS, Goldstein JL. 1997. The SREBP pathway: regulation of cholesterol metabolism by proteolysis of a membrane-bound transcription factor. Cell. 89:331–340. doi: 10.1016/S0092-8674(00)80213-5
- Gong Y, Lee JN, Lee PCW, Goldstein JL, Brown MS, Ye J. 2006. Sterol-regulated ubiquitination and degradation of insig-1 creates a convergent mechanism for feedback control of cholesterol synthesis and uptake. Cell Metab. 3:15–24. doi: 10.1016/j.cmet.2005.11.014
- Guttilla IK, White BA. 2009. Coordinate regulation of FOXO1 by miR-27a, miR-96, and miR-182 in breast cancer cells. J Biol Chem. 284:23204–23216. doi: 10.1074/jbc.M109.031427
- Horton JD, Goldstein JL, Brown MS. 2002. SREBPs:activators of the complete program of cholesterol and fatty acid synthesis in the liver. J Clin Invest. 109:1125–1131. doi: 10.1172/JCI0215593
- Horton JD, Shah NA, Warrington JA, Anderson NN, Park SW, Brown MS, Goldstein JL. 2003. Combined analysis of oligonucleotide microarray data from transgenic and knockout mice identifies direct SREBP target genes. Proc Natl Acad Sci USA. 100:12027–12032. doi: 10.1073/pnas.1534923100
- Horton JD, Shimomura I. 1999. SREBPs: activators of cholesterol and fatty acid biosynthesis. Curr Opin Lipidol. 10:143–150. doi: 10.1097/00041433-199904000-00008
- Horton JD, Shimomura I, Brown MS, Hammer RE, Goldstein JL, Shimano H. 1998. Activation of cholesterol synthesis in preference to fatty acid synthesis in liver and adipose tissue of transgenic mice overproducing sterol regulatory element-binding protein-2. J Clin Invest. 101:2331–2339. doi: 10.1172/JCI2961
- Jeon T-I, Esquejo Ryan M, Roqueta-Rivera M, Phelan Peter E, Moon Y-A, Govindarajan Subramaniam S, Esau Christine C, Osborne Timothy F. 2013. An SREBP-responsive microRNA operon contributes to a regulatory loop for intracellular lipid homeostasis. Cell Metab. 18:51–61. doi: 10.1016/j.cmet.2013.06.010
- Jo Y, Hartman IZ, DeBose-Boyd RA. 2013. Ancient ubiquitous protein-1 mediates sterol-induced ubiquitination of 3-hydroxy-3-methylglutaryl CoA reductase in lipid droplet–associated endoplasmic reticulum membranes. Mol Biol Cell. 24:169–183. doi: 10.1091/mbc.E12-07-0564
- Jo Y, Lee PCW, Sguigna PV, DeBose-Boyd RA. 2011. Sterol-induced degradation of HMG CoA reductase depends on interplay of two Insigs and two ubiquitin ligases, gp78 and Trc8. Proc Natl Acad USA. 108:20503–20508. doi: 10.1073/pnas.1112831108
- Jo Y, Sguigna PV, DeBose-Boyd RA. 2011. Membrane-associated ubiquitin ligase complex containing gp78 mediates sterol-accelerated degradation of 3-hydroxy-3-methylglutaryl-coenzyme A reductase. J Biol Chem. 286:15022–15031. doi: 10.1074/jbc.M110.211326
- Lee JN, Gong Y, Zhang X, Ye J. 2006. Proteasomal degradation of ubiquitinated insig proteins is determined by serine residues flanking ubiquitinated lysines. Proc Natl Acad Sci USA. 103:4958–4963. doi: 10.1073/pnas.0600422103
- Liang G, Yang J, Horton JD, Hammer RE, Goldstein JL, Brown MS. 2002. Diminished hepatic response to fasting/refeeding and LXR agonists in mice with selective deficiency of SREBP-1c. J Biol Chem. 277:9520–9528. doi: 10.1074/jbc.M111421200
- Matsuda M, Korn BS, Hammer RE, Moon YA, Komuro R, Horton JD, Goldstein JL, Brown MS, Shimomura I. 2001. SREBP cleavage-activating protein (SCAP) is required for increased lipid synthesis in liver induced by cholesterol deprivation and insulin elevation. Genes Dev. 15:1206–1216. doi: 10.1101/gad.891301
- Moon Y-A, Liang G, Xie X, Frank-Kamenetsky M, Fitzgerald K, Koteliansky V, Brown MS, Goldstein JL, Horton JD. 2012. The scap/SREBP pathway Is essential for developing diabetic fatty liver and carbohydrate-induced hypertriglyceridemia in animals. Cell Metab. 15:240–246. doi: 10.1016/j.cmet.2011.12.017
- Myatt SS, Wang J, Monteiro LJ, Christian M, Ho K-K, Fusi L, Dina RE, Brosens JJ, Ghaem-Maghami S, Lam EW-F. 2010. Definition of microRNAs that repress expression of the tumor suppressor gene FOXO1 in endometrial cancer. Cancer Res. 70:367–377. doi: 10.1158/0008-5472.CAN-09-1891
- Rong S, Cortés VA, Rashid S, Anderson NN, McDonald JG, Liang G, Moon Y-A, Hammer RE, Horton JD. 2017. Expression of SREBP-1c requires SREBP-2-mediated generation of a sterol ligand for LXR in livers of mice. eLife. 6:e25015. doi: 10.7554/eLife.25015
- Shimano H, Horton JD, Hammer RE, Shimomura I, Brown MS, Goldstein JL. 1996. Overproduction of cholesterol and fatty acids causes massive liver enlargement in transgenic mice expressing truncated SREBP-1a. J Clin Invest. 98:1575–1584. doi: 10.1172/JCI118951
- Shimano H, Shimomura I, Hammer RE, Goldstein JL, Brown MS, Horton JD. 1997. Elevated levels of SREBP-2 and cholesterol synthesis in livers of mice homozygous for a targeted disruption of the SREBP-1 gene. J Clin Invest. 100:2115–2124. doi: 10.1172/JCI119746
- Sun L-P, Li L, Goldstein JL, Brown MS. 2005. Insig required for sterol-mediated inhibition of scap/SREBP binding to COPII proteins in vitro. J Biol Chem. 280:26483–26490. doi: 10.1074/jbc.M504041200
- Yabe D, Brown MS, Goldstein JL. 2002. Insig-2, a second endoplasmic reticulum protein that binds SCAP and blocks export of sterol regulatory element-binding proteins. Proc Natl Acad Sci USA. 99:12753–12758. doi: 10.1073/pnas.162488899
- Yang T, Espenshade PJ, Wright ME, Yabe D, Gong Y, Aebersold R, Goldstein JL, Brown MS. 2002. Crucial step in cholesterol homeostasis: sterols promote binding of SCAP to INSIG-1, a membrane protein that facilitates retention of SREBPs in ER. Cell. 110:489–500. doi: 10.1016/S0092-8674(02)00872-3