
ABSTRACT
Primary hepatocytes (PHs) are considered the ‘gold standard’ in drug screening owing to their ability to express many drug-metabolizing enzymes and transporters. Culturing hepatocytes and maintaining their fate in vitro is a major issue since last decade. The main problem with in vitro hepatocytes culture is that they rapidly lose their hepatic morphology and liver-specific functions in culture. Herein, we isolated rat PHs, and cultured them in monolayers (2-D) and spheroids (3-D). The 2-D-cultured PHs exhibited elongated morphology, whereas the 3-D-cultured PHs exhibited spheroid morphology with gradual diameter decrease until 7 days. After 7 days of in vitro culture, PHs were analyzed for the expression of hepatic (Alb, Tf, and Afp) and apoptotic markers (Bax and Bcl2), and co-expression of CYP3A1 and Abumin after 2 and 7 days. Furthermore, in both cultures, PHs were induced with 3-methylcholanthrene (3-MC, Cyp1a-specific inducer) and dexamethasone (Cyp3a-specific inducer) for 48 and 72 h, respectively. The mRNA levels of Cyp1a and Cyp3a were analyzed in induced (3-MC, dexamethasone) and non-induced PHs. After 7 days of in vitro culture, PHs exhibited dramatic downregulation of hepatic marker expression in both cultures. Furthermore, apoptotic marker expression was higher in the 2-D-cultured PHs than 3-D-cultured PHs. The mRNA levels of Cyp1a and Cyp3a indicated higher RNA content in the 2-D-cultured PHs after 48 h of induction. Therefore, we concluded that there was no significant difference between the culture systems, and further studies are required to identify the essential components for in vitro PH culture rather than culture systems.
Introduction
Liver, being the largest organ in the human body and involved in over 500 functions i.e. bile acid synthesis, glycogen storage, xenobiotic metabolism, protein synthesis, and so on, play key roles in homeostasis in humans and animals. Because of its multiple functions and high regenerative ability, the liver is of great interest in modern research (Michalopoulos and DeFrances Citation1997; Taub Citation2004). The liver is believed to regenerate even after 80% loss in total mass (Nahmias et al. Citation2007). Liver regeneration subsequent to its damage is observed in all vertebrates, ranging from humans to fishes (Michalopoulos and DeFrances Citation1997). Despite its high regenerative ability, hepatic failure (due to viral infections, drug toxicity, fatty liver disease, hepatic carcinoma) is the major global cause of death. Liver transplantation is the only possible therapeutic option for patients in chronic stages of hepatic failure; however, its applicability is restricted, because of donor unavailability (Duan et al. Citation2013). Currently, artificial liver and cell transplantation are emerging as novel therapies for patients with end-stage liver disease; however, these techniques also have limitations owing to the unavailability of proper equipment and cell sources. Primary hepatocytes (PHs) are considered the ‘gold standard’ in drug screening because of their ability to express the entire set of drug-metabolizing enzymes and transporters (Hewitt et al. Citation2007; Gomez-Lechon et al. Citation2008; Hu and Li Citation2015). Culturing hepatocytes and maintaining their fate in vitro are major issues since the last decade. The main problem with in vitro hepatocyte culture is that hepatocytes rapidly lose their morphology and liver-specific functions under in vitro culture conditions. However, efforts have been made for culturing PHs in vitro using 2-D (monolayer) and 3-D (three-dimensional) culture techniques (Schyschka et al. Citation2013; Hu and Li Citation2015). The seeding of PHs on single-layer collagen matrices is the most common method; despite the secretion of albumin and urea, these cells exhibit reduced basic liver functions after a week (Shulman and Nahmias Citation2013). In addition to monolayer culture techniques, collagen sandwich (Dunn et al. Citation1989) and hepatic spheroid configurations are employed in PH culture. Although each in vitro system has advantages and disadvantages, 3-D culture with dynamic flow for primary cells is considered the most promising technique for PH culture (Miyazawa et al. Citation2007). The quest for the ideal conditions for PH culture is still continuing, and requires more detailed studies to completely understand their biology for in vitro culture.
In this study, we performed a comparative analysis of 2-D and 3-D culture systems using rat-derived PHs, followed by analysis of the expression of albumin, transferrin, AFP, apoptotic-related markers and xenobiotic-metabolizing enzymes (CYP1A, CYP3A) at different time intervals.
Materials and methods
Reagents and media
Unless otherwise specified, all the chemicals were purchased from Sigma-Aldrich Corporation (St. Louis, MO, USA), and media were obtained from Gibco (Invitrogen, Burlington, ON, Canada).
Isolation and culture of primary hepatocytes
Crl:CD (SD) rats (5–7 weeks old; Charles river Laboratories, Orient Bio, Seongnam, Korea) were anesthetized by intraperitoneally (I.P) injecting 300 mg/kg of avertin (2, 2, 2-Tribromoethanol, 25 mg/ml). The liver was perfused and digested through the portal vein with perfusion medium and liver digest medium, respectively, in a two-step collagenase digestion method (Seglen Citation1976). The digested liver tissues were removed from the rats, and gently minced with scissors until they were in solution. The minced liver tissues were filtered through 100-µm and 400-µm nylon cell strainers (Corning inc., New York, NY, USA), to remove undigested tissues. The cells were centrifuged at 50 × g for 5 min; the cell pellet was resuspended in hepatocyte wash medium, and washed twice using the same centrifugation conditions. To obtain healthy cells, PHs were purified by Percoll density gradient centrifugation as reported previously by Hong et al. (Citation2013) and Shen et al. (Citation2012). PHs were centrifuged at 200 × g at 4°C with 40% Percoll for 10 min. After centrifugation, healthy PHs was pelleted, as damaged hepatocytes could not enter the 40% Percoll solution. The pellets were washed twice with hepatocyte wash medium by centrifugation at 50 × g for 5 min.
All animal experiments were conducted in accordance with the Guide for the Care and Use of Laboratory Animals of our institution, and approved by the Animal Ethics Committee of the National Institute of Animal Science, RDA.
Primary hepatocyte culture
Healthy PHs were washed twice with hepatocyte wash medium, and suspended in hepatocyte maintenance medium (HMM, Williams E medium) supplemented with factors for primary-hepatocyte maintenance [0.1 µM dexamethasone and cell-maintenance cocktail] and 5% fetal bovine serum (FBS), and 5 × 10⁵ cells were seeded with homogeneous distribution on 35-mm-wide collagen-coated dishes (Corning inc., New York, NY, USA). After 24 h, non-adherent cells were removed by changing HMM, and attached cells were continuously cultured for 7 days. Meanwhile, PHs were also seeded (5 × 10⁵ cells) for spheroid culture on 600-µm-wide microwell plates (StemFIT 3D-H389, PRODIZEN, Seoul, Korea) for 7 days ((B)) to induce spontaneous spheroid formation. The PH cultures were incubated at 37°C in a humidified atmosphere of 5% CO2 in air. HMM was changed after every 2 days.
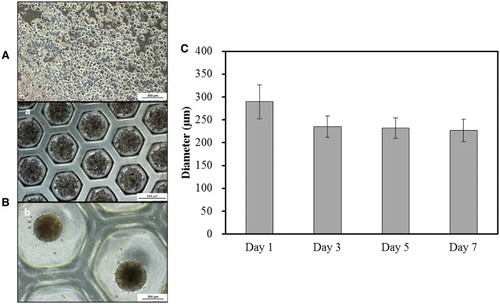
Figure 1. Morphological analysis of rat-derived primary hepatocytes (PHs). (A) Cultured PHs formed a single monolayer in 2-D culture. Scale bar = 200 µm. (B) In 3-D culture, PHs formed spheroids with time i.e. from days 0 (a, Scale bar = 500 µm) to 7 (b, Scale bar = 200 µm) with continuous (C) decrease in diameter from days 1–7 (Triplicate).
Immunofluorescence staining
For immunofluorescence, cells cultured on cover glasses and microwell plates were fixed with 4% formaldehyde on days 2 and 7, and permeabilized with 0.1% Triton X-100 supplemented with 5% BSA. After permeabilization, the cells were blocked with 5% BSA (DPBS) for 1 h, and then, incubated with the primary antibodies (1:100) ALB (P-20) (sc-46293; Santa Cruz Biotechnology, Japan), transferrin (M-70) (sc-30159, Santa Cruz Biotechnology), AAT (G-17) (sc-14586, Santa Cruz Biotechnology), CYP3A1 (ab22724, Abcam) overnight at 4°C. After the primary antibody treatment, the cells were washed with DPBS, and incubated with donkey anti-goat IgG-FITC (sc-2024, Santa Cruz Biotechnology, 1:100) and goat anti-rabbit IgG-FITC (sc-2012, Santa Cruz Biotechnology, 1:100). For nuclear staining, the cells were treated with 1 μg/ml 4′,6-diamidino-2-phenylindole (DAPI) for 30 min at room temperature (RT). Finally, the cells were sealed with VECTASHIELD Antifade Mounting Medium (Vector laboratories, Burlingame, CA, USA), and observed under a fluorescence microscope (Leica DMI 6000B, Wetzlar, Germany).
Chemical induction to evaluate level of CYP450 expression
The PHs were cultured in 2-D and 3-D with HMM for 24 h. After 24 h, HMM was replaced with hepatocyte induction medium (HIM), supplemented with 2 µM 3-methylcholanthrene (3-MC) or 10 µM dexamethasone (Dex), and incubated for an additional 48 and 72 h (Lu and Li Citation2001; Wojcikowski et al. Citation2012), respectively.
Reverse transcription-qPCR (RT-qPCR)
Total RNA was isolated from the PHs using RNeasy Mini kit (Qiagen, Hilden, Germany), and quantified using a spectrophotometer (NanoDrop 1000, Thermo Fisher Scientific, Wilmington, DE, USA). Complementary DNA (cDNA) was synthesized from the purified total RNA (1 μg) using Omniscript Reverse Transcription kit (Qiagen, Hilden, Germany) with 10 Χ RT buffer, dNTP mix, RNase inhibitor, 10 μM Oligo(dT) primer at 37°C in 1 h. RT-qPCR was performed using StepOnePlus Real-Time PCR System (Applied Biosystems, CA, USA) with SYBR Green master mix (Thermo Fisher Scientific, CA, USA), supplemented with 10 μM of specific primer pairs (). All the samples were run in 5 replicates, and Gapdh was used as the internal control. The PCR products were analyzed by electrophoresis for specific gene amplification. For control groups, fresh primary hepatocytes were used.
Table 1. Table of primers used in RT-qPCR.
Statistical analysis
Data were analyzed by one-way ANOVA with IBM SPSS statistics 24. PCR data were expressed as RQ, error bars represented RQ ± Min and RQ ± Max; and differences were considered significant at p < 0.05.
Results
Morphology of 2-D- and 3-D-cultured primary hepatocytes
After initial seeding, the PHs attained a plain, fibroblast-like appearance in 2-D culture ((A)), while they maintained a compact spherical-cum-hexagonal structure in 3-D culture ((B)). The diameter of the 3-D cultured PHs was measured as 289.5 μm on day 1, which gradually decreased on days 3 (235.1 μm), 5 (232.0 μm), and 7 (226.7), respectively.
Expression of hepatocyte and apoptosis regulatory markers
To evaluate hepatocyte characteristics in both culture conditions, on day 7, PHs were collected, and analyzed for the expression of albumin, transferrin, alpha fetoprotein, and CYP3A (xenobiotic-metabolizing enzyme) by RT-qPCR. Fresh rat primary hepatocytes (day 0) were used as the positive control. The mRNA contents of Alb, Tf, Afp ((A–C)), and Cyp3a ((D)) were significantly downregulated compared with the positive control; however, the spheroid (3-D)-cultured PHs exhibited relatively high expression (p < 0.05) of Alb, Afp and cyp3a compared with the normal (2-D) plated PHs. Furthermore, apoptosis regulatory markers were significantly upregulated in the 2-D-cultured PHs (Bax 4.2, Bcl2 14.8) compared with the 3-D spheroid-cultured PHs (Bax 1.4, Bcl2 2.5) ((A,B)).
Figure 2. RT-qPCR of hepatocyte-specific markers (A) Alb, (B) Tf, (C) Afp, and xenobiotic-metabolizing enzyme (Cyp3a) in control (day 0) and 2-D and 3-D culture systems on day 7. Gapdh served as the internal control. Letters ‘a,’ ‘b,’ and ‘c’ denote significant difference (p < 0.05) between control and PHs. All experiments were performed in triplicate.
Figure 3. RT-qPCR of apoptotic markers (A) Bax and (B) Bcl2 in control (day 0) and 2-D and 3-D culture systems on day 7. Letters ‘a,’ ‘b,’ and ‘c’ denote significant difference (p < 0.05) between control and PHs. All experiments were performed in five replicates.
Expression of hepatocyte-specific proteins
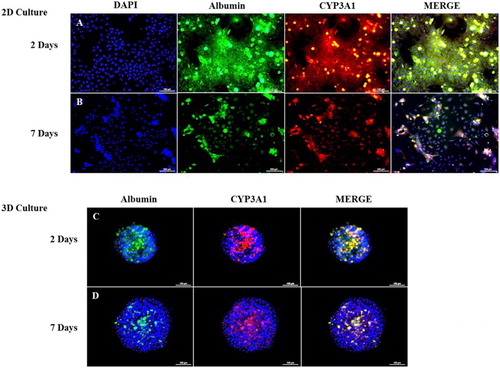
To further corroborate the RT-qPCR findings, the expression of Alb, Aat (antitrypsin), and Tf was analyzed by immunofluorescence. The 2-D-((A)) and 3-D-((B))-cultured PHs were positive for all the three proteins, and, no significant difference was observed between the two groups. To further investigate the localization and zonation consistency of PHs, 2-D- and 3-D-cultured PHs were analyzed for the expression of Albumin (periportal marker) and CYP3A1 (perivenous marker) by double immunofluorescence after 2 and 7 days of culture. Despite the culture systems (2-D or 3-D), the PHs exhibited positive expression of Albumin and CYP3A1 after 2 and 7 days of culture ().
Figure 4. Immunofluorescence analysis of ALB, AAT, and TF in (A) 2-D- and (B) 3-D-cultured PHs. Green and blue (DAPI) fluorescence implied positive reactions for each protein and nucleic acid in counterstaining, respectively. Scale bars = 100 µm.
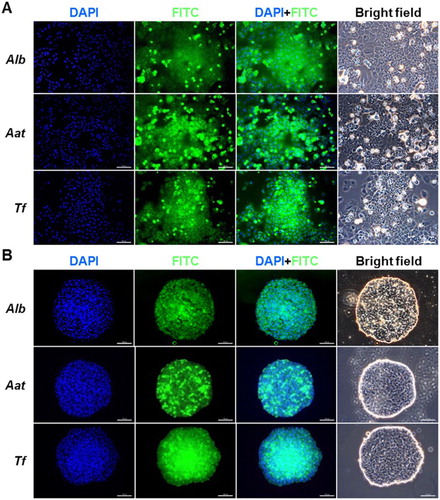
Figure 5. Double-immunofluorescence staining of rat PHs after 2 and 7 days of culture. A and 5B show the co-expression of CYP3A1 (red) and Albumin (green) in monolayer-cultured PHs after 2 and 7 days, respectively. Figures 5C and 5D show the co-expression of CYP3A1 (red) and Albumin (green) in 3-D-cultured PHs after 2 and 7 days, respectively. Blue stain (DAPI) indicates nuclear staining. Scale bar = 100 µm.
Chemical induction and level of CYP450 expression
Fresh 2-D- and 3-D-cultured PHs were induced with 3-methylcholanthrene (3-MC) and dexamethasone for 48 and 72 h, respectively. After induction, the expression of Cyp1a and Cyp3a was analyzed by RT-qPCR. After 48 h, the expression level of Cyp1a mRNA was significantly high in the 3-MC-induced 2-D- (96.6) and 3-D-(20.2) cultured PHs compared with the non-induced cells ((Aa)). Similarly, after 72 h, the levels of Cyp1 expression were 42.3 and 19.2 in the 2-D- and 3-D-cultured PHs, respectively, which was again higher than those of the non-induced PHs ((Aa)). Furthermore, after 48 h, the expression level of Cyp3a mRNA was significantly high in the Dexamethasone-induced 3-D-(1246.9) and 2-D-(2009.1) cultured PHs compared with the non-induced cells ((Ab)). Similarly, after 72 h, the expression levels of Cyp3a were 515.3 and 1177.8 in the 2-D- and 3-D-cultured PHs, respectively, which was higher than those of the non-induced PHs ((Ab)). Overall, the level of Cyp1a expression was higher in 2-D culture than 3-D irrespective of their induction time; however, the pattern of Cyp3a expression after 48 h was observed as 2-D > 3-D, whereas, after 72 h, it was 3-D > 2-D. The band intensity of Cyp1a and Cyp3a in 3-MC- and Dexamethasone-induced and non-induced PHs after 48 and 72 h, are shown in (Ba) and 6(Bb), respectively.
Figure 6 . Gene expression analysis of xenobiotic-metabolizing enzymes. (A,a) Cyp1a expression in control and 3-MC-induced PHs after 48 and 72 h, respectively. (A,b) Cyp3a expression in control and Dexamethasone-induced PHs after 48 and 72 h, respectively. Figures B,a and B, b show the gel images of PCR products. Gapdh served as the internal control. Letters ‘a,’ ‘b,’ ‘c,’ ‘d,’ ‘e,’ ‘f,’ and ‘g’ denote significant difference (p < 0.05) between control and induced PHs. All experiments were performed in five replicates.
Discussion
Primary hepatocytes have gain considerable attention in tissue engineering and human disease therapy; however, the development of a model culture system simulating the natural hepatic environment is greatly desired. In this study, we attempted a direct comparison between 2-D and 3-D culture systems for rat-derived PHs. PHs were isolated, and cultured in 2-D and 3-D. Furthermore, culture stability was evaluated by analyzing the expression of Alb, Tf, Afp, Cyp3a (Hepatic markers), and apoptotic markers (Bax and Bcl2). 3-MC and dexamethasone were used as model drugs to perform comparisons between both the culture systems.
For in vitro drug-toxicity testing, PHs are considered the ‘gold standard,’ and their functionality mainly depends on their polarization (Hewitt et al. Citation2007; Gomez-Lechon et al. Citation2008). Godoy et al. (Citation2009) reported that the culture of PHs in monolayers (2-D) results in morphological alteration, and cells initiate epithelial-to-mesenchymal transition, and in turn, PHs lose their polarity and hepatic-specific functions. PHs undergo progressive dedifferentiation, which is manifested as decreases in drug transporter levels along with loss in their phenotypic characteristics (Hu and Li Citation2015). However, various investigators have observed that freshly isolated PHs can be cultured in 3-D tightly packed structures or spheroids (Koide et al. Citation1990). These 3-D-cultured cells have demonstrated enhanced liver-specific functions and prolonged differentiation compared with cells maintained in monolayers. Herein, we reported normal polygonal morphology of PHs cultured in 2-D monolayers on collagen-coated plates as reported previously (Schyschka et al. Citation2013), albeit a constant decrease in the diameter of 3-D-cultured PHs was observed. The reason underlying this diameter-shrinkage phenomenon might be the strong interaction and attachment of cells within the scaffold, or increased apoptosis of central cells due to the insufficient transport of essential nutrients. Furthermore, after 7 days of in vitro culture, the expression of the hepatic-specific markers (Alb, Tf, Afp, and Cyp3a) were downregulated compared with the control (fresh PH), irrespective of the culture conditions. To evaluate the capability of PHs to retain their liver zonation ability (Bell et al. Citation2016), the expression of periportal (Albumin) and perivenous markers (CYP3A1) was analyzed by double immunofluorescence. There was no margination or zonation in either culture system; however, both proteins were co-expressed in the 2-D and 3-D culture systems after 2 and 7 days of culture, respectively. Our results deviated slightly from those reported by Bell et al. (Citation2016), and we suggested that differences in species, since we used rat PHs, and the culturing environment were the possible factors responsible for the deviation. The low expression of the hepatic-specific markers and the inability of PHs to maintain ‘liver-zonation identity’ revealed that the PHs lost their functionality in vitro irrespective of their culture environments, as we mentioned earlier that in vitro culture led to dedifferentiation and apoptosis in PHs.
The spontaneous apoptosis in the PH monolayer culture was classified into two peaks/events (Vinken et al. Citation2011). The first apoptosis event was likely to have resulted from cell damage during PH isolation, which gave rise to high Bax levels (Kucera et al. Citation2006). This was followed by a steady increase in caspase activity, followed by chromatin fragmentation. The second event was observed on the last day of in vitro culture. Furthermore, this adverse process relied primarily on apoptosis, and was probably a result of poor and unfavorable acclimatization of the hepatocytes to the artificial culture systems (Gill and Dive Citation2000; Bai et al. Citation2003; Vinken et al. Citation2011). Inherent to its programed nature, apoptosis results in major changes in the gene expression pattern of pro-apoptotic proteins and caspases, specifically caspase 3 (Gill and Dive Citation2000; Bai et al. Citation2003). In the same report, Vinken et al. (Citation2011) stated that the expression levels of both (Bid and Bax) Bcl2 family protein increased shortly after cell seeding; however, they were minimal on the first day of culture (day 0). However, their expression levels gradually increased, and were higher on the last day of culture. Our results concerning the apoptotic markers indicated a higher degree of the apoptosis of PHs in 2-D culture than the 3-D system, which were consistent with previous reports.
To further corroborate these findings, we induced PH in both culture systems with 3-MC and dexamethasone. 3-MC is a polycyclic aromatic hydrocarbon (PAH) bioactivated by cytochrome P450 (P450) 1A (Kondraganti et al. Citation2005). Cytochrome P450 is a superfamily of enzymes that are predominantly present in the mammalian liver, where they are involved in the metabolism of endogenous and exogenous (xenobiotic) compounds. The enzymes of three CYP (CYP1, CYP2, and CYP3) families are mainly involved in biotransformation and xenobiotic metabolism in rats and humans (Nedelcheva and Gut Citation1994). However, there are substantial differences in the expression and catalytic activity of CYPs between the two species. One of the oldest known CYP enzymes in rats is CYP1A, which is conserved throughout the species (Zuber et al. Citation2002). CYP1A1 mainly metabolizes PAHs, whereas CYP1A2 is responsible for the metabolism of heterocyclic amines, aromatic amines, and azobenzenes (Nebert and McKinnon Citation1994). Previously, the exposure of rats to 3-MC was reported to lead to sustained CYP1A induction for several weeks (Kondraganti et al. Citation2002). We detected higher Cyp1a expression in both the cultured systems (2-D and 3-D) after 48 and 72 h of induction with 3-MC. However, the level of Cyp1a expression was significantly higher in the 2-D culture system than the spheroid culture. Dexamethasone, which is a well-known Cyp3a inducer (Schuetz and Guzelian Citation1984; Huss and Kasper Citation2000) was used in the 2-D and 3-D culture systems for 48 and 72 h. Cyp3a is believed to be involved in the metabolism of 50% all novel drugs. Previously, dexamethasone was reported to modulate Cyp3a expression in rats via glucocorticoid receptors (GR); however, this proposition was further investigated, confirmed that dexamethasone modulates Cyp3a expression in rats via the pregnane X receptor (PXR), resulting in the increased expression of Cyp3a1/2 mRNA and proteins (Burger et al. Citation1992; Huss and Kasper Citation2000). Dexamethasone treatment has been shown to increase the expression levels of Cyp3a1/2 mRNA (8-fold) and proteins (10-fold) in a conventional monolayer culture system (Schuetz and Guzelian Citation1984). Our results also demonstrated a high level of Cyp3a mRNA after dexamethasone induction for 48 and 72 h, respectively, which were consistent with previous reports. The expression of both Cyp1a and Cyp3a in the 2-D-cultured induced cells exhibited a dramatic decrease, when the treatment time increased from 48 to 72 h; however, the 3-D-cultured induced cells exhibited uniform levels despite of low expression. These results suggested that 2-D culture systems are more efficient in the delivery of factors (chemicals, nutrients, and so on) than 3-D culture systems, owing to the structural complexity of the 3-D system, which ultimately impedes the supply of oxygen and other nutrients (Wu et al. Citation1996). 3-D culture systems are reported to be far better than 2-D systems (Schyschka et al. Citation2013); however, herein, we suggested that the difference in the results of the 3-D culture system was due to the different methods and parameters employed, i.e. rotation speed, different oxygen concentrations with the use of spinal flasks, low cell-binding dishes, and so on. (Sakai et al. Citation1996; Nyberg et al. Citation2005; Colleen et al. Citation2009). Hence, we suggested that the spheroid culture system used in this study could easily generate spheroids, but were unable to completely overcome scarcity of oxygen, nutrients, and other chemicals, and at 72 h, particularly, the 3-D culture maintained the expression of Cyp1a and Cyp3a compared with the 2-D culture. This phenomenon indicated the lower degree of apoptosis of the 3-D-cultured cells than the 2-D-cultured cells, which was also supported by the low apoptotic marker expression.
Conclusion
Rat primary hepatocytes, cultured in monolayers (2-D) and spheroids (3-D), lost their integrity and hepatic characteristics. The levels of hepatic markers and xenobiotic-metabolizing enzymes were downregulated after 7 days of in vitro culture. Apoptotic markers showed little higher cell death in 2-D culture. Furthermore, the mRNA levels of the xenobiotic-metabolizing enzymes were higher in the monolayer than the 3-D-cultured cells. We concluded that, regarding the quality of hepatocytes, no significant difference was observed between the PHs cultured in 2-D and 3-D, which suggested that further detailed studies are required to identify the components essential for in vitro rat PH culture rather than the culture system.
Disclosure statement
No potential conflict of interest was reported by the authors.
Additional information
Funding
References
- Bai L, Wang J, Yin XM, Dong Z. 2003. Analysis of apoptosis: basic principles and procedures. In: Yin XM, Dong Z, editors. Essentials of apoptosis: a guide for basic and clinical research. Totowa, NJ: Humana Press, p. 239–251.
- Bell CC, Hendriks DF, Moro SM, Ellis E, Walsh J, Renblom A, Fredriksson Puigvert L, Dankers AC, Jacobs F, Snoeys J, et al. 2016. Characterization of primary human hepatocyte spheroids as a model system for drug-induced liver injury, liver function and disease. Sci Rep. 6:25187. doi: 10.1038/srep25187
- Burger HJ, Schuetz JD, Schuetz EG, Guzelian PS. 1992. Paradoxical transcriptional activation of rat liver cytochrome P-450 3A1 by dexamethasone and the antiglucocorticoid pregnenolone 16 alpha-carbonitrile: analysis by transient transfection into primary monolayer cultures of adult rat hepatocytes. Proc Natl Acad Sci USA. 89:2145–2149. doi: 10.1073/pnas.89.6.2145
- Colleen MB, Jennifer LLW, Bruce PA, Harris K, Rory PR, Piero R, Scott LN. 2009. Rat hepatocyte spheroid formed by rocked technique maintain differentiated hepatocyte gene expression and function. Hepatology. 49(2):578–86. doi: 10.1002/hep.22674
- Duan BW, Lu SC, Wang ML, Liu JN, Chi P, Lai W, Wu JS, Guo QL, Lin DD, Liu Y, et al. 2013. Liver transplantation in acute-on-chronic liver failure patients with high model for end-stage liver disease (MELD) scores: a single center experience of 100 consecutive cases. J Surg. Res183:936–943.
- Dunn JC, Yarmush ML, Koebe HG, Tompkins RG. 1989. Hepatocyte function and extracellular matrix geometry: long-term culture in a sandwich configuration. FASEB J. 3:174–177.
- Gill GH, Dive D. 2000. Apoptosis: basic mechanisms and relevance to toxicology. Apoptosis in toxicology. London: Taylor & Francis. p. 1–20.
- Godoy P, Hengstler JG, Ilkavets I, Meyer C, Bachmann A, Muller A, Tuschl G, Mueller SO, Dooley S. 2009. Extracellular matrix modulates sensitivity of hepatocytes to fibroblastoid dedifferentiation and transforming growth factor beta-induced apoptosis. Hepatology. 49:2031–2043. doi: 10.1002/hep.22880
- Gomez-Lechon MJ, Castell JV, Donato MT. 2008. An update on metabolism studies using human hepatocytes in primary culture. Expert Opin Drug Metab Toxicol. 4:837–854. doi: 10.1517/17425255.4.7.837
- Hewitt NJ, Lechon MJ, Houston JB, Hallifax D, Brown HS, Maurel P, Kenna JG, Gustavsson L, Lohmann C, Skonberg C, et al. 2007. Primary hepatocytes: current understanding of the regulation of metabolic enzymes and transporter proteins, and pharmaceutical practice for the use of hepatocytes in metabolism, enzyme induction, transporter, clearance, and hepatotoxicity studies. Drug Metab Rev. 39:159–234. doi: 10.1080/03602530601093489
- Hong EJ, Levasseur MP, Dufour CR, Perry MC, Giguere V. 2013. Loss of estrogen-related receptor alpha promotes hepatocarcinogenesis development via metabolic and inflammatory disturbances. Proc Natl Acad Sci USA. PNAS. 110:17975–17980. doi: 10.1073/pnas.1315319110
- Hu C, Li L. 2015. In vitro culture of isolated primary hepatocytes and stem cell-derived hepatocyte-like cells for liver regeneration. Protein Cell. 6:562–574. doi: 10.1007/s13238-015-0180-2
- Huss JM, Kasper CB. 2000. Two-stage glucocorticoid induction of CYP3A23 through both the glucocorticoid and pregnane X receptors. Mol Pharmacol. 58:48–57.
- Koide N, Sakaguchi K, Koide Y, Asano K, Kawaguchi M, Matsushima H, Takenami T, Shinji T, Mori M, Tsuji T. 1990. Formation of multicellular spheroids composed of adult rat hepatocytes in dishes with positively charged surfaces and under other nonadherent environments. Exp Cell Res. 186:227–235. doi: 10.1016/0014-4827(90)90300-Y
- Kondraganti SR, Jiang W, Moorthy B. 2002. Differential regulation of expression of hepatic and pulmonary cytochrome P4501A enzymes by 3-methylcholanthrene in mice lacking the CYP1A2 gene. J Pharmacol Exp Ther. 303:945–951. doi: 10.1124/jpet.102.039982
- Kondraganti SR, Muthiah K, Jiang W, Barrios R, Moorthy B. 2005. Effects of 3-methylcholanthrene on gene expression profiling in the rat using cDNA microarray analyses. Chem Res Toxicol. 18:1634–1641. doi: 10.1021/tx050085n
- Kucera T, Canova NK, Farghali H, Martinek J. 2006. The morphological and immunocytochemical evaluation of primary rat hepatocytes undergoing spontaneous cell death: modulation by the nitric oxide donor S-nitroso-N-acetylpenicillamine. Biomed Pap Med Fac Univ Palacky Olomouc Czech Repub. 150:75–82. doi: 10.5507/bp.2006.008
- Lu C, Li AP. 2001. Species comparison in P450 induction: effects of dexamethasone, omeprazole, and rifampin on P450 isoforms 1A and 3A in primary cultured hepatocytes from man, Sprague-Dawley rat, minipig, and beagle dog. Chem Biol Interact. 134:271–281.
- Michalopoulos GK, DeFrances MC. 1997. Liver regeneration. Science. 276:60–66. doi: 10.1126/science.276.5309.60
- Miyazawa M, Torii T, Toshimitsu Y, Okada K, Koyama I. 2007. Hepatocyte dynamics in a three-dimensional rotating bioreactor. J Gastroenterol Hepatol. 22:1959–1964. doi: 10.1111/j.1440-1746.2006.04755.x
- Nahmias Y, Berthiaume F, Yarmush ML. 2007. Integration of technologies for hepatic tissue engineering. Adv Biochem Eng Biotechnol. 103:309–329.
- Nebert DW, McKinnon RA. 1994. Cytochrome P450: evolution and functional diversity. Prog Liver Dis. 12:63–97.
- Nedelcheva V, Gut I. 1994. P450 in the rat and man: methods of investigation, substrate specificities and relevance to cancer. Xenobiotica. 24:1151–1175. doi: 10.3109/00498259409038673
- Nyberg SL, Hardin J, Amiot B, Argikar UA, Remmel RP, Rinaldo P. 2005. Rapid, large-scale formation of porcine hepatocyte spheroids in a novel spheroid reservoir bioartificial liver. Liver Transpl. 11:901–910. doi: 10.1002/lt.20446
- Sakai Y, Naruse K, Nagashima I, Muto T, Suzuki M. 1996. Large-scale preparation and function of porcine hepatocyte spheroids. Int J Artif Organs. 19:294–301.
- Schuetz EG, Guzelian PS. 1984. Induction of cytochrome P-450 by glucocorticoids in rat liver. II. Evidence that glucocorticoids regulate induction of cytochrome P-450 by a nonclassical receptor mechanism. J Appl Biol Chem. 259:2007–2012.
- Schyschka L, Sanchez JJ, Wang Z, Burkhardt B, Muller-Vieira U, Zeilinger K, Bachmann A, Nadalin S, Damm G, Nussler AK. 2013. Hepatic 3D cultures but not 2D cultures preserve specific transporter activity for acetaminophen-induced hepatotoxicity. Arch Toxicol. 87:1581–1593. doi: 10.1007/s00204-013-1080-y
- Seglen PO. 1976. Preparation of isolated rat liver cells. Methods Cell Biol. 13:29–83. doi: 10.1016/S0091-679X(08)61797-5
- Shen L, Hillebrand A, Wang DQ, Liu M. 2012. Isolation and primary culture of rat hepatic cells. J Vis Exp. 29:1–4.
- Shulman M, Nahmias Y. 2013. Long-term culture and coculture of primary rat and human hepatocytes. Methods Mol Biol. 945:287–302. doi: 10.1007/978-1-62703-125-7_17
- Taub R. 2004. Liver regeneration: from myth to mechanism. Nature Rev Mol Cell Biol. 5:836–847. doi: 10.1038/nrm1489
- Vinken M, Decrock E, Doktorova T, Ramboer E, De Vuyst E, Vanhaecke T, Leybaert L, Rogiers V. 2011. Characterization of spontaneous cell death in monolayer cultures of primary hepatocytes. Arch Toxicol. 85:1589–1596. doi: 10.1007/s00204-011-0703-4
- Wojcikowski J, Haduch A, Daniel WA. 2012. Effect of classic and a typical neuroleptics on cytochrome P450 3A (CYP3A1) in rat liver. Pharmacol Rep. 64:1411–1418. doi: 10.1016/S1734-1140(12)70938-6
- Wu FJ, Friend JR, Hsiao CC, Zilliox MJ, Ko WJ, Cerra FB, Hu WS. 1996. Efficient assembly of rat hepatocyte spheroids for tissue engineering applications. Biotechnol Bioeng. 50:404–415.
- Zuber R, Anzenbacherova E, Anzenbacher P. 2002. Cytochromes P450 and experimental models of drug metabolism. J Cell Mol Med. 6:189–198. doi: 10.1111/j.1582-4934.2002.tb00186.x