
ABSTRACT
The aim of this study was to compare the functional characteristics of mesenchymal stromal cells (MSCs) from a sheep model of traumatic temporomandibular joint (TMJ) fibrous and bony ankylosis. A sheep model of bilateral TMJ trauma-induced fibrous ankylosis on one side and bony ankylosis on the contralateral side was used. MSCs from fibrous ankylosed callus (FA-MSCs) or bony ankylosed callus (BA-MSCs) at weeks 1, 2, 4, and 8 after surgery were isolated and cultured. MSCs derived from the bone marrow of the mandibular condyle (BM-MSCs) were used as controls. The MSCs from the different sources were characterized morphologically, phenotypically, and functionally. Adherence and trilineage differentiation potential were presented in the ovine MSCs. These cell populations highly positively expressed MSC-associated specific markers, namely CD29, CD44, and CD166, but lacked CD31 and CD45 expressions. The BA-MSCs had higher clonogenic and proliferative potentials than the FA-MSCs. The BA-MSCs also showed higher osteogenic and chondrogenic potentials, but lower adipogenic capacity than the FA-MSCs. In addition, the BA-MSCs demonstrated higher chondrogenic, but lower osteogenic capacity than the BM-MSCs. Our study suggests that inhibition of the osteogenic and chondrogenic differentiations of MSCs might be a promising strategy for preventing bony ankylosis in the future.
1. Introduction
As one of the severe complications secondary to temporomandibular joint (TMJ) trauma (Yan et al. Citation2014b; Cho et al. Citation2016), TMJ ankylosis can be histologically classified into fibrous, fibro-osseous, and bony ankylosis (Chidzonga Citation1999). Considering the relatively mild clinical presentations and relatively good prognosis of patients with fibrous ankylosis (Sawhney Citation1986; Zhang and He Citation2006), one promising approach to prevent TMJ bony ankylosis might be the conversion of bony ankylosis into fibrous ankylosis, which largely depends on advanced understanding of the cellular and molecular mechanisms involved in the two types of TMJ ankylosis.
Animal models are considered essential components of research on TMJ ankylosis because of the difficulties in acquiring clinical specimens (Xiao et al. Citation2013; He et al. Citation2015). Sheep is the primary experimental large animal model used in research studies on TMJ diseases because of its physiological similarities to humans, the low cost relative to other large animals, the ethical acceptability, and the convenience of keeping and handling it. In our previous studies, a reliable sheep model was established in which the TMJ received either severe trauma to induce bony ankylosis or minor trauma to induce fibrous ankylosis (Yan et al. Citation2013; Liang et al. Citation2019). How the traumatic microenvironment influenced the outcomes, either fibrous or bony ankylosis, is interesting but remains unclear.
During bone healing, mesenchymal stromal cells (MSCs) participate in the restoration of bone anatomy continuity and functional integrity by differentiating into osteoblasts, chondrocytes, and secreting bone matrix and growth factors (Andrzejewska et al. Citation2019). Changes in the function of MSCs may lead to abnormal bone repair (Giai Via et al. Citation2018). Recently, Xiao et al. (Citation2013) isolated and identified MSCs from human TMJ ankylosed callus and observed that their proliferation and osteogenic differentiation capacities were lower than those of MSCs from mandibular bone marrow (BM). However, Xiao et al. (Citation2013) only studied samples from patients with bony ankylosis. Thus, whether the ankylosed callus from fibrous ankylosis also contained MSCs could not be determined. Moreover, whether functional differences exist between the MSCs from the patients with fibrous ankylosis and those from the patients with bony ankylosis remain to be elucidated. We hypothesized that traumatic microenvironments might change the functions of MSCs, thus resulting in different types of ankylosis.
The aim of this study was to compare the functional characteristics of MSCs from our previously established ovine model of fibrous and bony ankylosis. To facilitate the comparison of different studies, MSCs from normal condylar BM were also included in the study.
2. Materials and methods
2.1. Animals, surgical procedure and tissue harvesting
Twelve 3-month-old male sheep of the local strain Xiaowei-Han, with a mean preoperative weight of 26 ± 2.1 kg, received bilateral TMJ surgery, as described previously (Yan et al. Citation2013; Liang et al. Citation2019) for the induction of fibrous ankylosis on one side and bony ankylosis on the other side. This study was approved by the ethics committees of Tianjin Stomatological Hospital (Tjskq2013001). All the animal experiments were conducted following national regulations for the care and use of laboratory animals as previously described (Wang et al. Citation2018).
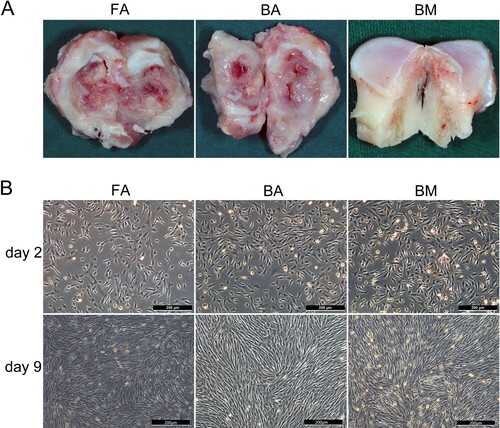
Newly generated fibrous or bony ankylosed callus in the bilateral joint spaces were harvested ((A)) on days 7, 14, 28, and 56 postoperatively after the animals were sacrificed through euthanasia. To obtain MSCs from the BM of the mandibular condyle as controls, another three male sheep (3 months old) were sacrificed, and the cancellous bone at the center area of the condyle was collected ((A)).
Figure 1. Tissue harvesting, cell culture, and morphological characterization. (A) The site of tissue harvesting for ankylosed callus or cancellous bone of the condyle. (B) FA-MSCs, BA-MSCs, and BM-MSCs showing similar morphologies on days 2 and 9. Scale bar, 200 μm. FA, fibrous ankylosis; BA, bony ankylosis; BM, bone marrow; MSCs, mesenchymal stromal cells.
2.2. Isolation of MSCs and cell culture
The ankylosed callus was repeatedly rinsed with phosphate-buffer saline (PBS; Solaibao) containing 100 U/ml penicillin (Gibco) and 100 μg/ml streptomycin (Gibco), cut into 0.5–1.0-mm3 pieces, and digested with 0.2% pronase E and collagenase I (Solaibao) for 45 min up to 1 h until the tissue was viscous. Then, the digestion was terminated by adding growth medium (α-MEM [Hyclone] supplemented with 10% fetal bovine serum [FBS; Gibco], 100 U/ml penicillin [Gibco], 100 μg/ml streptomycin [Gibco], and 1% L-glutamine [Gibco]) fivefold the volume of the digestive solution. Next, the digestive liquid was filtered through a 70-μm cell strainer (BD Falcon), thereby obtaining a single-cell suspension. After centrifugation for 5 min at 1000 rpm, the precipitated pellets were collected as ankylosed callus-derived cells. A similar method was performed to obtain BM-derived cells, except that the digestion time was shortened to 30–45 min.
All the collected pellets were resuspended in the growth medium, and the cells were incubated at 37°C, with 5% CO2. When the cell confluence reached approximately 80% ((B)), the adherent cells were detached using trypsin (0.25% trypsin; 1mM EDTA, Gibco) and plated at a seeding density of 1 × 10⁵ cells/100-mm dish. After at least three passages, the MSCs were collected and used for subsequent experiments.
The MSCs from the BM of the mandibular condyle were designated as the BM-MSCs group (n = 3). The MSCs from the fibrous ankylosed callus were collectively called FA-MSCs, and the FA-MSCs collected from 1, 2, 4, and 8 weeks after surgery (n = 3) were designated as the FA-MSCs-1W, FA-MSCs-2W, FA-MSCs-4W, and FA-MSCs-8W groups, respectively. Similar nomenclature was also applied for the BA-MSCs, the BA-MSCs-1W, BA-MSCs-2W, BA-MSCs-4W, and BA-MSCs-8W groups.
2.3. Flow cytometry
The third-passage cells were digested with 0.25% trypsin to collect a single-cell suspension. After centrifugation, the cells were resuspended with PBS containing 1% FBS. With the corresponding commercial monoclonal antibody, 1 × 10⁶ cells were incubated for 30 min at 4°C in the dark (Table S1), and then measured with FACSCanto (BD Biosciences). The data were analyzed with the FACSDiva (BD Biosciences) and FlowJo software (TreeStarInc, Ashland, OR).
2.4. Immunofluorescence staining
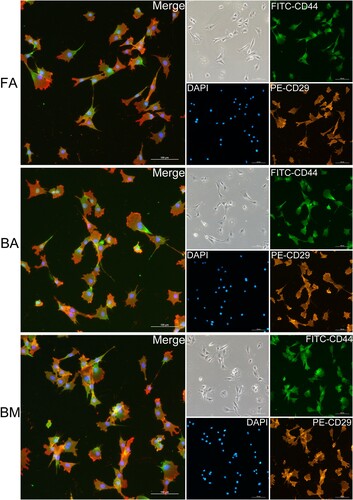
The third-passage cells were seeded at a density of 1 × 10⁴/ml in a confocal dish (Nest). After the cells were completely attached on the next day, they were fixed with 4% paraformaldehyde for 10 min and blocked with 1% bovine serum albumin (BSA, Sigma) for 30 min at room temperature. Then the cells were incubated for 45 min at 4°C in the dark with phycoerythrin (PE)-conjugated anti-human CD29 monoclonal antibody (clone: TS2/16, BioLegend BD, ref. 303003; Table S1) and fluorescein isothiocyanate (FITC)-conjugated anti-sheep CD44 antibody (clone: 25.32, AbD Serotec, ref. MCA2219F; Table S1). The corresponding isotype control IgG was simultaneously incubated as a negative control (Table S1). Finally, the cells were counterstained with 4′,6-diamidino-2-phenylindole (DAPI; 1 μg/ml; Solarbio) for 15 min. The fluorescently labeled cells were visualized and photographed using an inverted fluorescence microscope (Nikon Ti-S).
2.5. Colony-forming unit assay
The third-passage cells were seeded at a density of 200 cells in a 100-mm culture dish (Corning). On day 11, the cells were fixed with 4% paraformaldehyde and stained with 0.5% crystal violet (Solarbio). Colonies containing > 50 cells under microscopy were counted. The percentage of colony-forming efficiency was expressed as the total number of colonies divided by the initial number of cells that were seeded and multiplied by 100 (Huang et al. Citation2009).
2.6. Cell proliferation assay
The third-passage cells were seeded at a density of 2 × 10⁴/ml in a 96-well plate (Corning). After culturing for 24, 48, 72, 96, 120, 144, 168, or 192 h, 10μl of cell counting kit-8 (CCK-8) solution (Dojindo, Japan) was added to each well of the plate, and the cells were incubated away from light for 4 h at 37°C. The absorbance of each well at 450 nm was measured using an enzyme labeling instrument (Multiskan Ascent, Thermo), and the growth curves were drawn for 8 days.
2.7. In vitro trilineage differentiation assays
At the third passage, the MSCs were differentiated towards three mesenchymal lineages, namely osteoblast, adipocyte and chondrocyte.
2.7.1. Osteogenic differentiation
The third-passage cells were seeded at a density of 1 × 10⁵/ml in a 35-mm culture dish (Corning). When the cell confluence reached 60–70%, the medium was replaced with an osteogenic differentiation medium (α-MEM medium supplemented with 10% FBS, 100-U/ml penicillin, 100-μg/ml streptomycin, 1% L-glutamine, 10-nM dexamethasone, 50-μg/ml L-ascorbic acid, and 10-mM β-glycerophosphate [Sigma-Aldrich]). After induction for 14 days, the cells were stained with 1% Alizarin Red (pH = 4.3, Solarbio). The mRNA expression levels of alkaline phosphatase (ALP), Runt-related transcription factor 2 (Runx2), Osterix/zinc finger protein Osterix (OSX), and osteocalcin (OCN) were measured with real-time polymerase chain reaction (PCR) after induction for 1 or 2 weeks.
2.7.2. Adipogenic differentiation
The third-passage cells were seeded at a density of 1 × 10⁵/ml in a 35-mm culture dish (Corning). When the cell confluence reached approximately 90%, the medium was replaced with an adipogenic medium (α-MEM medium supplemented with 10% FBS, 100-U/ml penicillin, 100-μg/ml streptomycin, 1% L-glutamine, 1 μM dexamethasone, 0.2 mM indomethacin, 0.5 mM 3-isobutyl-methylxanthine, 10-µg/ml insulin [Sigma-Aldrich]). After induction for 21 days, the cells were stained with Oil Red O (Solarbio). The mRNA expression level of peroxisome proliferator-activated receptor gamma (PPAR-γ) was measured with real-time PCR.
2.7.3. Chondrogenic differentiation
The third-passage cells were seeded at a density of 5 × 10⁵/ml in a 15-mL polypropylene tube (Corning) and centrifuged at 1500 rpm for 5 min to form cell pellets, which were cultured in an MSC chondrogenic differentiation medium (Cyagen, China, ref. HUXMA-9004) for 28 days and then embedded in paraffin wax blocks. The blocks were cut into 4-μm-thick sections and stained with 1% Alcian blue (Sigma) to reveal the mucopolysaccharide matrix. Immunohistochemistry for type II collagen (Solarbio) was performed in accordance with the manufacturer's instructions. The mRNA expression levels of type 2, alpha 1 (Col2A1), and SRY (sex-determining region Y)-box 9 (SOX9) were measured with real-time PCR.
2.8. Total RNA extraction and real-time PCR
Total RNA was isolated from the cells using the Trizol reagent (Invitrogen, Carlsbad, USA) in accordance with the manufacturer’s instructions, and cDNA was extracted using reverse transcription with a synthesis kit (Promega, USA). Quantitative real-time PCR was performed with FastStart Universal SYBR Green Master (Roche, ref. 04913850001) using the LightCycler 480 II Instrument (Roche, Switzerland). The primers are listed in Table S2. The reaction system and PCR cycle parameters were the same as previously described (Liang et al. Citation2019). The housekeeping glyceraldehyde-3-phosphate dehydrogenase (GAPDH) gene was used for normalization of the target gene expression. The relative mRNA expression level of the target gene was calculated as previously described (Liang et al. Citation2019).
2.9. Statistical analysis
First, the Kolmogorov-Smirnov test was performed to judge the normality of the data. For data with a Gaussian distribution, one-way analysis of variance was performed using SPSS17.0. Post hoc multiple comparisons between groups were performed using the SNK test when equal variances were assumed or using the Dunnett T3 test when equal variances were not assumed. For data with a non-Gaussian distribution, the Kruskal-Wallis test was applied using the GraphPad Prism 7 software, and multiple comparisons between the groups were performed using the Dunn post hoc test. Statistical significance was defined as P < .05.
3. Results
3.1. Cell isolation and morphologic characterization
Characteristic spindle-shaped or fibroblast-like adherent cell cultures were established from normal condylar BM and ankylosed callus. The cells completely adhered to plastic and stretched after 1–2 days, reaching approximately 90% confluence after 9 days ((B)).
3.2. Immunophenotypic characterization of FA-MSCs, BA-MSCs, and BM-MSCs
We found that anti-human CD29 (clone MAR4), CD44 (clone G44-26), and CD90, and anti-mouse CD73 and CD105, which reacted to the MSCs of the corresponding species, did not show reactivity to the sheep MSCs ((A)).
Figure 2. Phenotypic characterization of FA-MSCs, BA-MSCs, and BM-MSCs by flow cytometry. The green curve signifies the specific antibody, while the orange curve represents the isotype control. (A) Several commercial monoclonal antibodies that react with human or mouse MSCs but show no reactivity to ovine MSCs. (B) Markers characteristic of MSCs and hematopoietic cells that react with sheep. (C) and (D) Bar graph representing the percentage mean values (mean ± standard deviation) of the positivity of the following markers analyzed from three samples: characteristic markers of MSCs (CD29, CD44, and CD166) and hematopoietic cells (CD31 and CD45). FA, fibrous ankylosis; BA, bony ankylosis; BM, bone marrow; MSCs, mesenchymal stromal cells.
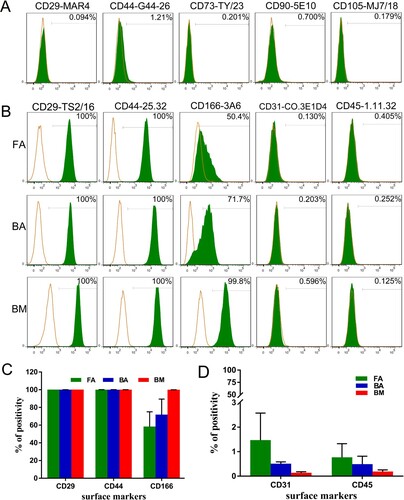
Anti-human CD29 (clone TS2/16) showed positivity rates of 99.98% ± 0.04% for FA-MSCs, 100% ± 0% for BA-MSCs, and 100% ± 0% for BM-MSCs ((B,C)). Anti-human CD166 showed positivity rates of 58.2% ± 11.2% for FA-MSCs, 71.85% ± 12.45% for BA-MSCs, and 99.85% ± 0.05% for BM-MSCs ((B,C)). Anti-sheep CD44 showed positivity rates of 99.9% ± 0.17% for FA-MSCs, 99.83% ± 0.25% for BA-MSCs, and 99.95% ± 0.05% for BM-MSCs ((B,C)). In addition, the co-expressions of CD29 (clone TS2/16) and CD44 (clone 25.32) at the single-cell level for FA-MSCs, BA-MSCs, and BM-MSCs were confirmed by immunofluorescence analysis ().
Figure 3. Immunofluorescence staining of FA-MSCs, BA-MSCs, and BM-MSCs. All nuclei are stained with DAPI (blue). Co-expressions of CD29 (clone TS2/16) and CD44 (clone 25.32) by different groups of MSCs are confirmed. Scale bar: 100 μm. FA, fibrous ankylosis; BA, bony ankylosis; BM, bone marrow; MSCs, mesenchymal stromal cells.
The FA-MSCs, BA-MSCs, and BM-MSCs were negative for anti-sheep CD31 and CD45 expressions, indicating no contamination with cells of hematopoietic origin ((B,D)).
3.3. BA-MSCs have higher clonogenic and proliferative potential than FA-MSCs
The colonies from the nine groups of MSCs were heterogeneous in size and cell density, reflecting differences in cell proliferation rates ((A,B)). The mean colony-forming efficiencies were as follows: 16.00 ± 2.00 (FA-MSCs-1W), 46.00 ± 3.61 (BA-MSCs-1W), 24.00 ± 5.20 (FA-MSCs-2W), 44.70 ± 2.00 (BA-MSCs-2W), 28.17 ± 2.75 (FA-MSCs-4W), 48.67 ± 3.46 (BA-MSCs-4W), 19.83 ± 9.38 (FA-MSCs-8W), 46.50 ± 1.47 (BA-MSCs-8W), and 65.50 ± 4.02 (BM-MSCs).
Figure 4. Clonogenic abilities and cell proliferation analysis. (A) and (B) The colony-forming unit assay showing different clonogenic potentials in the nine groups of MSCs stained with violet crystal. (C) Bar graph representing the mean colony-forming efficiency (mean ± standard deviation) analyzed from three samples. *P < .05. (D) Cell proliferation analysis using the CCK-8 assay. Data are displayed as mean ± standard deviation analyzed from the three samples. *P < .05 (FA-MSCs vs. BM-MSCs), #P < .05 (BA-MSCs vs. BM-MSCs), and $P < .05 (BA-MSCs vs. FA-MSCs). FA, fibrous ankylosis; BA, bony ankylosis; BM, bone marrow; MSCs, mesenchymal stromal cells.
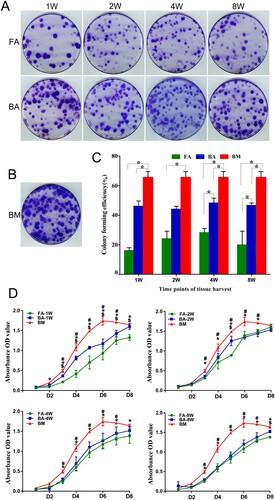
The BM-MSCs showed significantly higher colony-forming efficiency than the FA-MSCs and BA-MSCs (except for the BA-MSCs-2W; P < .05; (C)). The BA-MSCs had significantly higher colony-forming efficiency than the FA-MSCs at 4 and 8 weeks postoperatively (P < .05; (C)).
The cell proliferation curves showed that the BM-MSCs had significantly higher viability than the FA-MSCs and BA-MSCs from days 2 to 8 (P < .05; (D)). Regarding the proliferative differences between the FA-MSCs and BA-MSCs, the BA-MSCs-1W group showed significantly higher viability than the FA-MSCs-1W group from days 3 to 8 (P < .05; (D)). The BA-MSCs-2W group showed significantly higher viability than the FA-MSCs-2W group on day 5 (P < .05; (D)). The BA-MSCs-8W group showed significantly higher viability than the FA-MSCs-8W group on day 8 (P < .05; (D)).
3.4. BA-MSCs have higher osteogenesis potential than FA-MSCs
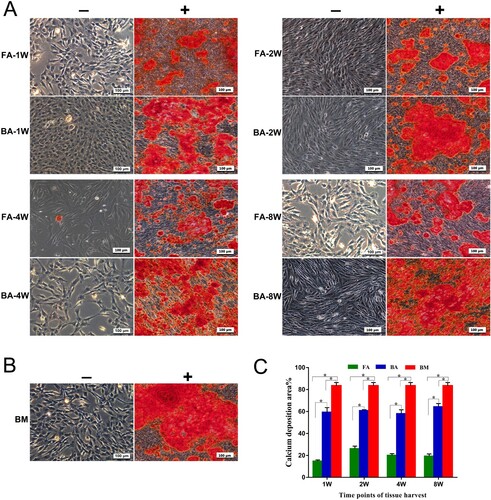
The 14-day-stimulated MSCs populations in each group showed an extracellular calcium deposition in comparison with the negativity of alizarin red staining for cells in the control medium ((A,B)). The area ratio of calcium deposition for the 14-day-stimulated MSCs in the BA-MSCs group was significantly greater than that in the FA-MSCs group, but significantly lower than that in the BM-MSCs group (P < .05, (C)), which indicated that the osteogenesis potential was BM-MSCs > BA-MSCs > FA-MSCs.
Figure 5. Osteogenic differentiation assay for the detection of calcium deposits using alizarin red (AR) stain. (A) and (B) Mineralized calcium nodules in an osteogenic differentiation medium (+) after culture for 14 days compared with the negative AR staining in the control medium (−) for each group of MSCs. Scale bar: 100 μm. (C) Bar graph representing the percentage of area with positive staining for AR, expressed as mean ± standard deviation. Calcium deposits were measured in three independent samples for each group (n = 3). *P < .05. FA, fibrous ankylosis; BA, bony ankylosis; BM, bone marrow; MSCs, mesenchymal stromal cells.
After 7 days of osteogenic induction, the expression levels of Runx2 and OSX in both the BA-MSCs and FA-MSCs groups were significantly lower than those in the BM-MSCs groups (except for Runx2 in the BA-MSCs-8W group; P < .05, (A)). The expression levels of ALP and OCN in both the BA-MSC and FA-MSC groups tended to be lower than those in the BM-MSC group, but the differences were not statistically significant ((A)). Comparing the expression levels of the four genes between the BA-MSC and FA-MSC groups, we found that the expression level of ALP in the BA-MSCs-2W group was significantly higher (9.7-fold) than that in the FA-MSCs-2W group (P < .05; (A)). Similarly, the expression level of OCN in the BA-MSCs-4W group was significantly higher (4.5-fold) than that in the FA-MSCs-4W group (P < .05; (A)). The expression levels of Runx2, OCN, and OSX in the BA-MSCs-8W group were significantly higher (by 3.4-, 7.0-, and 4.2-fold, respectively) than those in the FA-MSCs-8W group (P < .05; (A)).
Figure 6. Osteogenic differentiation potential confirmed by the detection of the expressions of the osteoblast marker genes by using quantitative real-time polymerase chain reaction. (A) Analysis of the expressions of the osteogenic-specific genes for the 7-day stimulated MSC populations. (B) Analysis of the expressions of the osteogenic-specific genes for the 14-day stimulated MSCs populations. mRNA levels were measured in three independent samples (n = 3). Data are expressed as mean ± standard deviation. *P < .05. FA, fibrous ankylosis; BA, bony ankylosis; BM, bone marrow; MSCs, mesenchymal stromal cells.
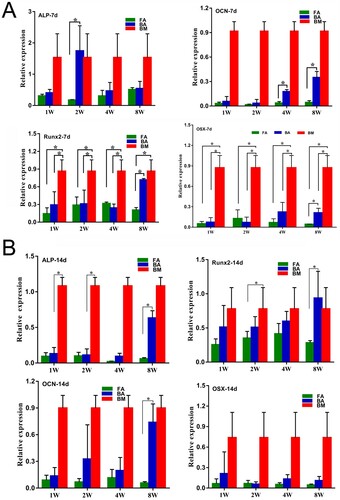
After 14 days of osteogenic induction, the expression levels of ALP, Runx2, and OCN in the BA-MSCs-8W were significantly higher (by 10.5-, 3.3-, and 12.3-fold, respectively) than those in the FA-MSCs-8W (P < .05; (B)). The expression level of ALP in the BM-MSCs group was significantly higher than those in the BA-MSCs-1W (by 8.3-fold) and BA-MSCs-2W groups (by 9.8-fold; P < .05; (B)). The expression level of Runx2 was significantly higher (by 2.2-fold) in the BM-MSC group than in the FA-MSC-2W group (P < .05; (B)).
3.5. BA-MSCs have higher chondrogenesis potential than FA-MSCs
After 4 weeks of induction, the pellets were positive for Alcian blue staining in the chondrogenic medium ((A,C)), indicating the presence of glycosaminoglycans in the extracellular matrix, but negative for Alcian blue staining in the control medium ((A,C)). Immunostaining for type II collagen was more prominent in the pellets under the chondrogenic conditions than under the control conditions ((B,D)).
Figure 7. Chondrogenic differentiation capabilities of the nine groups of MSCs. (A)–(D) MSCs in a 21-day micromass culture with non-differentiation control (−) and chondrogenic differentiation media (+). (A) and (C) Micromasses stained with Alcian blue. (B) and (D) Immunodetection of type II collagen assessed in micromasses. Scale bar: 100 μm. (E) Quantitative real-time polymerase chain reaction measurements of the expression levels of the chondrogenic markers Sox9 and Col2a1. mRNA levels were measured in three independent samples (n = 3). Data are expressed as mean ± standard deviation. *P < .05. FA, fibrous ankylosis; BA, bony ankylosis; BM, bone marrow; MSCs, mesenchymal stromal cells.
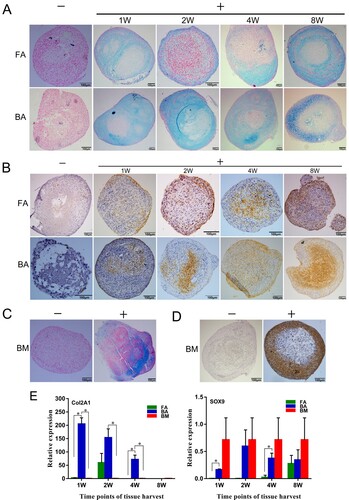
The expression level of Col2a1 in the BA-MSCs-1W group was significantly higher than those in the FA-MSCs-1W and BM-MSCs groups (P < .05; (E)). Similarly, the expression level of Col2a1 in the BA-MSCs-4W group was significantly higher than those in the FA-MSCs-4W and BM-MSCs groups (P < .05; (E)). The cells in the BA-MSCs-2W group expressed elevated levels of Col2a1 compared with those in the BM-MSCs group (P < .05; (E)). Regarding the expression levels of Sox9, we found significantly higher expression levels in the BA-MSCs-1W group than in the FA-MSCs-1W group and in the BA-MSCs-4W group than in the FA-MSCs-4W group (P < .05; (E)).
3.6. FA-MSCs have higher adipogenic potential than BA-MSCs
After 21 days of adipogenic induction, the MSCs stained positive for Oil Red O stain, indicating the presence of adipocytic multivacuolar cells secreting lipid droplets ((A,B)). However, the 21-day non-stimulated MSCs showed no or much weaker staining for lipids than stimulated MSCs ((A,B)).
Figure 8. Adipogenic differentiation capabilities of the nine groups of MSCs. (A) and (B) MSCs are cultured for 21 days in non-differentiation control (−) and adipogenic differentiation media (+). The presence of adipocytes was assessed by detection of lipid drops using Oil Red O stain. Scale bar: 100 μm. (C) Quantitative real-time polymerase chain reaction measurements of the expression levels of the adipogenic marker PPARγ. mRNA levels were measured in three independent samples (n = 3). Data are expressed as mean ± standard deviation. *P < .05. FA, fibrous ankylosis; BA, bony ankylosis; BM, bone marrow; MSCs, mesenchymal stromal cells.
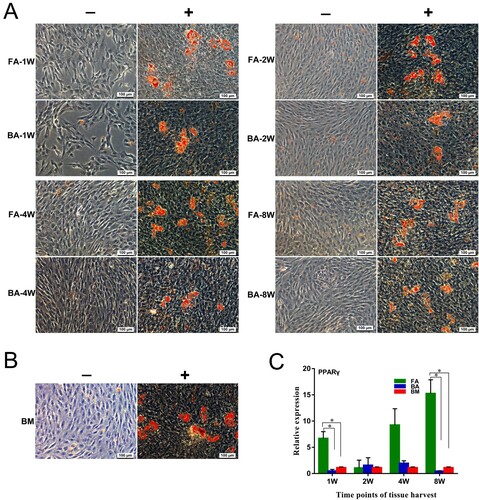
The expression level of PPARγ in the FA-MSCs-1W group was significantly higher than those in the BA-MSCs-1W and BM-MSC groups (P < .05; (C)). Similarly, the expression level of PPARγ in the FA-MSCs-8W group was significantly higher than those in the BA-MSCs-8W and BM-MSC groups (P < .05; (C)).
4. Discussion
Previous studies have reported the isolation of ovine MSCs from BM (Godoy et al. Citation2014; Sanjurjo-Rodriguez et al. Citation2017; Ghaneialvar et al. Citation2018; Vivas et al. Citation2018; Haddouti et al. Citation2020), cartilage (Caminal et al. Citation2016), adipose tissue (Heidari et al. Citation2013; Godoy et al. Citation2014), liver (Godoy et al. Citation2014), endometrium (Letouzey et al. Citation2015), olfactory mucosa (Veron et al. Citation2018), umbilical cord blood (Zhao et al. Citation2019), peripheral blood (Gronthos et al. Citation2009), amniotic fluid (Colosimo et al. Citation2013; Tian et al. Citation2016), dermis (Cui et al. Citation2014; Jahroomishirazi et al. Citation2014), hair follicles (Koobatian et al. Citation2015), synovial membrane (Godoy et al. Citation2014), dental pulp (Mrozik et al. Citation2010), and periodontal ligament (Gronthos et al. Citation2006). However, ovine MSCs are still not well characterized and remain unstandardized compared with human MSCs in regard to their isolation, expansion, media formulation, cell surface expression, and differentiation (Haddouti et al. Citation2020). Accordingly, the primary aim of this study was to perform extensive morphological, immunophenotypical, and functional characterizations of ovine MSCs from TMJ ankylosed callus and the BM of the mandibular condyle.
We found that sheep MSCs could adhere to plastic. They showed typical fusiform morphological characteristics, and formed colonies efficiently. They could differentiate into osteoblasts, chondrocytes, and adipocytes under appropriate inductions. However, we had difficulty selecting suitable markers to identify sheep MSCs because of the limited availability of commercial antibodies specific for sheep. In addition, sheep MSCs might not consistently express the same classic markers (e.g. CD73, CD90, and CD105) as human MSCs (Mrugala et al. Citation2008; McCarty et al. Citation2009; Rozemuller et al. Citation2010; Desantis et al. Citation2015; Letouzey et al. Citation2015; Soltani et al. Citation2016; Sanjurjo-Rodriguez et al. Citation2017; Ghaneialvar et al. Citation2018; Music et al. Citation2018). However, other studies reported high expression levels of CD73, CD90, and CD105 in sheep MSCs (Khan et al. Citation2016; Vivas et al. Citation2018; Haddouti et al. Citation2020), thereby yielding numerous conflicting reports. Besides CD73, CD90 and CD105 as specific markers of mesenchymal cell lineages, CD29, CD44, and CD166 were also found to be expressed in human MSCs (Ghaneialvar et al. Citation2018).
In the present study, eight MSCs-associated positive markers were used to identify sheep MSCs. We found that CD73, CD90, CD105, anti-human CD29 (clone MAR4), and anti-human CD44 did not react positively with the ovine MSCs, partly because of the lack of antibody cross-reactivity or a differing cell surface marker profile between the two species. However, we also observed that ovine MSCs highly expressed anti-human CD29 (clone TS2/16), anti-sheep CD44 and anti-human CD166, which was in accordance with the findings of other researchers (Zannettino et al. Citation2010; Sanjurjo-Rodriguez et al. Citation2017; Ghaneialvar et al. Citation2018). In addition, sheep MSCs highly expressed anti-human CD29 (clone TS2/16), but did not express anti-human CD29 (clone MAR4), which suggests that the clones of antibodies might also be an important factor affecting their expressions. Considering that most of the previous studies related to sheep MSCs did not provide the antibody clones, further studies should identify the appropriate antibody clones for characterizing ovine MSCs.
Xiao et al. (Citation2013) observed a decreased osteogenesis in human MSCs from TMJ bony ankylosis compared with MSCs from the BM of the mandibular body. Owing to ethical restrictions, normal human condyle is not available. However, using the BM of the condyle as a normal control is obviously more reasonable because TMJ ankylosis is involved in the condyle, not the mandibular body. In the present study, using MSCs from the BM of the condyle (BM-MSCs) as normal controls, we found that the MSCs from bony ankylosis (BA-MSCs) showed significantly lower osteogenesis potential than the BM-MSCs on the basis of the area ratio of calcium deposition. Similar results were also observed between the two groups of MSCs when the osteogenic lineage-specific genes ALP, Runx2, OCN, and OSX were examined using real-time PCR. The consistency between our study and the study of Xiao et al.(Citation2013) indicated that the sheep model mimicked the human disease well. In addition, we found that the BA-MSCs showed increased expression levels of the chondrogenic lineage-specific gene Col2a1 compared with the BM-MSCs, indicating higher chondrogenic potential in the former. This result was in accordance with the histological course of bony ankylosis because endochondral ossification was its main pattern of new bone formation in the joint space (Li et al. Citation2014; Liang et al. Citation2019).
Unlike TMJ bony ankylosis, the typical histological features of fibrous ankylosis included plenty of avascular fibrous tissue, and a lack of cartilage formation (Yan et al. Citation2012; Liang et al. Citation2019). In the present study, we examined how traumatic microenvironments influenced the type of ankylosis in a sheep model from the perspective of MSCs. For the first time, we isolated and identified MSCs from sheep with fibrous ankylosis. The functional characteristics of FA-MSCs were then compared with those of BA-MSCs. We found that the FA-MSCs showed higher adipogenic potential but lower osteogenic and chondrogenic potentials than the BA-MSCs. Our results suggest that the increased osteogenic and chondrogenic potentials of the BA-MSCs are important factors for promoting new bone formation in the joint space.
The mechanism thereby the traumatic microenvironment exerted its influence on the MSCs was not clear. However, several factors such as hypoxia, mechanics, and growth factors might play important roles in this course. By using the same sheep model, our previous study demonstrated that in the initial stage of ankylosis, the hypoxia in the hematomas of bony ankylosis was more severe because of the lower expression level of hypoxia-inducing factor 1α (HIF-1α) in fibrous ankylosis (Liang et al. Citation2019). HIF-1α can induce MSCs to differentiate into chondrocytes (Robins et al. Citation2005). In addition, HIF-1α can promote osteogenesis but suppresses the adipogenesis of MSCs (Wagegg et al. Citation2012). Therefore, the degree of hypoxia in the traumatic microenvironment might determine the fate of MSCs, ultimately leading to different types of ankylosis.
Mechanical forces can dictate the fate of MSCs. For example, tensile forces can induce osteogenic differentiation; compression forces can induce chondrogenic differentiation, and high-frequency mechanical signals can inhibit the adipogenesis (Hao et al. Citation2015). However, the mechanics in the ankylosed joints is intricate and unclear. In the sheep model, bilateral TMJ surgery was performed. We inferred that the animals might have limited the motion of their bony ankylosis-induced joints because these received more severe trauma. Therefore, the mechanical environment might be more unstable on the fibrous ankylosis-induced side. Adipose and fibrous tissues were simultaneously observed at the nonunion site in a mechanically unstable animal model (Choi et al. Citation2004), indicating that the unstable mechanics favored MSCs to differentiate into adipocytes, which was in accordance with our results.
Growth factors are important morphogenetic proteins that are capable of regulating cellular function, including the induction of MSC differentiation (Halim et al. Citation2020). For example, the vascular endothelial growth factor (VEGF), as a crucial angiogenic and bone regeneration factor, was confirmed to promote MSCs differentiation towards osteoblast (Murakami et al. Citation2017). Bone morphogenetic protein 7 (BMP7), which plays important roles in promoting bone formation and bone fracture healing, was verified to enhance the osteogenic and chondrogenic differentiations of MSCs (Yan et al. Citation2018; Peng et al. Citation2019). In our previous studies that used the same sheep model, higher mRNA expression levels of VEGF and BMP7 were found in bony ankylosis than in fibrous ankylosis (Yan et al. Citation2014a; Liang et al. Citation2019). Therefore, in the traumatic microenvironment, the expression abundance of some key growth factors might have influenced the type of TMJ ankylosis by regulating MSC differentiation.
In the present study, tissue harvesting was performed at four time points, namely at 1, 2, 4, and 8 weeks, for ankylosed callus. Fibrous and bony ankylosis were compared at each time point to identify the time point at which intervention to efficiently convert bony ankylosis into fibrous ankylosis was relatively suitable. We found that the BA-MSCs-1W group showed higher expression levels of Sox9 and Col2a1 and lower expression levels of PPARγ than the FA-MSCs-1W group. The BA-MSCs-1W group also demonstrated higher osteogenic potential than the FA-MSCs-1W group on the basis of the calcium deposition. These results indicate that the function differences between the FA-MSCs and BA-MSCs occurred as early as 1 week after surgery. Therefore, on the basis of our experimental data, we suggest that to prevent bony ankylosis, the intervention should be initiated not later than 1 week after TMJ trauma.
5. Conclusion
For the first time, our study demonstrated that MSCs showed functional differences between fibrous and bony ankylosis in a sheep model of TMJ trauma. This study provides evidence that support our hypothesis that the traumatic microenvironment influences the type of TMJ ankylosis by changing the functions of MSCs. Furthermore, because the increased osteogenic and chondrogenic potentials of MSCs promote the development of bony ankylosis after severe TMJ trauma, inhibition of the osteogenic and chondrogenic differentiations of MSCs might be a promising strategy for preventing bony ankylosis in the future.
Supplemental Material
Download Zip (12.7 KB)Disclosure statement
No potential conflict of interest was reported by the author(s).
Additional information
Funding
References
- Andrzejewska A, Lukomska B, Janowski M. 2019. Concise review: mesenchymal stem cells: from roots to boost. Stem Cells. 37(7):855–864.
- Caminal M, Peris D, Fonseca C, Barrachina J, Codina D, Rabanal RM, Moll X, Morist A, Garcia F, Cairo JJ, et al. 2016. Cartilage resurfacing potential of PLGA scaffolds loaded with autologous cells from cartilage, fat, and bone marrow in an ovine model of osteochondral focal defect. Cytotechnology. 68(4):907–919.
- Chidzonga MM. 1999. Temporomandibular joint ankylosis: review of thirty-two cases. Br J Oral Maxillofac Surg. 37(2):123–126.
- Cho JW, Park JH, Kim JW, Kim SJ. 2016. The sequential management of recurrent temporomandibular joint ankylosis in a growing child: a case report. Maxillofac Plast Reconstr Surg. 38(1):39.
- Choi P, Ogilvie C, Thompson Z, Miclau T, Helms JA. 2004. Cellular and molecular characterization of a murine non-union model. J Orthop Res. 22(5):1100–1107.
- Colosimo A, Curini V, Russo V, Mauro A, Bernabo N, Marchisio M, Alfonsi M, Muttini A, Mattioli M, Barboni B. 2013. Characterization, GFP gene nucleofection, and allotransplantation in injured tendons of ovine amniotic fluid-derived stem cells. Cell Transplant. 22(1):99–117.
- Cui P, He X, Pu Y, Zhang W, Zhang P, Li C, Guan W, Li X, Ma Y. 2014. Biological characterization and pluripotent identification of sheep dermis-derived mesenchymal stem/progenitor cells. Biomed Res Int. 2014:786234.
- Desantis S, Accogli G, Zizza S, Mastrodonato M, Blasi A, Francioso E, Rossi R, Crovace A, Resta L. 2015. Ultrastructural study of cultured ovine bone marrow-derived mesenchymal stromal cells. Ann Anat. 201:43–49.
- Ghaneialvar H, Soltani L, Rahmani HR, Lotfi AS, Soleimani M. 2018. Characterization and classification of mesenchymal stem cells in several species using surface markers for cell therapy purposes. Indian J Clin Biochem. 33(1):46–52.
- Giai Via A, McCarthy MB, de Girolamo L, Ragni E, Oliva F, Maffulli N. 2018. Making them commit: strategies to influence phenotypic differentiation in mesenchymal stem cells. Sports Med Arthrosc Rev. 26:64–69.
- Godoy RF, Alves AL, Gibson AJ, Lima EM, Goodship AE. 2014. Do progenitor cells from different tissue have the same phenotype? Res Vet Sci. 96(3):454–459.
- Gronthos S, McCarty R, Mrozik K, Fitter S, Paton S, Menicanin D, Itescu S, Bartold PM, Xian C, Zannettino AC. 2009. Heat shock protein-90 beta is expressed at the surface of multipotential mesenchymal precursor cells: generation of a novel monoclonal antibody, STRO-4, with specificity for mesenchymal precursor cells from human and ovine tissues. Stem Cells Dev. 18(9):1253–1262.
- Gronthos S, Mrozik K, Shi S, Bartold PM. 2006. Ovine periodontal ligament stem cells: isolation, characterization, and differentiation potential. Calcif Tissue Int. 79(5):310–317.
- Haddouti EM, Randau TM, Hilgers C, Masson W, Walgenbach KJ, Pflugmacher R, Burger C, Gravius S, Schildberg FA. 2020. Characterization and comparison of human and Ovine Mesenchymal Stromal cells from three corresponding sources. Int J Mol Sci. 21(7):2310. doi:https://doi.org/10.3390/ijms21072310
- Halim A, Ariyanti AD, Luo Q, Song G. 2020. Recent progress in engineering mesenchymal stem cell differentiation. Stem Cell Rev Rep. Aug;16(4):661–674. doi:https://doi.org/10.1007/s12015-020-09979-4
- Hao J, Zhang Y, Jing D, Shen Y, Tang G, Huang S, Zhao Z. 2015. Mechanobiology of mesenchymal stem cells: perspective into mechanical induction of MSC fate. Acta Biomater. 20:1–9.
- He LH, Xiao E, Duan DH, Gan YH, Zhang Y. 2015. Osteoclast deficiency contributes to temporomandibular joint ankylosed bone mass formation. J Dent Res. 94(10):1392–1400.
- Heidari B, Shirazi A, Akhondi MM, Hassanpour H, Behzadi B, Naderi MM, Sarvari A, Borjian S. 2013. Comparison of proliferative and multilineage differentiation potential of sheep mesenchymal stem cells derived from bone marrow, liver, and adipose tissue. Avicenna J Med Biotechnol. 5(2):104–117.
- Huang AH, Chen YK, Chan AW, Shieh TY, Lin LM. 2009. Isolation and characterization of human dental pulp stem/stromal cells from nonextracted crown-fractured teeth requiring root canal therapy. J Endod. 35(5):673–681.
- Jahroomishirazi R, Bader A, Ebert S, Schmidt C, Sedaghati B, Schulz-Siegmund M, Zscharnack M. 2014. Isolation and characterization of CD271(+) stem cells derived from sheep dermal skin. Cells Tissues Organs. 200(2):141–152.
- Khan MR, Chandrashekran A, Smith RK, Dudhia J. 2016. Immunophenotypic characterization of ovine mesenchymal stem cells. Cytometry A. 89(5):443–450.
- Koobatian MT, Liang MS, Swartz DD, Andreadis ST. 2015. Differential effects of culture senescence and mechanical stimulation on the proliferation and leiomyogenic differentiation of MSC from different sources: implications for engineering vascular grafts. Tissue Eng A. 21(7-8):1364–1375.
- Letouzey V, Tan KS, Deane JA, Ulrich D, Gurung S, Ong YR, Gargett CE. 2015. Isolation and characterisation of mesenchymal stem/stromal cells in the ovine endometrium. PLoS One. 10(5):e0127531.
- Li JM, An JG, Wang X, Yan YB, Xiao E, He Y, Zhang Y. 2014. Imaging and histologic features of traumatic temporomandibular joint ankylosis. Oral Surg Oral Med Oral Pathol Oral Radiol. 118(3):330–337.
- Liang SX, Wang HL, Zhang PP, Shen J, Yang K, Meng L, Liu H, Yan YB. 2019. Differential regulation of blood vessel formation between traumatic temporomandibular joint fibrous ankylosis and bony ankylosis in a sheep model. J Craniomaxillofac Surg. 47(11):1739–1751.
- McCarty RC, Gronthos S, Zannettino AC, Foster BK, Xian CJ. 2009. Characterisation and developmental potential of ovine bone marrow derived mesenchymal stem cells. J Cell Physiol. 219(2):324–333.
- Mrozik KM, Zilm PS, Bagley CJ, Hack S, Hoffmann P, Gronthos S, Bartold PM. 2010. Proteomic characterization of mesenchymal stem cell-like populations derived from ovine periodontal ligament, dental pulp, and bone marrow: analysis of differentially expressed proteins. Stem Cells Dev. 19(10):1485–1499.
- Mrugala D, Bony C, Neves N, Caillot L, Fabre S, Moukoko D, Jorgensen C, Noel D. 2008. Phenotypic and functional characterisation of ovine mesenchymal stem cells: application to a cartilage defect model. Ann Rheum Dis. 67(3):288–295.
- Murakami J, Ishii M, Suehiro F, Ishihata K, Nakamura N, Nishimura M. 2017. Vascular endothelial growth factor-C induces osteogenic differentiation of human mesenchymal stem cells through the ERK and RUNX2 pathway. Biochem Biophys Res Commun. 484(3):710–718.
- Music E, Futrega K, Doran MR. 2018. Sheep as a model for evaluating mesenchymal stem/stromal cell (MSC)-based chondral defect repair. Osteoarthritis Cartilage. 26(6):730–740.
- Peng XB, Zhang Y, Wang YQ, He Q, Yu Q. 2019. IGF-1 and BMP-7 synergistically stimulate articular cartilage repairing in the rabbit knees by improving chondrogenic differentiation of bone-marrow mesenchymal stem cells. J Cell Biochem. 120(4):5570–5582.
- Robins JC, Akeno N, Mukherjee A, Dalal RR, Aronow BJ, Koopman P, Clemens TL. 2005. Hypoxia induces chondrocyte-specific gene expression in mesenchymal cells in association with transcriptional activation of Sox9. Bone. 37(3):313–322.
- Rozemuller H, Prins HJ, Naaijkens B, Staal J, Buhring HJ, Martens AC. 2010. Prospective isolation of mesenchymal stem cells from multiple mammalian species using cross-reacting anti-human monoclonal antibodies. Stem Cells Dev. 19(12):1911–1921.
- Sanjurjo-Rodriguez C, Castro-Vinuelas R, Hermida-Gomez T, Fernandez-Vazquez T, Fuentes-Boquete IM, de Toro-Santos FJ, Diaz-Prado SM, Blanco-Garcia FJ. 2017. Ovine mesenchymal stromal cells: morphologic, phenotypic and functional characterization for osteochondral tissue engineering. PLoS One. 12(1):e0171231.
- Sawhney CP. 1986. Bony ankylosis of the temporomandibular joint: follow-up of 70 patients treated with arthroplasty and acrylic spacer interposition. Plast Reconstr Surg. 77(1):29–40.
- Soltani L, Rahmani HR, Daliri Joupari M, Ghaneialvar H, Mahdavi AH, Shamsara M. 2016. Ovine fetal mesenchymal stem cell differentiation to cardiomyocytes, effects of co-culture, role of small molecules; reversine and 5-azacytidine. Cell Biochem Funct. 34(4):250–261.
- Tian Y, Tao L, Zhao S, Tai D, Liu D, Liu P. 2016. Isolation and morphological characterization of ovine amniotic fluid mesenchymal stem cells. Exp Anim. 65(2):125–134.
- Veron AD, Bienboire-Frosini C, Feron F, Codecasa E, Deveze A, Royer D, Watelet P, Asproni P, Sadelli K, Chabaud C, et al. 2018. Isolation and characterization of olfactory ecto-mesenchymal stem cells from eight mammalian genera. BMC Vet Res. 14(1):17.
- Vivas D, Caminal M, Oliver-Vila I, Vives J. 2018. Derivation of multipotent mesenchymal stromal cells from ovine bone marrow. Curr Protoc Stem Cell Biol. 44:2B.9.1–2B.9.22.
- Wagegg M, Gaber T, Lohanatha FL, Hahne M, Strehl C, Fangradt M, Tran CL, Schonbeck K, Hoff P, Ode A, et al. 2012. Hypoxia promotes osteogenesis but suppresses adipogenesis of human mesenchymal stromal cells in a hypoxia-inducible factor-1 dependent manner. PLoS One. 7(9):e46483.
- Wang HL, Zhang PP, Meng L, Liang SX, Liu H, Yan YB. 2018. Preserving the fibrous layer of the mandibular condyle reduces the risk of ankylosis in a sheep model of intracapsular condylar fracture. J Oral Maxillofac Surg. 76(9):1951.e1–1951.e24.
- Xiao E, Li JM, Yan YB, An JG, Duan DH, Gan YH, Zhang Y. 2013. Decreased osteogenesis in stromal cells from radiolucent zone of human TMJ ankylosis. J Dent Res. 92(5):450–455.
- Yan X, Zhou Z, Guo L, Zeng Z, Guo Z, Shao Q, Xu W. 2018. BMP7-overexpressing bone marrow-derived mesenchymal stem cells (BMSCs) are more effective than wild-type BMSCs in healing fractures. Exp Ther Med. 16(2):1381–1388.
- Yan YB, Duan DH, Zhang Y, Gan YH. 2012. The development of traumatic temporomandibular joint bony ankylosis: a course similar to the hypertrophic nonunion? Med Hypotheses. 78(2):273–276.
- Yan YB, Li JM, Xiao E, An JG, Gan YH, Zhang Y. 2014a. A pilot trial on the molecular pathophysiology of traumatic temporomandibular joint bony ankylosis in a sheep model. Part II: the differential gene expression among fibrous ankylosis, bony ankylosis and condylar fracture. J Craniomaxillofac Surg. 42(2):e23–e28.
- Yan YB, Liang SX, Shen J, Zhang JC, Zhang Y. 2014b. Current concepts in the pathogenesis of traumatic temporomandibular joint ankylosis. Head Face Med. 10:35.
- Yan YB, Zhang Y, Gan YH, An JG, Li JM, Xiao E. 2013. Surgical induction of TMJ bony ankylosis in growing sheep and the role of injury severity of the glenoid fossa on the development of bony ankylosis. J Craniomaxillofac Surg. 41(6):476–486.
- Zannettino AC, Paton S, Itescu S, Gronthos S. 2010. Comparative assessment of the osteoconductive properties of different biomaterials in vivo seeded with human or ovine mesenchymal stem/stromal cells. Tissue Eng A. 16(12):3579–3587.
- Zhang Y, He DM. 2006. Clinical investigation of early post-traumatic temporomandibular joint ankylosis and the role of repositioning discs in treatment. Int J Oral Maxillofac Surg. 35(12):1096–1101.
- Zhao S, Tao L, Tian Y, Tai D, Liu P, Liu D. 2019. Isolation and characterization of ovine umbilical cord-derived mesenchymal stem cells. Cytotechnology. 71(1):277–286.