
ABSTRACT
Constipation is a common disease that reduces life quality. Drugs of various mechanisms are being developed to resolve this affliction. Intestinal motility can be easily monitored in zebrafish, and so we selected this organism to develop a constipation model to measure drug-induced prokinetic effects. In this study, intestinal motility was monitored in zebrafish by tracking intestinal transit using fluorescence, after which an opioid-induced constipation model was established using loperamide. We then evaluated the prokinetic effect of diatrizoate meglumine (Gastrografin®), which has been empirically used to treat post-operative ileus or adhesive small bowel obstructions. Diatrizoate meglumine was effective in promoting bowel movements in an opioid-induced zebrafish constipation model and its prokinetic effect was associated with an increased expression of interstitial cells of Cajal (ICC) markers. Therefore, the loperamide-induced zebrafish constipation model developed herein is a promising tool to evaluate novel constipation therapies.
KEYWORDS:
1. Introduction
Constipation is a common gastrointestinal problem with an estimated worldwide prevalence of 1–27% (Sanchez and Bercik Citation2011). Constipation reduces life quality (Glia and Lindberg Citation1997), and patients with this condition are more likely to suffer from anxiety disorders and depression (Rao et al. Citation2007). Many medications cause constipation, including anticholinergics, anticonvulsants, anti-Parkinsonian medications, muscle relaxants, and opioids (Klaschik et al. Citation2003). Opioids are commonly prescribed analgesics to treat acute and chronic pain (Farmer et al. Citation2018). However, unlike the transient opioid side-effects that affect the CNS, gastrointestinal side-effects frequently persist for the duration of the treatment (McNicol et al. Citation2003). Opioid-induced constipation occurs in approximately half of patients receiving chronic opioid therapy for non-cancer pain. The prevalence in patients with cancer is between 74 and 87% (Kalso et al. Citation2004).
There are several techniques available for the assessment of gastrointestinal motor functions in laboratory animals, with rodents (mice, rats, and guinea pigs) and dogs being the most commonly used experimental animals in clinical research (Al-Saffar et al. Citation2019). In humans and experimental animals, bowel movements are measured indirectly by fecal pellet number or weight change or analyzed via radiologic or nuclear imaging tests to monitor intestinal motility over time (Marks et al. Citation2013). Other direct methods to assess intestinal motility include monitoring changes in myoelectrical activity or intraluminal pressure with a transducer or catheter (Harrison et al. Citation2004). However, in vivo real-time observation of intestinal motility is difficult, and direct measurement methods generally require invasive procedures. Zebrafish (Danio rerio) provide a useful vertebrate model that exhibits high genetic similarity to humans. This organism is easy to breed and manipulate and produces transparent larvae (Howe et al. Citation2013; Kanungo et al. Citation2014). Additionally, the intestine of zebrafish is similar to the mammalian gastrointestinal tract, and gut motility is controlled primarily by the enteric nervous system as in other vertebrates.
This study validated a loperamide-induced constipation model in zebrafish and evaluated the prokinetic effect of diatrizoate meglumine (Gastrografin®) in this zebrafish constipation model.
2. Materials and methods
2.1. Reagents and drugs
Microspheres (carboxylate-modified FluoSpheresTM) were obtained from Thermo Fisher (California, USA). Tricaine, dimethyl sulfoxide (DMSO), and loperamide were purchased from Sigma-Aldrich (St Louis, MO). Gastrografin was obtained from Berlimed S.A. (Madrid, Spain). Moreover, anti-c-kit antibodies were purchased from Abcam (Cambridge, UK) and HRP-conjugated secondary antibodies and anti-actin antibodies were purchased from Sigma-Aldrich (St Louis, MO).
2.2. Zebrafish care and maintenance
Wild-type zebrafish were obtained from Zebrafish Translational Medical Research Center at Korea University. Adult zebrafish were housed in a light and temperature-controlled aquaculture facility with standard 14 h light photoperiod/10 h dark photoperiod. Zebrafish larvae were studied at eight days post-fertilization (dpf).
2.3. Fluorescent tracer
The fluorescent tracer was prepared by mixing 100 mg of powdered larval feed (Tetra Bits Complete; Tetra Inc., Germany) with 150 µl of yellow-green, 2.0 µl carboxylate-modified polystyrene FluoSpheres (Thermo Fisher, CA, USA), and 50 µl of deionized water. The mixture was dried at room temperature in the dark overnight and then crushed into a fine powder.
2.4. Constipation induction and transit zone analysis
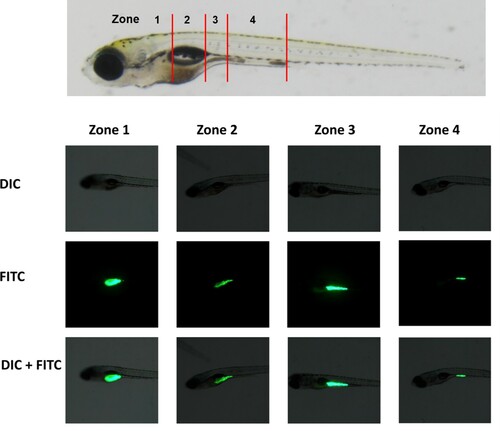
Constipation was induced in 8 dpf zebrafish larvae using loperamide. These 8 dpf larvae were fed with the fluorescence tracer for one hour, after which they were washed three times with embryo medium (EM; 15 mM NaCl, 0.5 mM KCl, 1 mM CaCl2, 1 mM MgSO4, 0.15 mM KH2PO4, 0.05 mM NH2PO4, 0.7 mM). After feeding, the larvae were exposed to loperamide (0, 1, and 5 mg/L) for two hours, after which they were anesthetized with 0.2% aminobenzoic acid ethyl ester (tricaine). We then analyzed their transit zone. Zebrafish larvae were classified according to the location of the fluorescence tracer in their gastrointestinal tract (). To quantify transit, the intestine was divided into transit zones as described by Field et al. (Field et al. Citation2009).
Figure 1. Type of intestinal transit zone. To analyze intestinal transit in zebrafish populations, individual larvae were classified into four zones according to the location of the fluorescent tracer in the intestinal tract. Zone 1 was the region of the intestinal bulb rostral to the swim bladder. Zone 2 was the region of the intestinal bulb ventral to the swim bladder. Zone 3 was the region of the junction between the swim bladder and the mid-intestine. Zone 4 was the region between the mid-intestine and posterior intestine. DIC, differential interference contrast microscopy; FITC, FITC fluorescence microscopy; DIC + FITC, merged DIC and FITC images.
2.5. Preparation of total RNA
Total RNA was extracted from frozen zebrafish larvae using the TRizol reagent (Thermo Fisher, CA, USA) per the manufacture’s protocol. The RNA concentration was determined with a Nanodrop spectrophotometer (Nanodrop Technologies, ND-1000 spectrophotometer).
2.6. Real-time reverse-transcription polymerase chain reaction (RT–PCR)
RT–PCR was performed as previously described with minor modifications (Shin et al. Citation2020). Complementary DNA (cDNA) was synthesized from total RNA using the Promega Reverse Transcription System (Promega Corporation, Madison, WI, USA). Relative gene expression was quantified by RT–PCR using LightCycler FastStart DNA Master SYBR Green I (Roche, Mannheim, Germany) according to the manufacturer’s protocol. The reaction mixture (20 µl) consisted of LightCycler FastStart DNA Master SYBR Green I, 4 mM of MgCl2, 0.5 µM of primer pairs, and 2 µl of the cDNA as a template. The primer sequences are summarized in Supplementary Table 1. The PCR reaction was performed at 95°C for 10 min, followed by 45 cycles at 95°C for 10 s, an annealing temperature for 10 s, and 72°C for [amplicon length (bp)/25] s. After 45 cycles, a melting step was performed at 65°C for 15 s followed by 40°C for 30 s. The RT–PCR was performed in a Light cycler 1.5 system (Roche Diagnostics, Germany). All PCRs were normalized to beta-actin expression to control for variations.
2.7. Western blotting
To measure C-kit protein levels, 20 zebrafish larvae were homogenized in a lysis buffer (radio-immunoprecipitation buffer; Sigma, St. Louis, USA) and proteinase inhibitor cocktail (Roche, Mannheim, Germany) to obtain crude protein extracts. Protein concentration was determined via the Bradford method. Equal amounts of protein (40 µg) were then submitted to an 8% sodium dodecyl sulfate polyacrylamide gel electrophoresis (SDS-PAGE) to identify C-kit. Membranes were blocked with 5% skim-milk in 1x Tris-buffered saline (TBS) at room temperature for one hour.
To identify the C-kit, the membranes were incubated with a 1:500 dilution of c-kit-specific rabbit polyclonal primary antibodies (Abcam, Cambridge, UK) overnight at 4°C. To remove the primary antibody, the membrane was washed four times in 1x TBST buffer. The membranes were then incubated with a 1:50,000 dilution of a horseradish peroxidase (HRP)-conjugated c-kit-specific anti-rabbit secondary antibody (Ho et al. Citation2019). To identify actin, a 1:2000 dilution of a primary antibody (Sigma, Saint Luis, USA) was coupled with a 1:50,000 dilution of anti-mouse IgG-HRP secondary antibodies. An electrochemiluminescence kit was then used to develop the Western blots.
2.8. Immunohistochemistry
Zebrafish larvae (8 dpf) were anesthetized using tricaine mesylate until their movement ceased, fixed in 4% paraformaldehyde, and embedded in 1.5% agar blocks containing 5% sucrose. After equilibration in 30% sucrose solution, frozen blocks were cut into 10-μm sections using a cryostat microtome and mounted on glass slides. Sections were rinsed several times with phosphate buffered saline (PBS), blocked in 10% bovine serum albumin (BSA) with 6% sheep serum, and subsequently treated with primary antibodies overnight at 4°C. After being washed for 2 h with PBS, the slides were incubated with the appropriate secondary antibodies overnight at 4°C, washed for 2 h with PBS, and mounted. The primary antibody was the anti-c-kit antibody (1:250, Abcam, Cat. No. ab114992). The secondary antibody was 594 donkey anti-rabbit IgG (1:200, Biolegend, Cat. No. 406418).
2.9. Statistical analyses
All data were reported as means ± standard deviation (SD) and statistical analyses were performed using Bonferroni’s multiple comparison test. The levels of statistical significance were set at *P < 0.05 and **P < 0.01.
3. Results
3.1. Analysis of intestinal transit and constipation induction with loperamide
The progression of fluorescent tracer-mixed feed through the intestine of individual larvae was monitored for four hours, after which individual larvae were classified into four zones depending on the location of the fluorescent tracer in the intestine ().
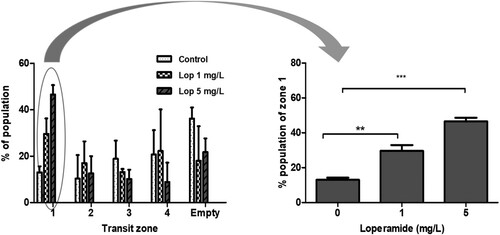
The fish larvae were treated with 1 mg/L (n = 97) or 5 mg/L (n = 99) of loperamide for two hours in quadruplicate, after which the distribution of their intestinal transit zones was compared with that of the control group (n = 84). After feeding, the zebrafish larvae were divided into five groups (zone 1–4 and empty intestines) based on the distribution of the food remaining in the intestines. The proportions (mean ± standard error (SE)) of zone 1 were 13 ± 2.6%, 29.6 ± 6.7%, and 46.6 ± 4.1% in the control, 1 mg/mL loperamide, and 5 mg/mL loperamide treatment groups, respectively ().
Figure 2. Delayed intestinal transit with loperamide treatment. Eight dpf zebrafish larvae were fed with a fluorescent tracer then treated with loperamide (1, 5 mg/L) for two hours. The intestinal transit zones of zebrafish larvae were analyzed two hours after loperamide exposure. The data represent population percentages. **P < 0.01 and ***P < 0.001 compared to the control.
3.2. Comparison between diatrizoate meglumine (Gastrografin®)-induced prokinetic effects in the loperamide-induced constipation model
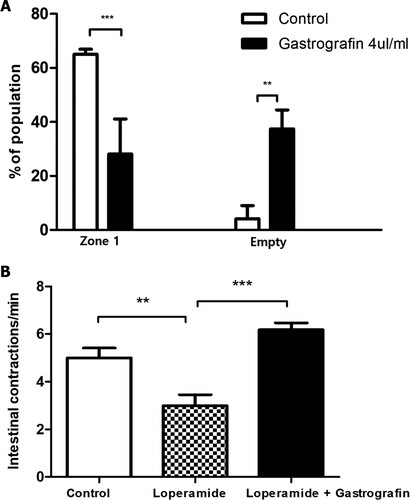
The prokinetic effects of gastrografin were investigated in the loperamide-induced zebrafish constipation model. After treatment with loperamide for two hours, larvae with fluorescent tracer remaining in transit zone 1 were selected and considered suitable constipation models. To investigate the effect of gastrografin, which is empirically used in the post-operative ileus, transit zone distribution was observed after treatment with 4 µL gastrografin for one hour after loperamide treatment. After the gastrografin treatment (n = 24), the fraction of larvae in which the food remained in zone 1 was significantly reduced (28.1 ± 13.0% in the gastrografin treatment group vs. 65.0 ± 1.9% in the control group), and the proportion of food in zone 5 was significantly increased compared to the control group (n = 25) (12.9 ± 4.1% in the gastrografin treatment group vs. 6.9 ± 3.2% in the control group) ((A)).
Figure 3. Change in intestinal motility after gastrografin treatment in the loperamide-induced constipation model. (A) 8 dpf zebrafish larvae with loperamide (5 mg/L)-induced constipation were treated with 4 µl/ml gastrografin. Afterward, we analyzed the intestinal transit zones of these larvae. (B) Intestinal contraction in zebrafish larvae with loperamide-induced constipation was compared via real-time video analysis. The data represent population percentages (**P < 0.01, ***P < 0.001)
3.3. Effects of gastrografin on the intestinal contraction of the zebrafish constipation model
When intestinal contraction was observed by real-time video analysis, the number of contractions per minute was significantly decreased in the loperamide-induced constipation model (n = 6) compared to the control group (n = 5) (5.0 ± 0.9/min vs. 3.0 ± 1.1/min, respectively). However, when gastrografin (n = 6) was administered, this decreased contraction rate was recovered to a level similar to that of the control group (6.2 ± 0.7/min) ((B) and supplementary video files).
3.4. Associations between kit gene/protein expression and diatrizoate meglumine effects
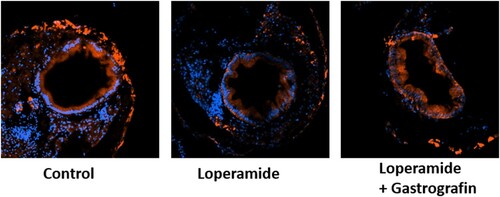
The kit-a, kit-b, kit ligand a, and kit ligand b genes were all downregulated in the loperamide constipation model, and mRNA levels were restored with gastrografin administration (). When only gastrografin was administered, the level of genes was not significantly different from the control group (data were not shown). Moreover, a comparison of C-kit protein expression in adult zebrafish demonstrated that this protein was suppressed by loperamide treatment but recovered to control levels when gastrografin was administered. C-kit expression was observed in an immunohistochemical analysis on transverse section of zebrafish larva. C-kit expression was observed in the intestinal epithelium of controls. After loperamide treatment, the intensity was decreased and recovered with co-treatment of loperamide and gastrografin ().
Figure 4. Effect of gastrografin on (A) the mRNA expression of kit genes and (B) C-kit protein expression in zebrafish larvae with loperamide-induced constipation. Lop, loperamide; la, ligand a; lb, ligand b (***P < 0.001).
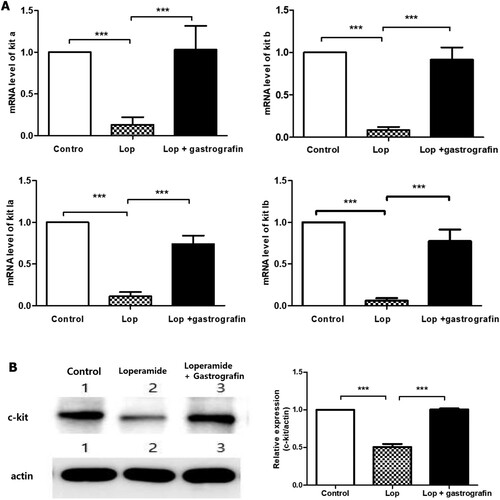
Figure 5. Transverse section views (×20) of 8 dpf larva subjected to immunohistochemical staining with anti-c-kit antibody (red) and DAPI (blue).
4. Discussion
Constipation is a gastrointestinal tract disorder that can result in infrequent stools and difficult stool passage with pain and stiffness. Additionally, this disease causes many physical and mental problems in many patients and can have a significant impact on their daily life (Sanchez and Bercik Citation2011). Approximately 30% of the general population will suffer from constipation more than once in their lives; however, this affliction occurs more commonly in older people and women. The average prevalence of constipation in adults has been estimated at 16% worldwide but varies between 0.7 and 79% (Everhart and Ruhl Citation2009; De Giorgio et al. Citation2015).
In clinics, constipation is usually diagnosed with a questionnaire about stool frequency or consistency. Colon transit is measured using imaging tests with radiopaque markers or radionuclide scintigraphy; however, this approach is time-consuming and requires repeated examinations (Forootan et al. Citation2018). While several techniques have been developed to measure intestinal transit, direct measurement of intestinal contraction typically entails sacrificing the study animal or other invasive monitoring procedures, whereas indirect measurements such as fecal pellet analyses cannot accurately reflect real-time intestinal transit (Al-Saffar et al. Citation2019).
The zebrafish is a potentially valuable model for gastrointestinal studies due to its transparency, accessibility, and ease of screening (Field et al. Citation2009). Here, we evaluated intestinal motility by monitoring the movement of fluorescent feed in the intestine. A zebrafish constipation model was developed using loperamide. The µ-opioid receptor plays an important role in inhibiting intestinal transit. Loperamide, a µ-opioid receptor agonist, is widely used to treat diarrhea (Holmberg et al. Citation2006; Holzer Citation2009). Loperamide has been used to induce constipation, and loperamide-induced constipation animal models are widely used to identify therapeutic agents (Wintola et al. Citation2010). A previous study established an opioid-induced bowel dysfunction zebrafish model and demonstrated that loperamide suppressed the gut peristalsis frequency in zebrafish (Shi et al. Citation2014). Our study aimed to develop a constipation model by selecting a population with prominently reduced intestinal transit after loperamide treatment using the zone analysis method. The model’s usefulness was evaluated by characterizing gastrografin’s prokinetic effects.
Gastrografin is a commercially available medication initially formulated as a radiologic contrast agent. It may be administered orally or rectally as a water-soluble contrast media for radiologic imaging tests. In small bowel obstructions, water-soluble contrast agents, such as gastrografin, have been used for early diagnoses to determine the need for surgery. Meta-analyses have demonstrated that administration of gastrografin serves as a diagnostic procedure and reduces the need for surgery in patients with acute small bowel obstruction (Branco et al. Citation2010; Di Saverio et al. Citation2013).
Additionally, c-kit gene analysis was performed in this study. Interstitial cells of Cajal (ICC) identified by Kit-like immunoreactivity provide a pacemaker signal for coordinated motility patterns in the mammalian gastrointestinal (GI) tract (Rich et al. Citation2013). C-kit mRNA and protein expression are downregulated in the colonic tissues of slow-transit constipation patients (Tong et al. Citation2005). The expression of the kit gene and c-kit protein was suppressed in the loperamide constipation model, and mRNA and protein levels were restored with gastrografin administration. These results suggest that gastrografin promotes GI motility by increasing the expression of ICC markers.
Therefore, the zebrafish loperamide-induced constipation model is a promising tool for the evaluation of novel constipation therapies.
Supplemental Material
Download MS Word (16 KB)Disclosure statement
No potential conflict of interest was reported by the author(s).
Additional information
Funding
References
- Al-Saffar A, Takemi S, Saaed HK, Sakata I, Sakai T. 2019. Utility of animal gastrointestinal motility and transit models in functional gastrointestinal disorders. Best Pract Res Clin Gastroenterol. 40–41:101633. eng.
- Branco BC, Barmparas G, Schnuriger B, Inaba K, Chan LS, Demetriades D. 2010. Systematic review and meta-analysis of the diagnostic and therapeutic role of water-soluble contrast agent in adhesive small bowel obstruction. British J Surg. 97(4):470–478. eng.
- De Giorgio R, Ruggeri E, Stanghellini V, Eusebi LH, Bazzoli F, Chiarioni G. 2015. Chronic constipation in the elderly: a primer for the gastroenterologist. BMC Gastroenterol. 15:130. eng.
- Di Saverio S, Coccolini F, Galati M, Smerieri N, Biffl WL, Ansaloni L, Tugnoli G, Velmahos GC, Sartelli M, Bendinelli C, et al. 2013. Bologna guidelines for diagnosis and management of adhesive small bowel obstruction (ASBO): 2013 update of the evidence-based guidelines from the world society of emergency surgery ASBO working group. World J Emerg Surg. 8(1):42. eng.
- Everhart JE, Ruhl CE. 2009. Burden of digestive diseases in the United States part II: lower gastrointestinal diseases. Gastroenterology. 136(3):741–754. eng.
- Farmer AD, Holt CB, Downes TJ, Ruggeri E, Del Vecchio S, De Giorgio R. 2018. Pathophysiology, diagnosis, and management of opioid-induced constipation. Lancet Gastroenterol Hepatol. 3(3):203–212. eng.
- Field HA, Kelley KA, Martell L, Goldstein AM, Serluca FC. 2009. Analysis of gastrointestinal physiology using a novel intestinal transit assay in zebrafish. Neurogastroenterol Motil. 21(3):304–312.
- Forootan M, Bagheri N, Darvishi M. 2018. Chronic constipation: A review of literature. Medicine (Baltimore). 97(20):e10631. eng.
- Glia A, Lindberg G. 1997. Quality of life in patients with different types of functional constipation. Scand J Gastroenterol. 32(11):1083–1089. eng.
- Harrison AP, Erlwanger KH, Elbrond VS, Andersen NK, Unmack MA. 2004. Gastrointestinal-tract models and techniques for use in safety pharmacology. J Pharmacol Toxicol Methods. 49(3):187–199. eng.
- Ho DH, Lee H, Son I, Seol W. 2019. G2019s LRRK2 promotes mitochondrial fission and increases TNFα-mediated neuroinflammation responses. Anim Cells Syst. 23(2):106–111.
- Holmberg A, Olsson C, Holmgren S. 2006. The effects of endogenous and exogenous nitric oxide on gut motility in zebrafish Danio rerio embryos and larvae. J Exp Biol. 209(Pt 13):2472–2479. eng.
- Holzer P. 2009. Opioid receptors in the gastrointestinal tract. Regul Pept. 155(1–3):11–17. eng.
- Howe K, Clark MD, Torroja CF, Torrance J, Berthelot C, Muffato M, Collins JE, Humphray S, McLaren K, Matthews L, et al. 2013. The zebrafish reference genome sequence and its relationship to the human genome. Nature. 496(7446):498–503. eng.
- Kalso E, Edwards JE, Moore RA, McQuay HJ. 2004. Opioids in chronic non-cancer pain: systematic review of efficacy and safety. Pain. 112(3):372–380. eng.
- Kanungo J, Cuevas E, Ali SF, Paule MG. 2014. Zebrafish model in drug safety assessment. Curr Pharm Des. 20(34):5416–5429. eng.
- Klaschik E, Nauck F, Ostgathe C. 2003. Constipation–modern laxative therapy. Support Care Cancer. 11(11):679–685.
- Marks L, Beard E, Cobey D, Moore N, Motyer V, Valentin JP, Ewart L. 2013. An evaluation of the non-invasive faecal pellet assessment method as an early drug discovery screen for gastrointestinal liability. J Pharmacol Toxicol Methods. 68(1):123–136. eng.
- McNicol E, Horowicz-Mehler N, Fisk RA, Bennett K, Gialeli-Goudas M, Chew PW, Lau J, Carr D. 2003. Management of opioid side effects in cancer-related and chronic noncancer pain: a systematic review. J Pain. 4(5):231–256. eng.
- Rao SS, Seaton K, Miller MJ, Schulze K, Brown CK, Paulson J, Zimmerman B. 2007. Psychological profiles and quality of life differ between patients with dyssynergia and those with slow transit constipation. J Psychosom Res. 63(4):441–449. eng.
- Rich A, Gordon S, Brown C, Gibbons SJ, Schaefer K, Hennig G, Farrugia G. 2013. Kit signaling is required for development of coordinated motility patterns in zebrafish gastrointestinal tract. Zebrafish. 10(2):154–160.
- Sanchez MI, Bercik P. 2011. Epidemiology and burden of chronic constipation. Can. J Gastroenterol. 25(Suppl B):11b–15b. eng.
- Shi Y, Zhang Y, Zhao F, Ruan H, Huang H, Luo L, Li L. 2014. Acetylcholine serves as a derepressor in loperamide-induced opioid-induced bowel dysfunction (OIBD) in zebrafish. Sci Rep. 4:5602.
- Shin MK, Yang SM, Han IS. 2020. Capsaicin suppresses liver fat accumulation in high-fat diet-induced NAFLD mice. Anim Cells Syst. 24(4):214–219.
- Tong WD, Liu BH, Zhang LY, Xiong RP, Liu P, Zhang SB. 2005. Expression of c-kit messenger ribonucleic acid and c-kit protein in sigmoid colon of patients with slow transit constipation. Int J Colorectal Dis. 20(4):363–367.
- Wintola OA, Sunmonu TO, Afolayan AJ. 2010. The effect of aloe ferox mill in the treatment of loperamide-induced constipation in wistar rats. BMC Gastroenterol. 10:95. eng.