
ABSTRACT
Metabolic reprogramming is an important feature in tumor progression. Long noncoding RNA’s (lncRNA) small nucleolar RNA host gene 6 (SNHG6) acts as a proto-oncogene in hepatocellular carcinoma (HCC) but its role in glycolysis is mostly unknown. The role of SNHG6 and Block of proliferation 1 (BOP1) on glycolysis is assessed by glucose uptake, lactate production, oxygen consumptive rate (OCR) and extracellular acidification rate (ECAR) and glycolytic enzyme levels. The regulatory effect of SNHG6 on BOP1 protein was confirmed by Western blotting, MS2 pull-down, RNA pull-down, and RIP assay. SNHG6 and BOP1 levels were increased in HCC tissues and cells. SNHG6 and BOP1 were prognostic factors in HCC patients and significantly correlated to TP53 mutant and tumor grade. SNHG6 promoted proliferation, inhibited apoptosis, enhanced glucose uptake and lactate production, decreased OCR, and increased ECAR in HCC cell lines. SNHG6 could bind the BOP1 protein and enhance its stability. BOP1 overexpression rescued the change of proliferation, apoptosis, and glycolysis in HCCLM3 and SMMC-7721 cells. Our data indicate that SNHG6 accelerates proliferation and glycolysis and inhibits the apoptosis of HCC cell lines by binding the BOP1 protein and enhancing its stability. Both SNHG6 and BOP1 are promising prognostic and therapeutic markers in HCC.
Introduction
Hepatocellular carcinoma (HCC) is a deadly malignancy globally that arises from malignant liver cells. Patients diagnosed with HCC always have a poor prognosis due to frequent metastasis and high drug resistance (Hernandez-Gea et al. Citation2013; Lu et al. Citation2019). Cancer cells tend to metabolize glucose and generate ATP primarily through aerobic glycolysis (Heiden MG et al. Citation2009; Feng et al. Citation2020). Glycolysis may support cancer growth and metastasis by affecting the tumor microenvironment pH value, ATP generation and signaling pathways (Teoh and Lunt Citation2018). The inhibition of glycolysis enzymes, such as hexokinase 2 (HK2) (Guo et al. Citation2015), pyruvate dehydrogenase kinase-1 (PDK1) (Xu et al. Citation2020), and glucose transporter 1 (GLUT1) (Zheng et al. Citation2021), results in reduced cancer cell growth and metastasis, indicating the important role of glycolysis in tumor progression. Metabolic disturbance leading to uncontrolled cell growth is a characteristic of HCC but the potential molecular mechanisms are only partially disclosed.
More and more attentions focus on the function of long non-coding RNAs (lncRNAs) in tumors but many lncRNAs remain to be explored. LncRNAs participate in tumor growth, metastasis, differentiation, metabolism, and angiogenesis by regulating tumor suppressors or oncogenes (Rinn and Chang Citation2020; Goodall and Wickramasinghe Citation2021). LncRNA small nucleolar RNA host gene 6 (SNHG6) is overexpressed and plays a tumorigenic role in various human tumors, including cervical cancer (Wei et al. Citation2021), chondrosarcoma (Pu et al. Citation2021), colorectal cancer (Xu et al. Citation2019), hepatocellular carcinoma (Wang, Ma, et al. Citation2021), and breast cancers (Jafari-Oliayi and Asadi Citation2019). SNHG6 was reported to enhance aerobic glycolysis by targeting the mRNA of pyruvate kinase M (PKM) in colorectal cancer cells (Lan et al. Citation2020). SNHG6 could accelerate Wilms’ tumor progression by regulating miR-429/FRS2 (FGF receptor substrates 2) signaling by affecting glycolytic metabolism (Wang, Liu, et al. Citation2021). Although the function of SNHG6 in HCC has been reported, the role and underlying mechanisms of SNHG6 on glycolysis in HCC remain unknown.
The protein Block of proliferation 1 (BOP1) is involved in the maturation of 5.8S/28S ribosomal RNA and the biogenesis of 60S ribosomal subunits (Strezoska et al. Citation2000). BOP1 is reported to play an oncogenic role in many cancers. BOP1 contributes to the development of gastric cancer by accelerating proliferation, invasion, and epithelial-mesenchymal transformation (He et al. Citation2022). BOP1 is also involved in chemoresistance development and serves as a prognostic marker and therapeutic target for triple-negative breast cancer (Li et al. Citation2021). Chung et al. indicate that BOP1 promotes migration and invasion of HCC cells by promoting epithelial-to-mesenchymal transition (Chung et al. Citation2011). However, the potential functions and mechanisms of BOP1 in HCC need more exploration.
Therefore, our study aimed to study the effect of SNHG6 and BOP1 on glycolysis in HCC cells and explored the relationship between SNHG6 and BOP1. Our study indicated that SNHG6 promoted glycolysis in HCC by stabilizing the BOP1 protein.
Materials and methods
Cell culture and transfection
Human normal hepatic cell line LO2 and HCC cell lines (HepG2, SMMC-7721, and HCCLM3) were purchased from Procell (Wuhan, China) and confirmed by STR profiling. Cells were incubated in RPMI-1640 (GIBCO, Grand Island, USA), supplemented with 10% FBS (GIBCO, USA) and 1% penicillin–streptomycin (Solarbio; Beijing, China). The SNHG6 and BOP1 overexpression plasmids and shRNA of SNHG6 were constructed by Sangon Biotech (Shanghai, China). The cells were transfected using a lipofectamine 2000 reagent (Thermo Fisher Scientific, Waltham, USA). RNA and proteins were collected at 48 h after transfection. The targeting sequence for sh-SNHG6 is 5′-CUGCGAGGUGCAAGAAAGCCU-3′. The targeting sequence for sh-NC is 5′-UUCUCCGAACGUGUCACGUUU-3′.
RNA extraction and qRT-PCR
Total RNA from cells was extracted by TRIzol (Thermo Fisher Scientific, Waltham, USA). After being reverse-transcribed to cDNA, an SYBR Green-based real-time PCR kit (Takara, Dalian, China) was used for detecting the level of SNHG6 and BOP1 mRNA. Data analysis was performed with ΔΔCt values from each sample calculated by normalizing with the respective control. The primer sequences were listed as follows: SNHG6 forward: 5′-TGCCAGCAGTGACAGCAGCA-3′ and SNHG6 reverse, 5′-TACGGAGGTGGAGTGCCAT-3′; BOP1 forward: 5′-CTGGTTTCCATCCCCAGTTG-3′ and BOP1 reverse: 5′-GGTTGCCCGAGCATCGT-3′; HIF1A forward: 5′-TTCCCGACTAGGCCCATTC-3′ and HIF1A reverse: 5′-CAGGTATTCAAGGTCCCATTTCA-3′; β-actin forward: 5′-CTCCATCCTGGCCTCGCTGT-3′ and β-actin reverse: 5′-GCTGTCACCTTCACCGTTCC-3′.
Cell proliferation
Cell Counting Kit-8 (Beyotime, Hangzhou, China) was used to determine cell viability according to the manufacturer’s protocol. The transfected cells were seeded at a density of 3000 cells per well in 96-well plates overnight. After culturing for 0, 24, 48, and 72 h, 10 μl of CCK8 was added to each well and then incubated at 37°C for 2 h. The absorbance values at 450 nm were measured to represent the cell viability.
Apoptosis assay
The apoptosis of cells was detected by a FITC Annexin V Apoptosis Detection Kit (Beyotime, Hangzhou, China). Cells were digested with 0.25% trypsin. Annexin V-FITC and propidium iodide (PI) were added successively and incubated in the dark at room temperature for 5 min. Apoptotic cells were then detected using a FACSVerse flow cytometry system (BD Biosciences).
Western blotting
Proteins were extracted from cells using RIPA lysis buffer and quantified with a BCA protein concentration determination Kit (Beyotime, Hangzhou, China). Proteins were separated by 10% SDS-PAGE and transferred to PVDF membranes. After blocking, membranes were incubated overnight at 4°C with primary antibodies directed toward BOP1 (Abcam, ab252819), PDK1 (Abcam, ab202468), HK2 (Abcam, ab209847), GLUT1 (Abcam, ab115730), HIF1A (Abcam, ab51608), and β-actin (Abcam, ab8226) and then probed with secondary antibody (CST, USA) for 1 h at room temperature. Bands were visualized with Pierce ECL (Thermo Fisher Scientific).
Glucose consumption and lactate production measurements
Glucose consumption and lactate production were determined from the culture media using Glucose Assay Kit (Rsbio, Shanghai, China) and Lactate Assay Kit (Rsbio) following the manufacturer’s instructions.
Seahorse assays
Oxygen consumptive rate (OCR) and extracellular acidification rate (ECAR) in HCCLM3 and SMMC-7721 cells were determined using a Seahorse Bioscience XFe24 Extracellular Flux Analyzer (Agilent, Santa Clara, CA, USA). Briefly, cells (1 × 10⁴ cells/well) were seeded into a Seahorse XF 96-well microplate and their baseline measures were determined. For ECAR, the cells were incubated with glucose, oligomycin, and 2-deoxy-glucose (2DG). For OCR, the cells were incubated with oligomycin, oxidative phosphorylation FCCP, and rotenone/antimycin A. Data were analyzed by Seahorse XF-96 Wave software.
MS2 pull-down assay
The pSNHG6-MS2, pEmpty-MS2, and pMS2-GST vectors were constructed by Sangon Biotech (Shanghai, China). The vectors were transfected using a Lipofectamine 2000. The proteins in transfected cells were collected and quantified. One thousand micrograms lysate was incubated with GSH agarose beads (GE Healthcare) for 4 h at 4°C. After washing, beads were then suspended in an SDS buffer and heated. Bound proteins were detected by Western blotting.
RNA pull-down assay
Cells were lysed by a lysis buffer with an RNase inhibitor and a protease inhibitor (Invitrogen, Carlsbad, CA, USA), after cell cross-linking. Biotinylated SNHG6 probes and scramble probes (GenePharma, Shanghai, China) were added to cell lysates for 5 h under moderate agitation. Dynabeads’ M-280 Streptavidin (Invitrogen, Carlsbad, CA, USA) was then added and incubated overnight with gentle agitation and hybridized. The beads then were separated by magnetic support and Bound proteins were detected by Western blotting.
RNA immunoprecipitation (RIP) assay
RIP experiments were conducted using a BOP1 antibody or non-specific IgG and an RNA-Binding Protein Immunoprecipitation Kit (Millipore, Burlington, USA) according to the manufacturers instructions. The fold enrichment of SNHG6 was determined relative to input RNA using qRT-PCR.
Statistical analysis
Two groups were compared with Prism software (GraphPad 8) using a two-tailed unpaired Student’s t-test. Multiple groups were compared using One-Way ANOVA. The Kaplan-Meier method was used for survival analysis of the prognostic value of SNHG1 and BOP1 in LIHC and log-rank was used to test the significance of differences in survival. All data were represented as mean ± SD. Differences were considered statistically significant if p values <.05.
Results
Expression of SNHG6 is elevated in LIHC tissues and acts as an oncogene
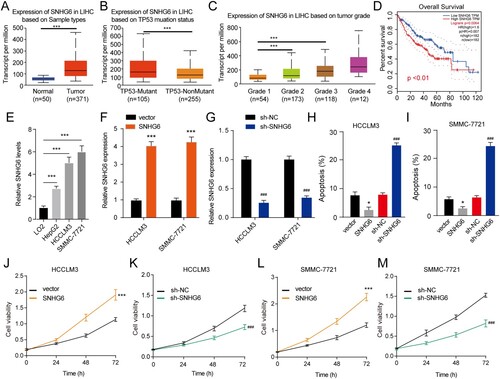
We used UALCAN (Chandrashekar et al. Citation2017) to analyze the expression of SNHG6 levels in liver hepatocellular carcinoma (LIHC) and found that the level of SNHG6 was upregulated in tumor tissues ((A)). LIHC patients with TP53-mutant showed higher SNHG6 expression ((B)) and the expression of SNHG6 was positively correlated with TP53-mutant in LIHC (Figure S1(A)). Moreover, SNHG6 levels in LIHC were slightly increased along with the increased tumor grade ((C)). The patients with high levels of SNHG6 had a poor prognosis ((D)). Moreover, SNHG6 level was increased in HepG2, HCCLM3, and SMMC-7721 cells compared to the LO2 cells ((E)). To further explore the role of SNHG6 in HCC, the SNHG6 overexpressed HCC cell lines and SNHG6 depleted HCC cell lines were established. The transfection of the SNHG6 overexpression vector significantly increased SNHG6 levels in HCCLM3 and SMMC-7721 cells ((F)). The specific shRNA of SNHG6 decreased SNHG6 levels in HCCLM3 and SMMC-7721 cells ((G)). The results of the apoptosis assay indicated that SNHG6 overexpression inhibited the apoptosis of HCCLM3 and SMMC-7721 cells, while SNHG6 depletion promoted the apoptosis of HCCLM3 and SMMC-7721 cells ((H,I)). CCK-8 assay was used to evaluate the proliferation of HCC cell lines in vitro. SNHG6 overexpression enhanced the cell viability of HCCLM3 and SMMC-7721 cells and SNHG6 depletion reduced the cell viability of HCCLM3 and SMMC-7721 cells ((J–M)). Taken together, our findings indicated that the elevated SNHG6 may be involved in the progression of HCC.
Figure 1. SNHG6 is upregulated in HCC. (A) The level of SNHG6 in normal and LIHC samples. (B) The expression of SNHG6 in LIHC samples corresponds to TP53 mutant. (C) The expression of SNHG6 in LIHC samples corresponding to tumor grades 1, 2, 3, and 4. (D) Kaplan-Meier curves showing overall survival were plotted according to relative SNHG6 expression levels. (E) The expression of SNHG6 in LO2 cells and three HCC cell lines. (F and G) The expression of SNHG6 in HCCLM3 and SMMC-7721 cells after SNHG6 overexpression or SNHG6 depletion. (H and I) The apoptosis of HCCLM3 and SMMC-7721 cells after SNHG6 overexpression or SNHG6 depletion. (J–M) The viability of HCCLM3 and SMMC-7721 cells after SNHG6 overexpression or SNHG6 depletion. *p < .05, ***p < .001 vs. vector; ###p < .001 vs. sh-NC. The experiment was repeated three times independently.
SNHG6 plays a crucial role in glycolytic metabolism reprogramming
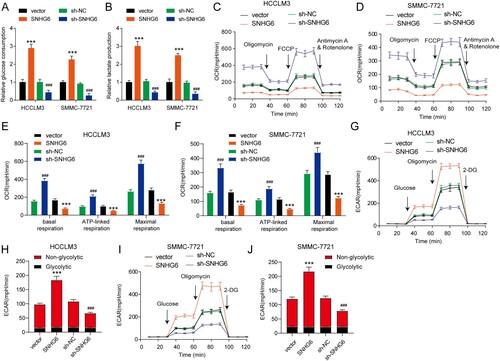
We further investigated oxidative and glycolytic metabolism in cells with SNHG6 overexpression or depletion in HCCLM3 and SMMC-7721 cells. The glucose consumption and lactate production were significantly reduced after SNHG6 depletion ((A,B)). However, levels of glucose consumption and lactate production were significantly elevated in SNHG6 overexpressed cells. OCR was stimulated by oligomycin and carbonyl cyanide p-trifluoromethoxy-phenylhydrazone (FCCP) and inhibited by antimycin A & rotenone, whereas ECAR was stimulated by glucose and oligomycin and inhibited by 2-DG ((C–J)). SNHG6 depletion has an increase in basal OCR, ATP-linked respiration, and maximal OCR in HCCLM3 and SMMC-7721 cells ((C–F)). However, SNHG6 overexpression reduced the basal OCR, ATP-linked respiration, and maximal OCR in HCCLM3 and SMMC-7721 cells. Furthermore, to test the glycolytic activity of these cells, we measured ECAR ((G–J)). The results displayed that SNHG6 depletion decreased glycolysis and SNHG6 overexpression increased glycolysis. These results demonstrate that SNHG6 may influence HCC progression by accelerating glycolysis.
Figure 2. SNHG6 affects the glycolysis of HCCLM3 and SMMC-7721 cells. (A) Detection of glucose consumption in HCCLM3 and SMMC-7721 cells after SNHG6 overexpression or SNHG6 depletion. (B) Detection of lactate production in HCCLM3 and SMMC-7721 cells after SNHG6 overexpression or SNHG6 depletion. (C–F) Oxygen consumptive rate (OCR) levels in HCCLM3 and SMMC-7721 cells after SNHG6 overexpression or SNHG6 depletion. (G–J) Extracellular acidification rate (ECAR) levels in HCCLM3 and SMMC-7721 cells after SNHG6 overexpression or SNHG6 depletion. ***p < .001 vs. vector; ###p < .001 vs. sh-NC. The experiment was repeated three times independently.
BOP1 protein is the target for SNHG6
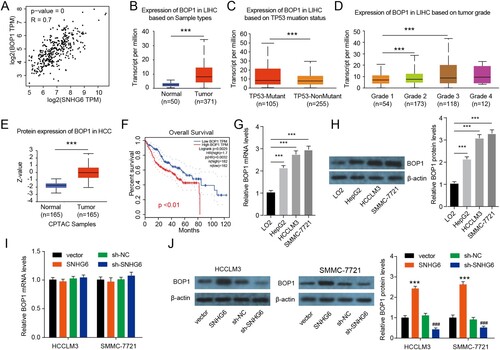
By analyzing the similar genes of SNHG6 in LIHC, we found that SNHG6 levels were highly associated with the ribosomal protein family. The BOP1 ribosomal biogenesis factor was included, which was previously reported to play an oncogenic role in HCC by promoting epithelial-to-mesenchymal transition (Chung et al. Citation2011). As shown in (A), the level of SNHG6 was positively associated with the level of BOP1 in LIHC. BOP1 was upregulated in tumor tissues ((B)). LIHC patients with TP53-mutant showed an increased BOP1 level ((C)) and it was positively correlated with TP53-mutant in LIHC (Figure S1(B)). Moreover, BOP1 expression was slightly increased along with the increased tumor grade of LIHC ((D)). The protein level of BOP1 was found to be enhanced in CPTAC LIHC samples when compared to the normal tissues ((E)). The patients with high levels of BOP1 had a poor prognosis ((F)). Moreover, BOP1 protein and mRNA levels were increased in HepG2, HCCLM3, and SMMC-7721 cells compared to the LO2 cells ((G,H)). Here, we found that SNHG6 depletion or overexpression had no effect on BOP1 mRNA expression, whereas SNHG6 depletion decreased BOP1 protein levels and SNHG6 overexpression increased BOP1 protein levels ((I,J)), indicating that SNHG6 may affect BOP1 protein expression by post-transcriptional modification. Overall, these results indicate that BOP1 may be a potential target for SNHG6.
Figure 3. SNHG6 increases the protein level of BOP1. (A) SNHG6 and BOP1 levels in LIHC tissues from the database of GEPIA showed a positive correlation. (B) The level of BOP1 in normal and LIHC samples. (C) The expression of BOP1 in LIHC samples corresponding to TP53 mutant. (D) The expression of BOP1 in LIHC samples corresponding to tumor grades 1, 2, 3, and 4. (E) The protein level of BOP1 in normal and LIHC samples from the database of CPTAC. (F) Kaplan-Meier curves showing overall survival were plotted according to relative BOP1 expression levels. (G and H) The mRNA and protein level of BOP1 in LO2 cells and three HCC cell lines. (I) The mRNA level of BOP1 in HCCLM3 and SMMC-7721 cells after SNHG6 overexpression or SNHG6 depletion. (J) The protein level of BOP1 in HCCLM3 and SMMC-7721 cells after SNHG6 overexpression or SNHG6 depletion. ***p < .001 vs. vector; ###p < .001 vs. sh-NC. The experiment was repeated three times independently.
SNHG6 stabilizes BOP1 protein by interacting with BOP1
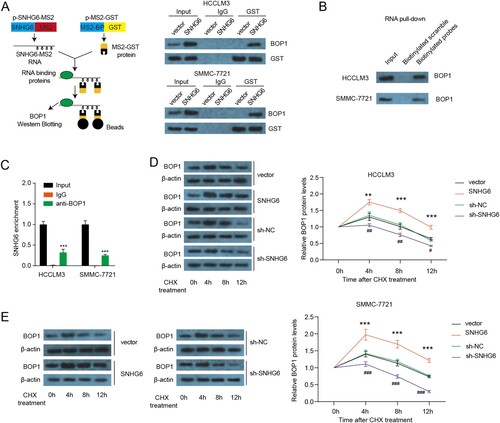
To explore the interaction between SNHG6 and BOP1 protein, an MS2-pull-down assay was conducted. BOP1 was captured through the SNHG6-MS2 construct and not by the MS2-empty vector ((A)). Moreover, the biotinylated probes were used to precipitate the SNHG6 complex and that BOP1 was captured by biotinylated probes and not by biotinylated scramble ((B)). To validate these results, RIP assay was performed using BOP1 antibodies. SNHG6 was enriched in the BOP1 immunoprecipitate in HCCLM3 and SMMC-7721 cells ((C)). To test if SNHG6 regulates the stability of the BOP1 protein, a cycloheximide (CHX) chase assay was performed. Four hours after CHX addition, BOP1 protein expression started decreasing more rapidly in the control clone than in the SNHG6 overexpressing clone ((D,E)), indicating that SNHG6 increased the stability of the BOP1 protein. BOP1 protein expression started decreasing more rapidly in SNHG6 depletion cells than in sh-NC cells. These results demonstrate that the interaction of SNHG6 and BOP1 enhances the stability of the BOP1 protein.
Figure 4. SNHG6 binds to the BOP1 protein. (A) Schematic illustration of MS2-pull-down assay (left panel) and immunoblotting results of BOP1 (right panel). (B) RNA pull-down assay was performed by the specific biotinylated probes of SNHG1 and immuno-blotting results of BOP1. (C) RIP assay was performed to check the enrichment of SNHG6 in HCCLM3 and SMMC-7721 cells. (D and E) The half-life of BOP1 protein in HCCLM3 and SMMC-7721 cells after SNHG6 overexpression or SNHG6 depletion. ***p < .001 vs. vector; #p < .05, ##p < .01, ###p < .001 vs. sh-NC. The experiment was repeated three times independently.
SNHG6 affects glycolytic reprogramming by targeting BOP1
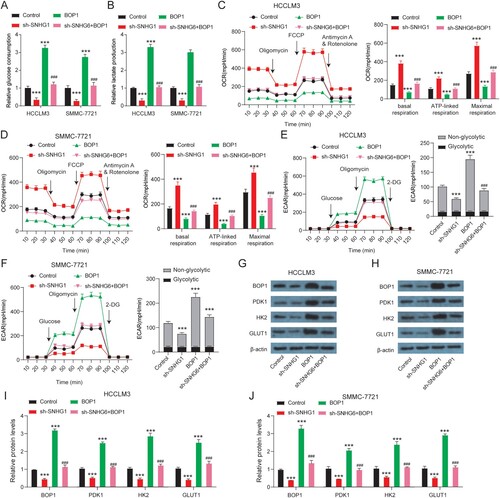
To further verify whether SNHG6 regulates glycolytic reprogramming by targeting BOP1, a rescue assay was performed. BOP1 overexpression increased glucose consumption and lactate production in HCCLM3 and SMMC-7721 cells ((A,B)). BOP1 overexpression decreased ((C,D)) OCR, increased ECAR ((E,F)), and increased glycolytic proteins (PDK1, HK-2, GLUT1) level ((G–J)) in HCCLM3 and SMMC-7721 cells. BOP1 overexpression rescued the level of OCR, ECAR, and glycolytic proteins expression altered by SNHG6 depletion. In a word, SNHG6 affects glycolytic reprogramming by binding BOP1.
Figure 5. SNHG6 regulates glycolysis by binding BOP1. (A) Glucose consumption of HCCLM3 and SMMC-7721 cells after SNHG6 depletion or BOP1 overexpression. (B) Lactate production of HCCLM3 and SMMC-7721 cells after SNHG6 depletion or BOP1 overexpression. (C and D) Oxygen consumptive rate (OCR) levels in HCCLM3 and SMMC-7721 cells after SNHG6 depletion or BOP1 overexpression. (E and F) Extracellular acidification rate (ECAR) levels in HCCLM3 and SMMC-7721 cells after SNHG6 depletion or BOP1 overexpression. (G–J) Western blot analysis of expression of BOP1, PDK1, HK-2, and GLUT1 in HCCLM3 and SMMC-7721 cells after SNHG6 depletion or BOP1 overexpression. ***p < .001 vs. control; ###p < .001 vs. sh-SNHG6. The experiment was repeated three times independently.
SNHG6 affects cell growth and apoptosis by targeting BOP1
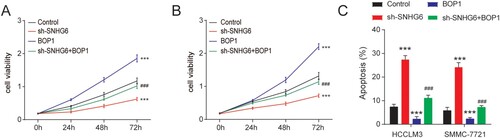
We then measure the cell viability of HCCLM3 and SMMC-7721 cells after SNHG6 depletion or BOP1 overexpression. BOP1 overexpression enhanced the cell viability of HCCLM3 and SMMC-7721 cells and BOP1 overexpression reversed the cell viability reduced by SNHG6 depletion ((A,B)). Moreover, BOP1 overexpression reduced the apoptosis rate and rescued the apoptosis induced by SNHG6 depletion ((C)). Taken together, our findings indicated that SNHG6 affects HCC cell growth and apoptosis by stabilizing BOP1.
Figure 6. SNHG6 regulates the viability and apoptosis of HCC cells by binding BOP1. (A and B) The viability of HCCLM3 and SMMC-7721 cells after BOP1 overexpression or SNHG6 depletion. (C) The apoptosis of HCCLM3 and SMMC-7721 cells after BOP1 overexpression or SNHG6 depletion. ***p < .001 vs. control; ###p < .001 vs. sh-SNHG6. The experiment was repeated three times independently.
Discussion
HCC is a common malignant tumor worldwide and the fourth most common cause of cancer death (The Citation2018). It is important to find effective targets for HCC therapy by uncovering the molecular mechanism underlying HCC. In this study, we found that both SNHG6 and BOP1 were upregulated in HCC tissues and cells. SNHG6 and BOP1 expression were related to TP53 mutant and tumor grade. Patients with high levels of SNHG6 or BOP1 had a poor prognosis. SNHG6 overexpression promoted proliferation and glycolysis and inhibited apoptosis in HCC cell lines by binding BOP1 proteins. Our results indicated that SNHG6 and BOP1 could be latent prognosis markers and therapeutic targets for HCC patients.
LncRNAs are a class of RNAs with more than 200 nucleotides in length (Zhang et al. Citation2022). LncRNA can mechanically act as a competing endogenous RNA (ceRNA) and bind with miRNAs to inhibit the effect of miRNA on their target mRNAs. SNHG6 promotes G1/S-phase transition in HCC by impairing miR-204-5p-mediated inhibition of E2F1 (Chen et al. Citation2021) and promotes the progression of HCC by targeting miR-6509-5p and HIF1A (Fan et al. Citation2021). In addition to combining with miRNAs, lncRNA has also been reported to be able to bind to proteins and affect their function. Chang et al. suggested SNHG6 could affect HCC tumorigenesis by binding to up-frameshift protein 1 (Chang et al. Citation2016). SNHG6 promotes HCC progression by binding heterogeneous nuclear ribonucleoprotein L (HNRNPL) and polypyrimidine tract binding protein 1 (PTBP1) to facilitate mRNA decay of SET domain containing 7 (SETD7) and leucine zipper transcription factor-like 1 (LZTFL1) (Wang, Ma, et al. Citation2021). In our study, we found that SNHG6 could bind BOP1 protein and enhance the stability of BOP1. Our results further supplemented the function of SNHG6 on glycolysis and its underlying mechanisms in HCC.
HIF1A, known as an important gene in the metabolic reprogramming of cancer cells (Semenza Citation2013; Corcoran and O’Neill Citation2016), is reported to be a target for SNHG6 in HCC (Fan et al. Citation2021), esophageal squamous cell carcinoma (Du et al. Citation2020), and clear cell renal cell carcinoma (Zhao et al. Citation2021), indicating that SNHG6 may affect metabolic reprogramming of HCC in a HIF1A-dependent manner. We then want to know whether HIF1a is involved in the SNHG6/BOP1 signaling. Here, we found that SNHG6 could regulate the mRNA and protein expression of HIF1A in HCCLM3 and SMMC-7721 cells (Figure S1(C,D)). However, BOP1 overexpression did not affect the mRNA and protein levels of HIF1A. Moreover, HIF1A overexpression had no effect on the expression of SNHG6 and BOP1 (Figure S1(E–H)). These results indicate that HIF1A is not involved in SNHG6/BOP1 signaling. SNHG6/BOP1 signaling could regulate the metabolic reprogramming of HCC in a HIF1A-independent manner.
BOP1 plays an oncogenic role in many cancers including HCC. Chung et al. suggested that BOP1 promoted HCC metastasis by promoting epithelial-to-mesenchymal transition (Chung et al. Citation2011). In this study, we identified BOP1 as an oncogene in HCC and BOP1 overexpression promoted HCC progression by regulating the growth, glycolysis, and apoptosis. BOP1 knockdown inhibits DUSP4 and DUSP6 and increases MAPK signaling (Gupta et al. Citation2019). BOP1 also activates Wnt/β-catenin signaling by increasing the recruitment of cyclic AMP response element-binding protein (CBP) to β-catenin, enhancing CBP-mediated acetylation of β-catenin, and increasing the transcription of downstream stemness-related genes CD133 and ALDH1A1 (Levine and Puzio-Kuter Citation2021). Chen et al. indicated that lncRNA CCAT2 interacted directly with and stabilized BOP1 (Chen et al. Citation2020). Here, we identified that the interaction between SNHG6 and BOP1 protein enhanced the stability of BOP1 protein which further promoted the proliferation and glycolysis and inhibited the apoptosis of HCC cells. We revealed the function of BOP1 on HCC metabolic reprogramming.
The p53 plays an important role in the metabolic balance between glycolysis and oxidative phosphorylation (Jones and Thompson Citation2009; Levine and Puzio-Kuter Citation2010). The p53 protein promotes the production of ATP by oxidative phosphorylation by enhancing TP53-induced glycolysis regulator (TIGAR) and the synthesis of cytochrome c oxidase (SCO2) expression. TIGAR inhibits glycolysis by degrading fructose-2,6-bisphosphate (Bensaad et al. Citation2006). Loss of p53-dependent regulation of SCO2 leads to a switch in ATP production from oxidative phosphorylation to glycolysis (Matoba et al. Citation2006). Moreover, the p53 protein inhibits the transcription of the GLUT 1 and 4 transporters (Schwartzenberg-Bar-Yoseph et al. Citation2004). TP53 mutation further promotes cancer progression by enhancing glycolysis (Liu et al. Citation2015; Dando et al. Citation2016). Here, we found that SNHG6 and BOP1 expressions are significantly correlated to TP53 mutation in LIHC. LIHC patients with TP53-mutant showed higher SNHG6 and BOP1 expressions. Our study indicates that TP53 mutation may be involved in SNHG6/BOP1 signaling-mediated glycolysis.
In general, our study identified SNHG6 and BOP1 as potential biomarkers and prognostic predictors for HCC. The SNHG6-BOP1 axis regulated proliferation and apoptosis by promoting glycolysis.
Supplemental Material
Download MS Word (289.3 KB)Disclosure statement
No potential conflict of interest was reported by the author(s).
Additional information
Funding
References
- Bensaad K, Tsuruta A, Selak MA, Vidal MN, Nakano K, Bartrons R, Gottlieb E, Vousden KH. 2006. TIGAR, a p53-inducible regulator of glycolysis and apoptosis. Cell. 126:107–120.
- Chandrashekar DS, Bashel B, Balasubramanya SAH, Creighton CJ, Ponce-Rodriguez I, Chakravarthi B, Varambally S. 2017. UALCAN: a portal for facilitating tumor subgroup gene expression and survival analyses. Neoplasia. 19:649–658.
- Chang L, Yuan Y, Li C, Guo T, Qi H, Xiao Y, Dong X, Liu Z, Liu Q. 2016. Upregulation of SNHG6 regulates ZEB1 expression by competitively binding miR-101-3p and interacting with UPF1 in hepatocellular carcinoma. Cancer Lett. 383:183–194.
- Chen B, Dragomir MP, Fabris L, Bayraktar R, Knutsen E, Liu X, Tang C, Li Y, Shimura T, Ivkovic TC, et al. 2020. The long noncoding RNA CCAT2 induces chromosomal instability through BOP1-AURKB signaling. Gastroenterology. 159:2146–2162.e2133.
- Chen K, Hou Y, Liao R, Li Y, Yang H, Gong J. 2021. LncRNA SNHG6 promotes G1/S-phase transition in hepatocellular carcinoma by impairing miR-204-5p-mediated inhibition of E2F1. Oncogene. 40:3217–3230.
- Chung KY, Cheng IK, Ching AK, Chu JH, Lai PB, Wong N. 2011. Block of proliferation 1 (BOP1) plays an oncogenic role in hepatocellular carcinoma by promoting epithelial-to-mesenchymal transition. Hepatology. 54:307–318.
- Corcoran SE, O'Neill LA. 2016. HIF1alpha and metabolic reprogramming in inflammation. J Clin Invest. 126:3699–3707.
- Dando I, Cordani M, Donadelli M. 2016. Mutant p53 and mTOR/PKM2 regulation in cancer cells. IUBMB Life. 68:722–726.
- Du F, Guo T, Cao C. 2020. Silencing of long noncoding RNA SNHG6 inhibits esophageal squamous cell carcinoma progression via miR-186-5p/HIF1alpha axis. Dig Dis Scit. 65:2844–2852.
- Fan X, Zhao Z, Song J, Zhang D, Wu F, Tu J, Xu M, Ji J. 2021. LncRNA-SNHG6 promotes the progression of hepatocellular carcinoma by targeting miR-6509-5p and HIF1A. Cancer Cell Int. 21:150.
- Feng J, Li J, Wu L, Yu Q, Ji J, Wu J, Dai W, Guo C. 2020. Emerging roles and the regulation of aerobic glycolysis in hepatocellular carcinoma. J Exp Clin Cancer Res. 39:126.
- Goodall GJ, Wickramasinghe VO. 2021. RNA in cancer. Nat Rev Cancer. 21:22–36.
- Guo W, Qiu Z, Wang Z, Wang Q, Tan N, Chen T, Chen Z, Huang S, Gu J, Li J, et al. 2015. MiR-199a-5p is negatively associated with malignancies and regulates glycolysis and lactate production by targeting hexokinase 2 in liver cancer. Hepatology. 62:1132–1144.
- Gupta R, Bugide S, Wang B, Green MR, Johnson DB, Wajapeyee N. 2019. Loss of BOP1 confers resistance to BRAF kinase inhibitors in melanoma by activating MAP kinase pathway. Proc Natl Acad Sci U S A. 116:4583–4591.
- He J, Chen Z, Xue Q, Shi W. 2022. Block of proliferation 1 promotes proliferation, invasion and epithelial mesenchymal transformation in gastric cancer. Oxid Med Cell Longev. 2022:2946989.
- Heiden MG V, Cantley LC, Thompson CB. 2009. Understanding the Warburg effect: the metabolic requirements of cell proliferation. Science. 324:1029–1033.
- Hernandez-Gea V, Toffanin S, Friedman SL, Llovet JM. 2013. Role of the microenvironment in the pathogenesis and treatment of hepatocellular carcinoma. Gastroenterology. 144:512–527.
- Jafari-Oliayi A, Asadi MH. 2019. SNHG6 is upregulated in primary breast cancers and promotes cell cycle progression in breast cancer-derived cell lines. Cell Oncol (Dordr). 42:211–221.
- Jones RG, Thompson CB. 2009. Tumor suppressors and cell metabolism: a recipe for cancer growth. Genes Dev. 23:537–548.
- Lan Z, Yao X, Sun K, Li A, Liu S, Wang X. 2020. The interaction between lncRNA SNHG6 and hnRNPA1 contributes to the growth of colorectal cancer by enhancing aerobic glycolysis through the regulation of alternative splicing of PKM. Front Oncol. 10:363.
- Levine AJ, Puzio-Kuter AM. 2010. The control of the metabolic switch in cancers by oncogenes and tumor suppressor genes. Science. 330:1340–1344.
- Li S, Wu H, Huang X, Jian Y, Kong L, Xu H, Ouyang Y, Chen X, Wu G, Yu L, et al. 2021. BOP1 confers chemoresistance of triple-negative breast cancer by promoting CBP-mediated beta-catenin acetylation. J Pathol. 254:265–278.
- Liu J, Zhang C, Hu W, Feng Z. 2015. Tumor suppressor p53 and its mutants in cancer metabolism. Cancer Lett. 356:197–203.
- Lu C, Rong D, Zhang B, Zheng W, Wang X, Chen Z, Tang W. 2019. Current perspectives on the immunosuppressive tumor microenvironment in hepatocellular carcinoma: challenges and opportunities. Mol Cancer. 18:130.
- Matoba S, Kang JG, Patino WD, Wragg A, Boehm M, Gavrilova O, Hurley PJ, Bunz F, Hwang PM. 2006. P53 regulates mitochondrial respiration. Science. 312:1650–1653.
- Pu FF, Shi DY, Chen T, Liu YX, Zhong BL, Zhang ZC, Liu WJ, Wu Q, Wang BC, Shao ZW, et al. 2021. SP1-induced long non-coding RNA SNHG6 facilitates the carcinogenesis of chondrosarcoma through inhibiting KLF6 by recruiting EZH2. Cell Death Dis. 12:59.
- Rinn JL, Chang HY. 2020. Long noncoding RNAs: molecular modalities to organismal functions. Annu Rev Biochem. 89:283–308.
- Schwartzenberg-Bar-Yoseph F, Armoni M, Karnieli E. 2004. The tumor suppressor p53 down-regulates glucose transporters GLUT1 and GLUT4 gene expression. Cancer Res. 64:2627–2633.
- Semenza GL. 2013. HIF-1 mediates metabolic responses to intratumoral hypoxia and oncogenic mutations. J Clin Invest. 123:3664–3671.
- Strezoska Z, Pestov DG, Lau LF. 2000. Bop1 is a mouse WD40 repeat nucleolar protein involved in 28S and 5. 8S RRNA processing and 60S ribosome biogenesis. Mol Cell Biol. 20:5516–5528.
- Teoh ST, Lunt SY. 2018. Metabolism in cancer metastasis: bioenergetics, biosynthesis, and beyond. Wiley Interdiscip Rev Syst Biol Med. 10:e1406. doi:10.1002/wsbm.1406
- The L. 2018. GLOBOCAN 2018: counting the toll of cancer. Lancet. 392:985.
- Wang H, Ma P, Liu P, Guo D, Liu Z, Zhang Z. 2021. lncRNA SNHG6 promotes hepatocellular carcinoma progression by interacting with HNRNPL/PTBP1 to facilitate SETD7/LZTFL1 mRNA destabilization. Cancer Lett 520:121–131.
- Wang Y, Liu J, Yao Q, Wang Y, Liu Z, Zhang L. 2021. LncRNA SNHG6 promotes Wilms’ tumor progression through regulating miR-429/FRS2 axis. Cancer Biother Radiopharm. doi:10.1089/cbr.2020.3705
- Wei J, Gao Y, Li Z, Jia H, Han B. 2021. LncRNA SNHG6 facilitates cell proliferation, migration, invasion and EMT by upregulating UCK2 and activating the Wnt/beta-catenin signaling in cervical cancer. Bioorg Chem. 120:105488.
- Xu H, He Y, Ma J, Zhao Y, Liu Y, Sun L, Su J. 2020. Inhibition of pyruvate dehydrogenase kinase1 by dicoumarol enhances the sensitivity of hepatocellular carcinoma cells to oxaliplatin via metabolic reprogramming. Int J Oncol. 57:733–742.
- Xu M, Chen X, Lin K, Zeng K, Liu X, Xu X, Pan B, Xu T, Sun L, He B, et al. 2019. lncRNA SNHG6 regulates EZH2 expression by sponging miR-26a/b and miR-214 in colorectal cancer. J Hematol Oncol. 12:3.
- Zhang Y, Luo M, Cui X, O’Connell D, Yang Y. 2022. Long noncoding RNA NEAT1 promotes ferroptosis by modulating the miR-362-3p/MIOX axis as a ceRNA. Cell Death Differ. 29(9):1850–1863.
- Zhao P, Deng Y, Wu Y, Guo Q, Zhou L, Yang X, Wang C. 2021. Long noncoding RNA SNHG6 promotes carcinogenesis by enhancing YBX1-mediated translation of HIF1alpha in clear cell renal cell carcinoma. FASEB J 35:e21160.
- Zheng X, Gou Y, Jiang Z, Yang A, Yang Z, Qin S. 2021. Icaritin-induced FAM99A affects GLUT1-mediated glycolysis via regulating the JAK2/STAT3 pathway in hepatocellular carcinoma. Front Oncol. 11:740557.