
ABSTRACT
Sex is a major biological factor in the development and physiology of a sexual reproductive organism, and its role in the growing process is needed to be investigated in various species. We compare blood transcriptome between 5 males and 5 females in 4-week-old Rhode Island Red chickens and perform functional annotation of differentially expressed genes (DEGs). The results are as follows. 141 and 109 DEGs were located in autosomes and sex chromosomes, respectively. The gene ontology (GO) terms are significantly (p < 0.05) enriched, which were limb development, inner ear development, positive regulation of dendrite development, the KEGG pathway the TGF-beta signaling pathway, and melanogenesis (p < 0.05). These pathways are related to morphological maintenance and growth of the tissues. In addition, the SMAD2W and the BMP5 were involved in the TGF-beta signaling pathway, and both play an important role in maintaining tissue development. The major DEGs related to the development of neurons and synapses include the up-regulated NRN1, GDF10, SLC1A1, BMP5, NBEA, and NRXN1. Also, 7 DEGs were validated using RT-qPCR with high correlation (r2 = 0.74). In conclusion, the differential expression of blood tissue in the early growing chicken was enriched in TGF-beta signaling and related to the development of neurons and synapses including SMAD2W and BMP5. These results suggest that blood in the early growing stage is differentially affected in tissue development, nervous system, and pigmentation by sex. For future research, experimental characterization of DEGs and a holistic investigation of various tissues and growth stages will be required.
Introduction
Sex is an important factor for growth and physiological status. Poultry is included in the factor (Chamruspollert et al. Citation2002). In previous studies, differences in the growth of tissues were observed between sexes, and these differences were also detected as carcass, fatty acids, glucose, cholesterol, etc. in physiological and blood parameter analysis (Rondelli et al. Citation2003; Salim et al. Citation2012). In addition, sexes and environmental conditions show that females are exposed to aggression and male can indicate copulation-solicitation displays during the breeding season, different behavioral aspects such as hormone and endocrine responses by differential gene expression. The steroid hormone in serum is shown differences between sexes (Gahr Citation2001; Wang Y et al. Citation2019). Also, biological characteristics in poultry are regulated through gene expression. Some genes are differentially expressed between sexes, and these genes are overexpressed in sex chromosomes (Brothers et al. Citation2019). Besides, the growth stages of chickens are generally constituted with early growth stage (4–16-weeks), late growth stage (by 24-weeks), and mature growth stage (after 24-weeks), which can be a factor in phenotype, physiological parameters, and genes expression with sexes. These are reported to be effective before the mature growth stage (Podisi et al. Citation2013; Li et al. Citation2017; Xue et al. Citation2017; Ono et al. Citation2022). Especially, the early growth stage is expressed various gens related growth for lipid metabolism and hormone regulation in adipose and muscle tissues, and sexes are led to factors affecting differentially expressed genes at this point (Dridi et al. Citation2007; Abdullah et al. Citation2010; Ons et al. Citation2010; Yu-Jiang et al. Citation2020). However, previous studies were performed using entrails, However, blood was not used in most studies.
In poultry, females have ZW sex chromosomes and males have ZZ sex chromosomes for sex determination, and thus, poultry chromosomes are different from mammals (Bellott et al. Citation2017). Some animals were females heterogamety as ZW and highly expressed genes in the W chromosome appeared to have evolved from autosomes, which were identified through gene assembly in previous studies (Nam and Ellegren Citation2008). Also, the Z chromosome was contrasted with the Y chromosome of mammals and was commonly studied to understand the sex determination process in chickens (Storchová and Divina Citation2006). Among the identified genes, HINTW (Histidine triad nucleotide binding protein W), HNRNPKL (Heterogeneous nuclear ribonucleoprotein K-like), SMAD2W (SMAD family member 2 W), and SPINW (Spindlin W) are homologous genes in the W chromosome, related to growth and development of tissues in the ovary (Ceplitis and Ellegren Citation2004; Kaiser and Ellegren Citation2006; Mishra et al. Citation2020). Especially, homologous genes from the W chromosome were overexpressed in female-specific tissue as the ovary, which could inhibit homologous genes of the Z chromosome. These genes are observed with a higher gene expression than autosome genes (Bellott et al. Citation2017). The W chromosome is typically smaller than the Z chromosome, and at least 70% includes repetitive sequences that inhibit the completion of chromosome assembly. So, such genes are not completely mapped, and little is known about their gene expression. (Tomaszkiewicz et al. Citation2017). In provided studies, transcriptomic comparison between sexes is focused on detecting sex-biased gene and related sex chromosome, whereas compared studies using normal gene and their roles with autosomes is not common. Especially, such studies were not reported in chicken blood of early growth stage, are reported in mammals, and are not completely determined with poultry blood (Jansen et al. Citation2014; Ramstad et al. Citation2016; Wang J et al. Citation2021). The muscle and gonad tissues were used in provided studies (Bai et al. Citation2020; He et al. Citation2020).
Therefore, we investigate differentially expressed genes and their roles between males and females through transcriptome analysis using RNA-sequencing in blood from 4-week-old Rhode Island Red chickens. We contribute to research by understanding their genes and metabolic pathways through gene functional analysis in female chickens.
Materials and methods
Animal experiments
In animal experiments, we reared localized Rhode Island Red chickens of a pure line from a pedigree selection. All animals were vaccinated according to the vaccine program of the poultry institute, NIAS. These animals were housed in battery cages (0.6728 m2/cell, 0.034 m2/bird). The animals were divided into male and female groups, and the animals had ad libitum access to water and feed according to the feed program for 4 weeks (CP 19%, ME 2850 kcal). For RNA-sequencing and RT-qPCR (Real-time Quantification PCR), 1–2 ml blood samples were drawn through the wing vein from 5 males and 5 females, and stored in an RNAlater (Thermo Fisher Scientific, Carlsbad, CA, USA) on −20°C. The animal experiment and sacrifice followed ethical guidelines in Poultry research at the National Institute of Animal Science (NIAS20191550).
RNA isolation and sequencing
For the isolation of RNA, we used the column method following the manufacturer's protocol in each 1 ml blood sample. First, the stored blood samples were centrifuged at 13,000 rpm at 4°C for 20 m, and obtained RNA pellets from centrifuged blood samples. Next, the RNA pellet was purified utilizing ReliaPrep™ RNA Miniprep Systems (Promega, Madison, Wisconsin, USA), and purified RNA was used for cDNA synthesis with SuperScript™ III First-Strand Synthesis System (Thermo Fisher Scientific, Carlsbad, CA, USA) and RNA-sequencing. We synthesized RNA to cDNA was stored at −20°C for RT-qPCR. Then, isolated RNA was measured for integrity and purity through a 2100 Bioanalyzer and RNA Nano 6000 Assay Kit (Agilent Technologies, Santa Clara, CA, USA). The RNA samples identified RIN (RNA integrity number) values, and > 8 were used for the library construction of the random fragmentation of cDNA. The library was constructed using a TruSeq Stranded Total RNA LT Sample Prep Kit (Illumina, San Diego, CA, USA) by following the manufacturer's protocol, sequencing was performed using an Illumina HiSeq 4000 platform with generated paired-end reads. After sequencing, FASTQ raw read files for post-analysis were converted using the bcl2fastq Illumina package from BCL image files.
Quality control, mapping and counting
For quality control and trimming with < Q20, adapters, and N base in raw reads, we performed FastQC v0.11.5 (released 8 Mar 2016, https://www.bioinformatics.babraham.ac.uk/projects/fastqc) and Trimmomatic v0.39 (Bolger et al. Citation2014). Then, generated clean reads were mapped to the chicken (GRCg6a.104) reference-based genome using Hisat2 v2.2.1 (Kim et al. Citation2019). The mapped reads were annotated based on GRCg6a.104 and counted using featureCounts of the Subread package v2.0.1 (Liao et al. Citation2014). The read counts were identified using a PCA (Principal Component Analysis) plot through a converted log₂+1 value and a calculated PC (Principal Component) value, and we performed DEG (differentially expressed gene) analysis using count files.
Differentially expressed genes analysis
We determined DEGs between the male and female groups using edgeR package v3.32.0 in R v4.0.3 (Robinson et al. Citation2010). First, below 10 gene expression counts in the sum of 10 animals were filtered. Thus, the TMM (Trimmed Mean of M-values) method was used for normalization, and estimating dispersions values were acquired. DEGs were considered FDR (False Discovery rate) < 0.05 and 1.0 ± ≤log2FC (log2 Fold change). Such DEGs were used to draw the heatmap for visualization. Then, DEGs were divided by up-regulated genes and down-regulated genes following the log2FC value. Finally, characterized protein-coding genes in localized chromosomes were sorted from divided DEGs for functional analysis.
Gene ontology, KEGG pathway and network analysis
Enrichment analyses were performed on the determined DEGs using DAVID (Database for Annotation, Visualization, and Integrated Discovery) web tool for identifying gene annotation, molecular function, cellular component, biological processes, and gene pathways with EASE <0.1 (Huang et al. Citation2009). The selected databases and chicken (gallus gallus) species were GO (Gene Ontology) and KEGG (Kyoto Encyclopedia of Genes and Genomes Pathway) on DAVID (Ashburner et al. Citation2000; Kanehisa and Goto Citation2000). Visualization for biological term analysis and functionally grouped network through the ClueGO plugin on GO and KEGG database with p < 0.05 were performed on the top pathway genes (Bindea et al. Citation2009).
RT-qPCR for validation
We selected 7 genes (7 target genes and 2 reference genes) including Z and W chromosome genes in DEGs, and each sample was performed RT-qPCR through 3-replication. Gene expression patterns were identified for validation of the transcriptomic analysis through RNA-sequencing. A total of 7 target genes were selected according to overexpressed homologous genes, enrichment pathways genes, and randomization. The gene primers provided in sheet data 1 of the Supplementary excel file and the obtained Ct value were calculated using the 2−ΔΔCt method (Livak and Schmittge Citation2001).
Statistical analysis
Overall statistical analysis was considered with p < 0.05. The physiological parameters were compared in the male and female groups through a t-test. The DEGs were performed following the previous description. The PCA plot, bar plot, and heatmap were performed using ggfortify v0.4.11 (released 3 Oct 2020, github.com/sinhrks/ggfortify), ggplot2 v3.3.3 (released 4 Jan 2021, cran.r-project.org/web/packages/ggplot2/ggplot2.pdf), and pheatmap package v1.0.12 (released 4 Jan 2019, cran.r-project.org/web/packages/pheatmap/pheatmap.pdf) in R for visualization.
Results
Construction of the raw reads and mapping
A total of 10 blood samples from the chicken generated raw read count from 62,069,934 to 88,994,230. The Q20 and Q30 percentages were 97.65% to 98.44% and 93.67% to 95.26%. The CG percentages were 43.94% to 45.70%, and the raw reads were mapped at 73.26% to 85.56% to the chicken reference-based genome. Detailed information is provided in sheet data 2 of the Supplementary excel file.
Identification of DEGs
We obtained DEGs with an FDR of <0.05 and 1.0±≤log2FC. Out of 24,356 genes, 15,047 genes were identified after filtering. DEGs with the protein-coding gene were 316 constructed genes, and mRNAs with characterized genes were 151 up-regulated genes and 99 down-regulated genes in females. In the chromosomes, the W chromosome had the highest percentage of DEGs, and 54 DEGs were identified out of a total of 86 genes ( and ). The top 5 up-regulated DEGs were NRN1 (Neuritin 1), BMX (BMX Non-Receptor Tyrosine Kinase), TMPRSS15 (Transmembrane Serine Protease 15), NPSR1 (Neuropeptide S Receptor 1) and PAX1 (Paired Box 1). The top 5 down-regulated DEGs were ENSGALG00000053810 (Re-verse transcriptase domain-containing protein), SHC2 (SHC Adaptor Protein 2), FAM81A (Family with Sequence Similarity 81 Member A), CYGB (Cytoglobin), and ENSGALG00000049056 (Reverse transcriptase domain-containing protein). Detailed information on top 10 DEGs can be identified in and sheet data 3 of the Supplementary excel file.
Figure 1. (a) Principal component analysis between Male and Female groups, (b) Heatmap showing the detected DEGs and samples, the magenta and blue colors indicated up-regulated and down-regulated genes, respectively.
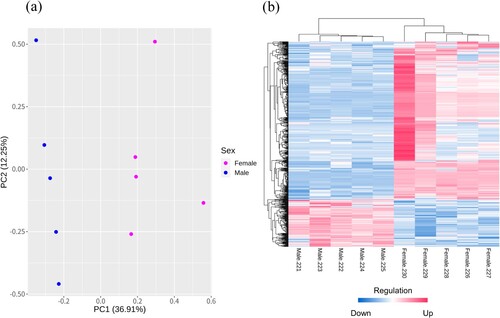
Figure 2. Volcano plot with the top 10 DEGs; each dot color is shown pink as up-regulated and blue as down-regulated
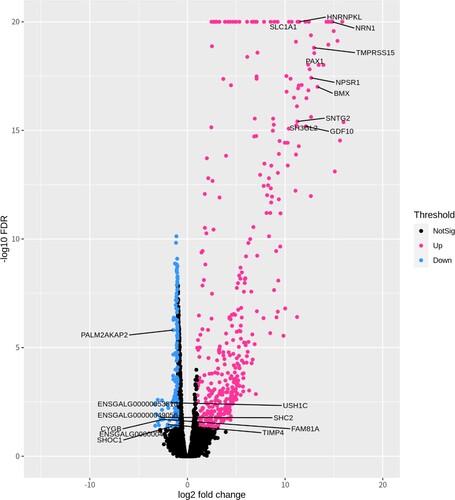
Table 1. Percentage of DEGs into chromosomes in females.
Function and pathway analysis of the DEGs.
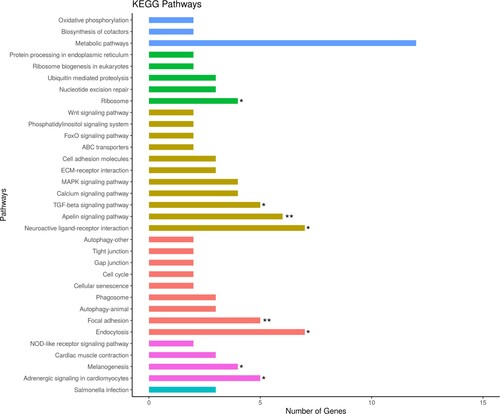
For functional analysis, the identified 250 DEGs were used for the GO and KEGG pathway analyses. The GO analysis was based on DAVID. We identified 15 biological processes, 3 cellular components, and 5 molecular functions with EASE <0.1 and p < 0.05 (). The top 10 GO terms were proteinaceous extracellular matrix (GO:0005578), positive regulation of axonogenesis (GO:0050772), limb development (GO:0060173), negative regulation of the neuron apoptotic process (GO:0043524), extracellular-glutamate-gated ion channel activity (GO:0005234), AMPA glutamate receptor complex (GO:0032281), calcium ion binding (GO:0005509), clathrin-coated pit (GO:0005905), homophilic cell adhesion via plasma membrane adhesion molecules (GO:0007156), and negative regulation of negative chemo-taxis (GO:0050925). The KEGG pathway analysis detected a total of 33 pathways (). Detailed information on GO terms is provided in sheet data 4 of the Supplementary excel file.
Figure 3. Enriched gene ontology; p-value indicated and GO term of up-regulated genes were shown as red (Biological Processes), violet (Molecular Functions) and magenta (Cellular Components) colors; GO term of down-regulated genes were shown as blue (Biological Processes) and cyan (Molecular Functions) colors. * p < 0.05, ** p < 0.01, *** p < 0.001.
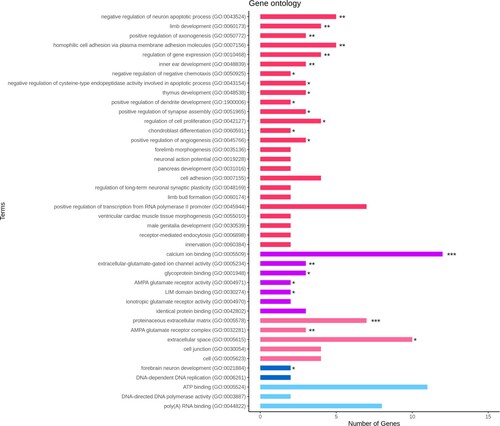
Figure 4. Detected KEGG Pathways; denoted by different colors for the various pathway types and by the number of DEGs. * p < 0.05, ** p < 0.01.
Network enrichment analysis
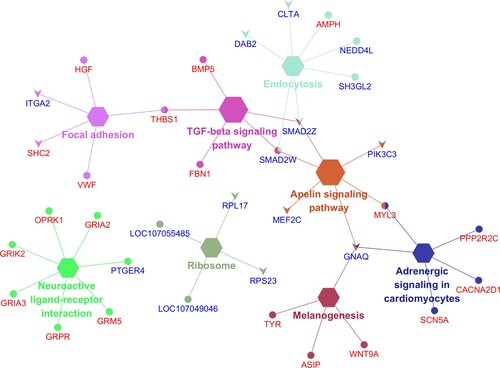
From the identified KEGG pathways, we identified the enrichment pathways with p < 0.05. The 8 enriched pathways were Endocytosis, Neuroactive ligand–receptor interaction, Apelin signaling pathway, Focal adhesion, Adrenergic signaling in cardiomyocytes, TGF-beta signaling pathway, Melanogenesis, and Ribosome, which are indicated as the gene network in . The information of enriched pathways is indicated in sheet data 5 of the Supplementary excel file.
Figure 5. Enriched gene network of the top KEGG pathways analysis with the elliptical shape representing the upregulated genes and the V shape representing the down-regulated genes, red text as the autosome and blue text as the sex chromosome genes, respectively.
Validation of DEGs through RT-qPCR
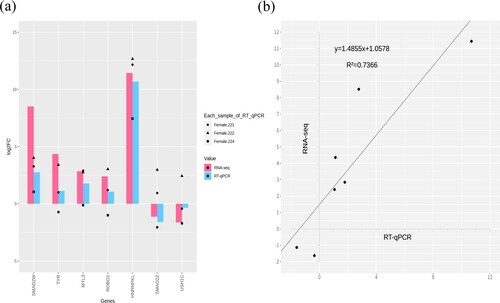
We performed expression validation of DEGs through RT-qPCR, and selected genes such as HNRNPKL, SMAD2W, ROBO1 (Roundabout Guidance Receptor 1), TYR (Tyrosinase), MYL3 (myosin light chain 3), SMAD2Z (SMAD family member 2 Z), and USH1C (USH1 Protein Network Component Harmonin) among the DEGs. As shown in , we correlated the results between RNA-sequencing and RT-qPCR with r2 = 0.7366. The results of RT-qPCR followed the results of RNA-sequencing in up- and down-regulated genes.
Figure 6. (a) RT-qPCR and RNA-seq results were compared through the bar plot, RNA-sequencing with log2FC and RT-qPCR with 2-ΔΔCt indicated the magenta and blue color; (b) Correlation (r2) plot of log2FC and 2-ΔΔCt.
Discussion
In this study, we compared differentially expressed genes between 4-week-old males and females in Rhode Island Red chickens. Among a total of 250 DEGs in females with functional characterization, 105, 36, and 109 genes were located in Z chromosomes, W chromosomes, and autosomes, respectively. In females, a higher percentage of DEGs was observed in Z and W chromosomes than autosomes, characterized DEGs in the Z chromosome were constituted 22 in up-regulated and 83 in down-regulated with 41.86% of DEGs (). These results are known as dosage compensation mechanisms that occur in heterogametic systems, and such mechanisms are equalized different genes expression by number of sex chromosomes (Julien et al. Citation2012). Especially, chickens have an incomplete dosage compensation mechanism in Males, is reported that Z chromosome genes in male-derived (ZZ) showed to be more highly expressed than in female-derived (ZW) (Uebbing et al. Citation2015; Graves Citation2016). Besides, 36 W chromosome DEGs were identified with 41.86% of DEGs in females. The W chromosome genes of avians had been kept non-transferring between chromosomes including loss of genes, sequence deletions, and repetitive sequence for a large amount of time, and these genes were highly expressed with an unclear number of genes (Ayers et al. Citation2013; Mishra et al. Citation2020). Thus, the identified DEGs in sex chromosomes between different sexes should be considered for interpretation. In functional analysis, we detected the enrichment of GO terms, and the KEGG pathway as the Apelin signaling pathway, the melanogenesis, and the adrenergic signaling in cardiomyocytes (p < 0.05). These pathways are related to animal growth with TYR, MEF2C, SCN5A, and MYL3 (Wang Z et al. Citation2015; D’Mello et al. Citation2016; Mishra et al. Citation2020).
The HNRNPKL, HINTW, SMAD2W, ATP5F1AW (ATP synthase F1 subunit alpha W), SPINW, LOC100858742 (RNF111_N do-main-containing protein), and SMAD2Z were up-regulated in the W chromosome. These DEGs are known as a major role in tissue development (Ceplitis and Ellegren Citation2004; Rallabandi et al. Citation2019). Moreover, these DEGs are highly expressed in various other tissues, which means that DEGs are not only related to sex determination. Also, those genes functioned as the indirect development of genital gland tissue in females, DNA binding, gene expression, cell division, and signaling transmission (Amberger et al. Citation2015). In the Z chromosome, SLC1A1 (Solute Carrier Family 1 Member 1), SH3GL2 (SH3 Domain Containing GRB2 Like 2), RORB and RASEF (RAS and EF-Hand Domain Containing) were up-regulated. These genes had roles in the nervous system, hormone regulation, and GTP binding (Kaiser and Ellegren Citation2006; Amberger et al. Citation2015). Functional annotation of DEGs had similar results in the GO term and KEGG pathways analysis. Expressed genes in both sexes were identified as mostly non-sex-specific (Rogers et al. Citation2021). For example, SMAD2W and SMAD2Z play roles in the production and growth of tissues, which are regulated differently between sexes. In autosomes, DEGs were MYL3, BMP5, NRN1, BMX, TMPRSS15, NPSR1, and PAX1, which are known to perform roles in the nervous system and tissue development (Amberger et al. Citation2015). In the DEGs, NRN1, GDF10 (Growth Differentiation Factor 10), SLC1A1, BMP5, NBEA (Neurobeachin) and NRXN1 (Neurexin 1) contribute to the development of neurons and synapse system during the growth stage (Patzke and Ernsberger Citation2000; Beck et al. Citation2001; Mecklenburg et al. Citation2014; Thompson et al. Citation2014; Zito et al. Citation2014; Miller et al. Citation2015). However, such as DEGs, not showing in enrichment analysis, are identified in only DEGs. Moreover, their expression is not described to occur in only females with lacking physiological data. Thus, such results consider that major DEGs are not influenced directly by their role, which can be expressed various genes and reveal hormones related to growth by early growth stage (Jia et al. Citation2018; Johnsson et al. Citation2018).
Overall, enrichment pathways were mostly related to growth and development of tissues with GO terms. The 4-weeks old chickens are able to distinguish later sexes with sexual maturity, the identified DEGs and their roles showing that they were growing up through related gene expression (Anh et al. Citation2015). Among the enrichment pathways, the TGF-beta signaling pathway plays an important role in the growth and maintenance of various tissues with BMP (Miyazono Citation2000; Zuo et al. Citation2017). Especially, BMP5 has a role in ovary development by TGF-beta signaling pathway activation (Shimasaki et al. Citation2004; Divya and Bhattacharya Citation2021). The SMAD2 is important in the TGF-beta signaling pathway, which could affect the growth of tissues with the female genital. Thus, the deactivation of the TGF-beta signaling pathway is caused by the reduction of generative functions (Ross and Hill Citation2008). With BMPs and SMADs, the TGF-beta signaling pathway may be enriched for the growth and development of ovaries, such appears to be related development of various tissues at the growth stage in this result (Zhang et al. Citation2018; Umair et al. Citation2020). The activation of the melanogenesis pathway is related to an increase in melanin synthesis. TYR (Tyrosinase) in chromosome 1 of chickens is known as an important component of the melanogenesis pathway. TYR synthesis of melanin including pigmentation of skin and feathers is affected by androgens in females by the melanogenesis pathway (Yu et al. Citation2019). The melanogenesis pathway is activated more in males than females, and is known to affect the pigmentation of skin and feathers (Slominski et al. Citation2004). Therefore, activation of the melanogenesis pathway is associated with the up-regulation of TYR, which are Tyrosinase related protein 1 and Tyrosinase related protein 2 genes in avian (D’Mello et al. Citation2016). In addition, these pathways are involved in the central nervous, circulatory system, growth regulation, cell migration, and signal transduction for growth (Beck et al. Citation2001). However, environmental factors are not ignored during melamine synthesis, and genetic effects can associate with their pathway activation (Galván and Solano Citation2016). The sex hormones with estrogen are associated with the activation of the TGF-beta signaling pathway, which is known to activate ovarian growth and cell differentiation with BMP5 (Shah and Rogers Citation2018). However, enrichment pathways are not sex-specific in females, because of some of the pathway functions, and the results of significant GO terms and KEGG pathways with DEGs. Also, these results to be identified in only females are hard to describe their meaning, which is needed to elucidate the mechanism of expressed genes changes in different sexes. Moreover, we performed validation of 7 DEGs through RT-qPCR. Seven target genes were identified through a correlation between DEGs analysis and RT-qPCR.
In conclusion, DEGs with W chromosome had the highest percentage in females, and DEGs were involved in various pathways than the DEGs of autosomes. The DEGs were related to tissue growth and the circulatory system in blood. The activation of TGF-beta signaling pathway was activated through up-regulated SMAD2W and BMP5. Up-regulated WNT9A, ASIP, and TYR activated the melanogenesis pathway and are known to be related to growth and melanin synthesis in the feathers of animals, the circulatory system as well as functions in the maintenance of blood, which are known to be associated with melamine synthesis for pigmentation in skin and feathers. However, most identified pathways are roles for animal growth and melanin with TGF-beta signaling and melanogenesis pathway. There does not appear to be a female-specific role for ovary development in this study. The sex-determination mechanism in avians is not clear, and the composition of the chromosome is not fully known. Such results appear to be shown related to features of expressed genes at the early growth stage, and their mechanism should be more investigated. Thus, some up-regulated genes in the growth stage may function in tissue development and pigmentation. We suggest the need for experimental characterization of DEGs.
Conclusions
This study identified differentially expressed genes between males and females with pathways in Rhode Island Red breed chickens. The animals are divided into male and female groups of 5 animals each. Hence, transcriptome analysis through RNA-sequencing on the 10 chicken blood samples is performed. The characterized 141 DEGs with sex chromosomes and 109 DEGs with autosomes were identified in the females. In the functional analysis, 23 GO terms were identified, 8 KEGG pathways appear significant, and the pathways involved in tissue development and growth and nervous systems are identified in the early growing stage. Especially, the TGF-beta signaling pathway is activated with the SMAD2 and BMP5, and the melanogenesis pathway with the TYR. These pathways are also related to tissue development and the synthesis of melamine for pigmentation in blood. These findings consider that the identified DEGs and their roles showed features of expressed genes at the early growth stage, and further studies are needed for detecting their mechanism. Validation of DEGs is performed through RT-qPCR, and a correlation is identified. Therefore, we suggest that experimental characterization of DEGs is required to investigate various tissues.
Supplemental Material
Download MS Excel (133.2 KB)Disclosure statement
No potential conflict of interest was reported by the author(s).
Additional information
Funding
References
- Abdullah AY, Al-Beitawi NA, Rjoup MMS, Qudsieh RI, Ishmais MAA. 2010. Growth performance, carcass and meat quality characteristics of different commercial crosses of broiler strains of chicken. J Poult Sci. 47(1):13–21.
- Amberger JS, Bocchini CA, Schiettecatte F, Scott AF, Hamosh A. 2015. OMIM.org: online Mendelian inheritance in Man (OMIM®), an online catalog of human genes and genetic disorders. Nucleic Acids Res. 43:D789–D798.
- Anh NTL, Kunhareang S, Duangjinda M. 2015. Association of chicken growth hormones and insulin-like growth factor gene polymorphisms with growth performance and carcass traits in Thai broilers. Asian-Australas J Anim Sci. 28(12):1686–1695.
- Ashburner M, Ball CA, Blake JA, Botstein D, Butler H, Cherry JM, Davis AP, Dolinski K, Dwight SS, Eppig JT, et al. 2000. Gene ontology: tool for the unification of biology. Nat Genet. 25:25–29.
- Ayers KL, Davidson NM, Demiyah D, Roeszler KN, Grützner F, Sinclair AH, Oshlack A, Smith CA. 2013. RNA sequencing reveals sexually dimorphic gene expression before gonadal differentiation in chicken and allows comprehensive annotation of the W-chromosome. Genome Biol. 14:R26.
- Bai D-P, Chen Y, Hu Y-Q, He W-F, Shi Y-Z, Fan Q-M, Luo R-T, Li A. 2020. Transcriptome analysis of genes related to gonad differentiation and development in Muscovy ducks. BMC Genomics. 21:438.
- Beck HN, Drahushuk K, Jacoby DB, Higgins D, Lein PJ. 2001. Bone morphogenetic protein-5 (BMP-5) promotes dendritic growth in cultured sympathetic neurons. BMC Neurosci. 2:1–11.
- Bellott DW, Skaletsky H, Cho T-J, Brown L, Locke D, Chen N, Galkina S, Pyntikova T, Koutseva N, Graves T, et al. 2017. Avian W and mammalian Y chromosomes convergently retained dosage-sensitive regulators. Nat Genet. 49:387–394.
- Bindea G, Mlecnik B, Hackl H, Charoentong P, Tosolini M, Kirilovsky A, Fridman W-H, Pagès F, Trajanoski Z, Galon J. 2009. ClueGO: a Cytoscape plug-in to decipher functionally grouped gene ontology and pathway annotation networks. Bioinformatics. 25:1091–1093.
- Bolger AM, Lohse M, Usadel B. 2014. Trimmomatic: a flexible trimmer for illumina sequence data. Bioinformatics. 30:2114–2120.
- Brothers B, Zhuo Z, Papah MB, Abasht B. 2019. RNA-Seq analysis reveals spatial and sex differences in pectoralis major muscle of broiler chickens contributing to difference in susceptibility to wooden breast disease. Front Physiol. 10:1–14.
- Ceplitis H, Ellegren H. 2004. Adaptive molecular evolution of HINTW, a female-specific gene in birds. Mol Biol Evol. 21:249–254.
- Chamruspollert M, Pesti GM, Bakalli RI. 2002. Determination of the methionine requirement of Male and female broiler chicks using an indirect amino acid oxidation method. Poult Sci. 81:1004–1013.
- Divya D, Bhattacharya TK. 2021. Bone morphogenetic proteins (BMPs) and their role in poultry. Worlds Poult Sci J. 77:539–564.
- D’Mello SAN, Finlay GJ, Baguley BC, Askarian-Amiri ME. 2016. Signaling pathways in melanogenesis. Int J Mol Sci. 17:1–18.
- Dridi S, Taouis M, Gertler A, Decuypere E, Buyse J. 2007. The regulation of stearoyl-CoA desaturase gene expression is tissue specific in chickens. J Endocrinol. 192:229–236.
- Gahr M. 2001. Distribution of sex steroid hormone receptors in the avian brain: functional implications for neural sex differences and sexual behaviors. Microsc Res Tech. 55(1):1–11. doi:10.1002/jemt.1151.
- Galván I, Solano F. 2016. Bird integumentary melanins: biosynthesis, forms, function and evolution. Int J Mol Sci. 17:520.
- Graves JAM. 2016. Evolution of vertebrate sex chromosomes and dosage compensation. Nat Rev Genet. 17(1):33–46.
- He M, Wu P, Chen F, Zhang B, Chen L, Zhang T, Zhang L, Li P, Wang J, Zhang G. 2020. Transcriptome analysis of leg muscles in fast and slow growth Bian chickens. Anim Biotechnol. 31:295–305.
- Huang DW, Sherman BT, Lempicki RA. 2009. Systematic and integrative analysis of large gene lists using DAVID bioinformatics resources. Nat Protoc. 4:44–57.
- Jansen R, Batista S, Brooks AI, Tischfield JA, Willemsen G, Gv G, Hottenga J-J, Milaneschi Y, Mbarek H, Madar V, et al. 2014. Sex differences in the human peripheral blood transcriptome. BMC Genomics. 15:33.
- Jia J, Ahmed I, Liu L, Liu Y, Xu Z, Duan X, Li Q, Dou T, Gu D, Rong H, et al. 2018. Selection for growth rate and body size have altered the expression profiles of somatotropic axis genes in chickens. PLOS ONE. 13(4):e0195378.
- Johnsson M, Henriksen R, Höglund A, Fogelholm J, Jensen P, Wright D. 2018. Genetical genomics of growth in a chicken model. BMC Genomics. 19(1):72.
- Julien P, Brawand D, Soumillon M, Necsulea A, Liechti A, Schütz F, Daish T, Grützner F, Kaessmann H. 2012. Mechanisms and evolutionary patterns of mammalian and avian dosage compensation. PLoS Biol. 10(5):e1001328.
- Kaiser VB, Ellegren H. 2006. Nonrandom distribution of genes with sex-biased expression in the chicken genome. Evolution. 60:1945–1951.
- Kanehisa M, Goto S. 2000. KEGG: Kyoto encyclopedia of genes and genomes. Nucleic Acids Res. 28:27–30.
- Kim D, Paggi JM, Park C, Bennett C, Salzberg SL. 2019. Graph-based genome alignment and genotyping with HISAT2 and HISAT-genotype. Nat Biotechnol. 37:907–915.
- Li J, Yuan J, Miao Z, Guo Y. 2017. Effects of age on intestinal phosphate transport and biochemical values of broiler chickens. Asian-Australas J Anim Sci. 30(2):221–228. eng.
- Liao Y, Smyth GK, Shi W. 2014. Featurecounts: an efficient general purpose program for assigning sequence reads to genomic features. Bioinformatics. 30:923–930.
- Livak KJ, Schmittgen TD. 2001. Analysis of relative gene expression data using real-time quantitative PCR and the 2−ΔΔCT method. Methods. 25:402–408.
- Mecklenburg N, Martinez-Lopez JE, Moreno-Bravo JA, Perez-Balaguer A, Puelles E, Martinez S. 2014. Growth and differentiation factor 10 (Gdf10) is involved in Bergmann glial cell development under Shh regulation. Glia. 62(10):1713–1723. eng.
- Miller AC, Voelker LH, Shah AN, Moens CB. 2015. Neurobeachin is required postsynaptically for electrical and chemical synapse formation. Curr Biol. 25(1):16–28. eng.
- Mishra SK, Chen B, Zhu Q, Xu Z, Ning C, Yin H, Wang Y, Zhao X, Fan X, Yang M, et al. 2020. Transcriptome analysis reveals differentially expressed genes associated with high rates of egg production in chicken hypothalamic-pituitary-ovarian axis. Sci Rep. 10:1–8.
- Miyazono K. 2000. Positive and negative regulation of TGF-beta signaling. J Cell Sci. 113:1101–1109.
- Nam K, Ellegren H. 2008. The chicken (Gallus gallus) Z chromosome contains at least three nonlinear evolutionary strata. Genetics. 180:1131–1136.
- Ono R, Miyachi H, Usui H, Oguchi R, Nishimura K, Takahashi K, Yamagishi Y, Kawamura N, Matsushita R, Goto T. 2022. Phenotypic analysis of growth and morphological traits in miniature breeds of Japanese indigenous chickens. J Poult Sci. 59(1):38–47.
- Ons E, Gertler A, Buyse J, Lebihan-Duval E, Bordas A, Goddeeris B, Dridi S. 2010. Visfatin gene expression in chickens is sex and tissue dependent. Domest Anim Endocrinol. 38:63–74.
- Patzke H, Ernsberger U. 2000. Expression of neurexin Iα splice variants in sympathetic neurons: selective changes during differentiation and in response to neurotrophins. Mol Cell Neurosci. 15(6):561–572. eng.
- Podisi BK, Knott SA, Burt DW, Hocking PM. 2013. Comparative analysis of quantitative trait loci for body weight, growth rate and growth curve parameters from 3 to 72 weeks of age in female chickens of a broiler–layer cross. BMC Genet. 14(1):22.
- Rallabandi HR, Yang H, Jo YJ, Lee HC, Byun SJ, Lee BR. 2019. Identification of female specific genes in the W chromosome that are expressed during gonadal differentiation in the chicken. Korean J Poult Sci. 46:287–296.
- Ramstad KM, Miller HC, Kolle G. 2016. Sixteen kiwi (Apteryx spp) transcriptomes provide a wealth of genetic markers and insight into sex chromosome evolution in birds. BMC Genomics. 17:1–14.
- Robinson MD, McCarthy DJ, Smyth GK. 2010. Edger: a bioconductor package for differential expression analysis of digital gene expression data. Bioinformatics. 26:139–140.
- Rogers TF, Palmer DH, Wright AE. 2021. Sex-specific selection drives the evolution of alternative splicing in birds. Mol Biol Evol. 38:519–530.
- Rondelli S, Martinez O, García P. 2003. Sex effect on productive parameters, carcass and body fat composition of two commercial broilers lines. Braz J Poult Sci. 5:169–173.
- Ross S, Hill CS. 2008. How the Smads regulate transcription. Int J Biochem Cell Biol. 40:383–408.
- Salim HM, Lee HR, Jo C, Lee SK, Lee BD. 2012. Effect of sex and dietary organic zinc on growth performance, carcass traits, tissue mineral content, and blood parameters of broiler chickens. Biol Trace Elem Res. 147:120–129.
- Shah TA, Rogers MB. 2018. Unanswered questions regarding sex and BMP/TGF-β signaling. J Dev Biol. 6:1–9.
- Shimasaki S, Moore RK, Otsuka F, Erickson GF. 2004. The bone morphogenetic protein system in mammalian reproduction. Endocr Rev. 25:72–101.
- Slominski A, Tobin DJ, Shibahara S, Wortsman J. 2004. Melanin pigmentation in mammalian skin and Its hormonal regulation. Physiol Rev. 84:1155–1228.
- Storchová R, Divina P. 2006. Nonrandom representation of sex-biased genes on chicken Z chromosome. J Mol Evol. 63:676–681.
- Thompson CT, Ng L, Menon V, Martinez S, Lee C-K, Glattfelder K, Sunkin Susan M, Henry A, Lau C, Dang C, et al. 2014. A high-resolution spatiotemporal atlas of gene expression of the developing mouse brain. Neuron. 83(2):309–323.
- Tomaszkiewicz M, Medvedev P, Makova KD. 2017. Y and W chromosome assemblies: approaches and discoveries. Trends Genet. 33:266–282.
- Uebbing S, Konzer A, Xu L, Backström N, Brunström B, Bergquist J, Ellegren H. 2015. Quantitative mass spectrometry reveals partial translational regulation for dosage compensation in chicken. Mol Biol Evol. 32(10):2716–2725.
- Umair Z, Kumar S, Rafiq K, Kumar V, Reman ZU, Lee S-H, Kim S, Lee J-Y, Lee U, Kim J. 2020. Dusp1 modulates activin/smad2 mediated germ layer specification via FGF signal inhibition in Xenopus embryos. Animal Cells Syst (Seoul). 24(6):359–370.
- Wang J, Lan Y, He L, Tang R, Li Y, Huang Y, Liang S, Gao Z, Price M, Yue B, et al. 2021. Sex-specific gene expression in the blood of four primates. Genomics. 113:2605–2613.
- Wang Y, Jin G, Ma M, Xiang X. 2019. Sex differences in serum steroid hormone levels during embryonic development in hen eggs. Poult Sci. 98(11):6053–6062.
- Wang Z, Yu D, Wang M, Wang Q, Kouznetsova J, Yang R, Qian K, Wu W, Shuldiner A, Sztalryd C, et al. 2015. Elabela-Apelin receptor signaling pathway is functional in mammalian systems. Sci Rep. 5:8170.
- Xue Q, Zhang G, Li T, Ling J, Zhang X, Wang J. 2017. Transcriptomic profile of leg muscle during early growth in chicken. PLOS ONE. 12:1–21.
- Yu S, Wang G, Liao J, Tang M. 2019. Five alternative splicing variants of theTYRgene and their different roles in melanogenesis in the Muchuan black-boned chicken. Br Poult Sci. 60:8–14.
- Yu-Jiang Y, Xin Z, Hai-Nan L. 2020. JAK2-STAT5 signaling is insensitive to porcine growth hormone (pGH) in hepatocytes of neonatal pig. Animal Cells Syst (Seoul). 24(2):69–78.
- Zhang L, Wang H, Yu D, Chen J, Xing C, Li J, Li J, Cai Y. 2018. The effects of mouse ovarian granulosa cell function and related gene expression by suppressing BMP/Smad signaling pathway. Animal Cells Syst (Seoul). 22(5):317–323.
- Zito A, Cartelli D, Cappelletti G, Cariboni A, Andrews W, Parnavelas J, Poletti A, Galbiati M. 2014. Neuritin 1 promotes neuronal migration. Brain Struct Funct. 219(1):105–118.
- Zuo Q, Jin K, Zhang Y, Song J, Li B. 2017. Dynamic expression and regulatory mechanism of TGF-β signaling in chicken embryonic stem cells differentiating into spermatogonial stem cells. Biosience Rep. 37:1–15.