
ABSTRACT
Visual impairment is occasionally observed in multiple sclerosis (MS) and its animal model, experimental autoimmune encephalomyelitis (EAE). Although uveitis and optic neuritis have been reported in MS and EAE, the precise mechanisms underlying the pathogenesis of these visual impairments remain poorly understood. This study aims to identify differentially expressed genes (DEGs) in the retinas of mice with EAE to identify genes that may be implicated in EAE-induced visual impairment. Fourteen adult mice were injected with myelin oligodendrocyte glycoprotein35–55 to induce the EAE model. Transcriptomes of retinas with EAE were analyzed by RNA-sequencing. Gene expression analysis revealed 347 DEGs in the retinas of mice with EAE: 345 were upregulated, and 2 were downregulated (adjusted p-value < 0.05 and absolute log2 fold change > 1). Gene ontology (GO) analysis showed that the upregulated genes in the retinas of mice with EAE were primarily related to immune responses, responses to external biotic stimuli, defense responses, and leukocyte-mediated immunity in the GO biological process. The expression of six upregulated hub genes (c1qb, ctss, itgam, itgb2, syk, and tyrobp) from the STRING analysis and the two significantly downregulated DEGs (hapln1 and ndst4) were validated by reverse transcription-quantitative polymerase chain reaction. In addition, gene set enrichment analysis showed that the negatively enriched gene sets in EAE-affected retinas were associated with the neuronal system and phototransduction cascade. This study provides novel molecular evidence for visual impairments in EAE and indicates directions for further research to elucidate the mechanisms of these visual impairments in MS.
Introduction
Multiple sclerosis (MS) is a neurodegenerative disorder that commonly affects young adults and is characterized by the inflammatory demyelination in the central nervous system (CNS) (Reich et al. Citation2018). Patients with MS may also experience optic neuritis and uveitis during disease progression (Ransohoff et al. Citation2015), which can lead to visual impairments such as decreased visual acuity (Balcer and Frohman Citation2010), visual field defects (Nakajima et al. Citation2010), altered color vision (Villoslada et al. Citation2012), and blurred vision (Casselman et al. Citation2021). These symptoms are frequently associated with structural impairments in the visual system (Talman et al. Citation2010; Rosenkranz et al. Citation2021) and have been reported in approximately 60% of patients with MS (Salter et al. Citation2013) and impact their quality of life (Noble et al. Citation2006).
Experimental autoimmune encephalomyelitis (EAE) is a widely used animal model for studying MS that is characterized by T-cell-mediated inflammation and demyelination in the CNS (Shin et al. Citation1995). In EAE, lymph node-derived encephalitogenic T cells circulate in the blood vessels and infiltrate the CNS parenchyma, resulting in a disease that resembles certain aspects of MS pathology (Sorensen and Ransohoff Citation1998). During the progression of EAE, the composition of cerebrospinal fluid (CSF) is altered, and pro- and anti-inflammatory cytokines in the CSF are upregulated (Borjini et al. Citation2016). Thus, exogenous elements affect the brain and spinal cord and induce dysfunction of these organs (Baxter Citation2007).
In addition to dysfunction of the primary target organs, visual system dysfunction has also been observed in the course of EAE (Shin et al. Citation2021). In the chronic stage of EAE, affected mice experience axonal damage of the optic nerve (Horstmann et al. Citation2013), ganglion cell loss with acute optic neuritis (Shindler et al. Citation2006), and activation of astrocytes and microglia in the visual system (Larabee et al. Citation2016; Jin et al. Citation2019; Tassoni et al. Citation2019), as seen in patients with MS (Green et al. Citation2010). Nevertheless, the molecular mechanisms underlying visual impairment in CNS autoimmune diseases, such as MS and EAE, remain unknown. In this study, gene expression profiles were analyzed in the retinas of mice in the chronic phase of EAE to obtain insight into the underlying mechanisms of visual impairment in this animal model.
Materials and methods
Animals and EAE induction procedure
Nine-week-old male C57BL/6J mice aged (n = 14 mice/group) were obtained from Daihan Biolink Co. (Chungbuk, Republic of Korea) for use in this study. The mice were housed in a room with a temperature of 23 ± 2°C, a relative humidity of 50 ± 5%, and a 12-h light/dark cycle. They were provided with standard rodent food (Envigo Teklad, Madison, WI, USA) and water ad libitum. All animal care and procedures were conducted in accordance with the ethical guidelines of the Institutional Care and Use Committee of Chonnam National University (approval number: CNU IACUC-YB-2022-113) and followed internationally agreed standards for laboratory animal use and care, as mandated by the National Institutes of Health (NIH).
To induce EAE, mice (n = 14) were immunized subcutaneously on the hind flank with 1 mg/mL myelin oligodendrocyte glycoprotein peptide 35–55 (MOG35–55; Koma Biotech, Seoul, Republic of Korea) emulsified in complete Freund’s adjuvant (CFA; Sigma-Aldrich, St. Louis, MO, USA) and supplemented with 5 mg/mL Mycobacterium tuberculosis H37Ra (Difco Laboratories, Franklin Lakes, NJ, USA). On days 0 and 2 post-immunization (DPI), 500 ng of pertussis toxin (List Biological Laboratories, Campbell, CA, USA) was injected intraperitoneally into the mice. Control mice (n = 14) remained non-immunized.
Mice were monitored daily for changes in their weights and clinical signs of EAE, which were graded as follows: grade 0 (G.0), no signs; G.1, floppy tail; G.2, mild paraparesis; G.3, severe paraparesis; G.4, tetraparesis; and G.5, moribund or death (Kim et al. Citation2019). At 28 DPI, retinal tissues were collected from both control and EAE mice to analyze histopathological changes and gene expression profiles. All possible measures were taken to reduce the number of animals used in this study and to alleviate their suffering.
Tissue preparation
After 28 DPI, mice were sacrificed using CO2 gas inhalation and profound anesthesia. The globes were removed with care. For histopathological examination (n = 3 mice/group), the samples were fixed in Tokuda-Baron fixative, which is composed of 100 ml of glacial acetic acid, 150 ml of 99% ethyl alcohol, 100 ml of 40% neutral buffered formalin, and 650 of ml distilled water, and stored at 4°C overnight (Tokuda et al. Citation2018). They were then paraffin-embedded and sectioned at a thickness of 5 μm using a microtome (Leica Biosystems, Nussloch, Germany). The sections were stained with hematoxylin–eosin, and immunohistochemistry was performed. For RNA-sequencing (RNA-seq; n = 4 mice/group) and reverse transcription-quantitative polymerase chain reaction (RT-qPCR; n = 7 mice/group) analyses, the retinal tissues from both control and EAE-affected mice were stored at −80°C immediately after sampling.
Immunohistochemistry
Immunohistochemistry was performed using the same protocol used in a previous study (Kim et al. Citation2019). The primary antibody (#019-19741; Wako Pure Chemical Industries, Ltd., Osaka, Japan) was diluted 1:1,000 against ionized calcium-binding adapter molecule 1 (Iba1), as a marker for microglia and macrophages.
RNA isolation and RNA-seq
The total RNA was extracted using an RNeasy® Mini Kit (#74106, Qiagen, Hilden, Germany) according to the manufacturer’s instructions. The RNA concentration was determined using Quant-IT RiboGreen (#R11490, Invitrogen, Carlsbad, CA, USA). TapeStation RNA ScreenTape (#5067-5576, Agilent, Santa Clara, CA, USA) was utilized to assess the integrity of the total RNA, and only high-quality RNA preparations with an RNA integrity number greater than 7.0 were used for RNA library construction.
Following the protocol outlined in a prior study (Ahn et al. Citation2022), each sample underwent independently library preparation using 1 µg of total RNA and the Illumina TruSeq Stranded mRNA Sample Prep Kit (#RS-122-2101, Illumina, Inc., San Diego, CA, USA). In the first step, poly-A-containing mRNA molecules were purified using poly-T-attached magnetic beads. The mRNA was then fragmented into small pieces using divalent cations at an elevated temperature. The cleaved RNA fragments were copied into first-strand cDNA using SuperScript II reverse transcriptase (#18064014, Invitrogen) and random primers. Second-strand cDNA synthesis was performed using DNA polymerase I, RNase H, and dUTP. The cDNA fragments underwent an end-repair process, followed by the addition of a single ‘A’ base and subsequent ligation of the adapters. The final cDNA library was then generated by purifying and enriching the products with PCR.
The libraries were quantified utilizing KAPA Library Quantification kits for Illumina sequencing platforms in accordance with the qPCR Quantification Protocol Guide (#KK4854, Kapa Biosystems, Wilmington, MA, USA) and qualified using TapeStation D1000 ScreenTape (#5067-5582, Agilent). Paired-end sequencing reads were generated on the Illumina sequencing NovaSeq platform. Before initiating the analysis, Trimmomatic v0.38 (ILLUMINACLIP: 2:30:10:5 LEADING:5 TRAILING:5 SLIDINGWINDOW:4:15 MINLEN:36) was used to remove adapter sequences and trim bases with poor base quality. The cleaned reads (average 98% reads at mean length 100 bp) were aligned to the Mus musculus (mm10) using HISAT v2.1.0 (Kim et al. Citation2015) based on the HISAT and Bowtie2 (Langmead and Salzberg Citation2012) implementations. For this alignment, we obtained the reference genome sequence from the NCBI Genome assembly and gene annotation data from the NCBI RefSeq database. Post-alignment, the generated data in SAM file format were sorted and indexed using SAMtools v1.9 (Danecek et al. Citation2021). Following alignment, transcripts were assembled and quantified using StringTie v2.1.3b (Pertea et al. Citation2015; Pertea et al. Citation2016).
Differentially expressed genes (DEGs), enrichment analysis, and protein–protein interaction (PPI) analysis
Differential expression was analyzed using R version 4.2.2 (R Core Team Citation2013) and the R package DESeq2 (Love et al. Citation2014) for RNA-sequencing. Differentially expressed genes were determined using the DESeq2 (Love et al. Citation2014) Wald test, and p-values were adjusted using the Benjamini–Hochberg procedure for controlling the false discovery rate (FDR) (Benjamini and Hochberg Citation1995). The genes with an absolute log2 fold change greater than 1 and an adjusted p-value less than 0.05 were considered to be differentially expressed. To examine the gene ontology (GO) enrichment of the DEGs, we used ShinyGO 0.77 (Ge et al. Citation2020) (accessed on February 26, 2023) and analyzed three GO datasets including biological processes (BPs), cellular components (CCs), and molecular functions (MFs) to analyze upregulated genes (Hong et al. Citation2014).
To construct PPI networks for DEGs and to identify essential nodes in the network with high confidence (more than 0.7), we used the Search Tool for the Retrieval of Interacting Genes/proteins (STRING) database (Szklarczyk et al. Citation2021). We then applied the CytoHubba plug-in (Chin et al. Citation2014) in Cytoscape software (Shannon et al. Citation2003) to identify the hub genes from the PPI network based on five ranking algorithms including betweenness, closeness, degree, maximal clique centrality, and maximum neighborhood component. We selected the top 50 nodes with the highest scores of the five ranking algorithms and took the intersection of the outcomes of the five algorithms. Overlapping hub genes were used to select the central hub genes.
We additionally utilized gene set enrichment analysis (GSEA) version 4.2.3 (Subramanian et al. Citation2005) to analyze the gene sets enriched in the RNA-Seq data. The GSEA user guide was followed to configure the analysis parameters for the preceding comparisons. In this study, GSEA was employed to identify dysregulated signaling pathways of all DEGs in the control versus EAE-affected groups using curated gene sets from the Molecular Signatures Database (MSigDB). An enriched dataset expression matrix was generated using the curated gene sets at the cutoff levels of a false discovery rate (FDR) q-value < 0.05 and nominal (NOM) p-value < 0.05.
RNA extraction, cDNA synthesis, and RT-qPCR
The protocols for RNA extraction, complementary DNA (cDNA) synthesis, and RT-qPCR were taken from a previous study (Weerasinghe-Mudiyanselage et al. Citation2022). Briefly, total RNA was extracted from the retinas of control and EAE mice with QIAzol Lysis Reagent (#79306; Qiagen) based on the manufacturer’s instructions. cDNA synthesis was performed using the SuperiorScript III cDNA synthesis kit (#EZ405S, Enzynomics, Daejeon, South Korea). The resultant cDNA was diluted to a final concentration of 8 ng/µL with RNase-free water and stored at −80°C. RT-qPCR was conducted using the mic instrument (Bio Molecular Systems, Potts Point, Australia) and 2× Quantity SYBR Green (PhileKorea Co., Ltd., Seoul, Korea). The sequences of RT-qPCR primers are listed in . The annealing temperature for the reaction was 58°C. Amplification curves were generated, and threshold cycle (Ct) values were calculated using the built-in software. The expression levels of the target genes were normalized to the Gapdh reference gene using the 2−ΔΔCT method, and the data are reported as mean relative values compared with the control group.
Table 1. List of primer sequences for RT-qPCR.
Statistical analysis
The RT-qPCR results were evaluated using independent two-tailed Student’s t-tests in GraphPad (version 9.5.1, GraphPad Software Inc., San Diego, CA, USA) to ascertain any differences between the control and EAE-affected groups. All data are presented as the mean (M) ± standard error of the mean (SEM). In all analyses, a p-value less than 0.05 was considered statistically significant.
Results
Histopathological findings
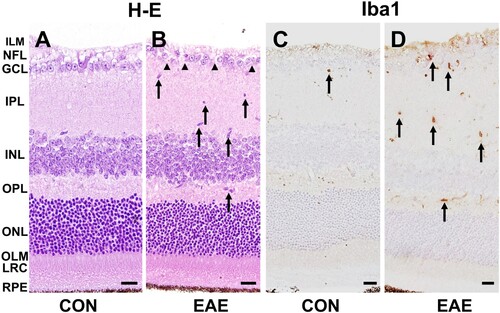
Hematoxylin–eosin staining of the control retinas showed well-preserved retinal layers ((A)). However, in the EAE-affected group, there was infiltration and/or activation of inflammatory cells and loss of retinal ganglion cells (RGCs) ((B)). Immunohistochemical staining revealed that a few Iba1-positive cells were present in the control retinas ((C)). In contrast, more Iba1-positive cells were present in the EAE retinas ((D)). These findings indicate that EAE progression is associated with retinal inflammation.
Figure 1. Histopathological examination of the retinas in the control and EAE-affected mice (EAE). (A and B) Hematoxylin-eosin staining revealed infiltration and/or activation of inflammatory cells (B, arrows) and loss of RGCs (B, arrowheads) in the EAE-affected retinas. (C and D) Immunohistochemistry for ionized calcium-binding adapter molecule (Iba1) was performed to detect retinal microglia. A few Iba1-positive resident microglia were observed in the control retinas (C, arrow). However, an increased number of Iba1-positive cells were detected in the EAE-affected retinas (D, arrows). The scale bars in the images represent 20 μm. The retinal layers are labeled as follows: inner limiting membrane (ILM), nerve fiber layer (NFL), ganglion cell layer (GCL), inner plexiform layer (IPL), inner nuclear layer (INL), outer plexiform layer (OPL), outer nuclear layer (ONL), outer limiting membrane (OLM), layer of rods and cones (LRC), retinal pigment epithelium (RPE).
Illumina sequencing
To construct each of the eight sample libraries, a total of 529.8 million paired-end (PE) reads with a length of 101 bp were generated. This cumulative raw data equated to 53.5 Gb. Upon the implementation of the read trimming process, which entailed discarding the low-quality segments at the 3’ end of each read as well as filtering out singleton reads and reads shorter than 36 bp, the resulting dataset encompassed 520.6 million paired-end reads, each with a length of 100 bp, totaling 52.2 Gb. The GC (guanine–cytosine) content for the refined dataset exhibited a range of 48–49% across the retina samples from both control and EAE-affected mice ().
Table 2. Summary statistics of RNA-seq data alignment.
DEGs in the retinas of EAE-affected mice
Total RNA-seq was performed during the chronic phase (28 DPI) of EAE to evaluate the gene expression profiles in the retinas of the affected mice. When compared with the expression levels in the control group, 347 genes were differentially expressed in the retinas of EAE-affected mice, with a cutoff value of absolute log2 fold change > 1 (adjusted p-value < 0.05); 345 were upregulated, whereas only 2 (hapln1 and ndst4) were downregulated (Supplementary Figure S1).
Functional analysis of DEGs
The DEG analysis revealed significant differences in gene expression between the retinas of control and EAE-affected mice. To determine the biological relevance of these DEGs, functional annotation analysis was performed using ShinyGO (Ge et al. Citation2020). The GO analysis results indicated that the upregulated genes were associated with BPs including immune responses, responses to biotic stimuli, responses to external biotic stimuli, defense responses, responses to other organisms, defense responses to other organisms, and innate immune responses (). (B) shows the network of enriched gene sets in GOBP terms, where nodes are connected if they share more than 20% genes. The intensity of the color of the nodes reflects the significance of the enriched gene sets, with larger nodes representing bigger gene sets and thicker edges indicating overlapping genes. On the other hand, CCs, such as I bands, Z discs, sarcomeres, myofibrils, contractile fibers, and collagen-containing extracellular matrix (Supplementary Figure S2), and MFs, such as peptide antigen binding, beta-2-microglobulin binding, structural constituents of muscle, antigen binding, extracellular matrix structural constituents, and extracellular matrix binding (Supplementary Figure S3), were enriched in the EAE-affected retinas. and Supplementary Table S1 provide detailed information regarding the GO analysis for upregulated genes in the retinas of EAE-affected mice.
Figure 2. GO term enrichment analysis of BPs for upregulated genes in the control and EAE-affected retinas during the chronic phase. (A) The dot plot shows the top ten enriched genes of the GOBP term with a log2 fold change > 1 and an adjusted p-value < 0.05 in the EAE-affected retinas. (B) The relationship between enriched pathways is represented through an interactive plot, where nodes are connected if they share more than 20% of genes. The intensity of the node color indicates the level of significance of the enriched gene sets.
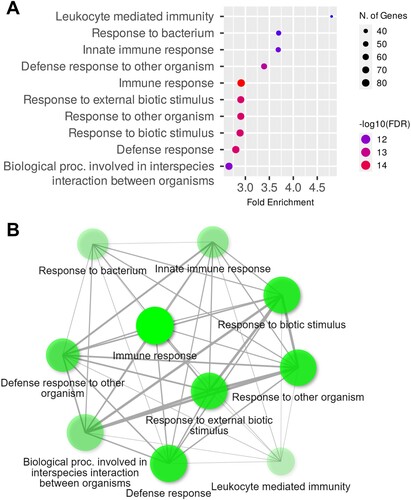
Table 3. GO term enrichment analysis of upregulated genes in the retinas of EAE-affected mice under GOBP, GOCC, and GOMF.
RT-qPCR validation of DEGs in EAE-affected retinas
To determine if the gene expression detected by RT-qPCR was similar to that detected through the RNA-seq analyses, hub genes and downregulated genes were analyzed based on gene expression and biological significance. Twelve hub genes were identified in the EAE-affected retinas by analyzing the PPI networks of DEGs using the STRING database ( and Supplementary Figure S4). To validate the identified gene expression, six hub genes and two significantly downregulated genes among the DEGs were selected for RT-qPCR validation (). The validated genes were complement component 1q beta chain (c1qb), cathepsin S (ctss), integrin subunit alpha M (itgam), integrin subunit beta 2 (itgb2), spleen tyrosine kinase (syk), TYRO protein tyrosine kinase-binding protein (tyrobp), hyaluronan and proteoglycan link protein 1 (hapln1), and N-deacetylase and N-sulfotransferase 4 (ndst4).
Figure 3. PPI network for the DEGs in the EAE-affected retinas. The PPI network was generated using the STRING database, with a confidence value of 0.7. The nodes in the network represent the genes, with larger nodes indicating hub genes. The hub genes c1qa, c1qb, ctss, itgam, itgb2, lyn, ptprc, spi1, syk, tlr2, ttn, and tyrobp are shown in brown-colored nodes that are larger than others. The abbreviations for the genes are as follows: c1qa (complement component 1q alpha chain), c1qb (complement component 1q beta chain), ctss (cathepsin s), itgam (integrin subunit alpha M), itgb2 (integrin subunit beta 2), lyn (lyn proto-oncogene src family tyrosine kinase), ptprc (protein tyrosine phosphatase receptor type c), spi1 (spleen focus forming virus proviral integration oncogene), syk (spleen tyrosine kinase), tlr2 (toll-like receptor 2), ttn (titin), and tyrobp (TYRO protein tyrosine kinase-binding protein).
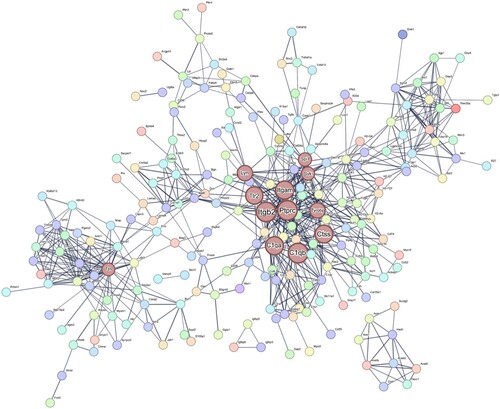
Figure 4. Expression changes in eight selected DEGs in the retinas of mice with EAE. The bar graphs depict the relative expression levels of six upregulated (A) and two downregulated (B) genes based on RNA-seq data. The data are presented as the mean ± SEM (n = 7/group). Statistical significance is denoted by * p < 0.05, ** p < 0.01, and *** p < 0.001 compared with the control group.
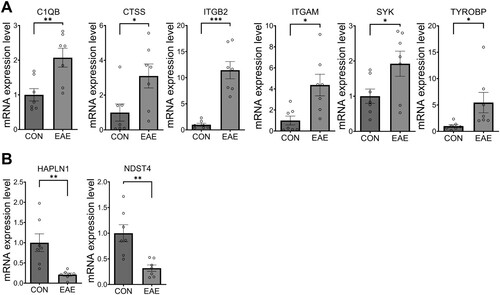
The validation of gene expression revealed that in the EAE-affected retinas, the expression levels of c1qb (M = 2.07, SEM = 0.32, t(12) = 3.298, p = 0.006), ctss (M = 3.10, SEM = 0.84, t(12) = 2.479, p = 0.029), itgam (M = 4.37, SEM = 1.10, t(12) = 3.040, p = 0.01), itgb2 (M = 11.45, SEM = 1.66, t(12) = 6.271, p < 0.001), syk (M = 1.92, SEM = 0.41, t(12) = 2.251, p = 0.044), and tyrobp (M = 5.45, SEM = 1.95, t(12) = 2.279, p = 0.041) were significantly increased ((A)), while hapln1 (M = 0.21, SEM = 0.22, t(12) = 3.550, p = 0.004) and ndst4 (M = 0.31, SEM = 0.17, t(12) = 3.835, p = 0.002) were significantly decreased ((B)). These findings indicate that the RT-qPCR validation was consistent with the RNA-seq analysis and that the selected genes are likely implicated in the pathogenesis of EAE.
Additional assessment of functional differences using GSEA
GSEA was performed with the MSigDB curated gene sets (FDR q-value < 0.05, NOM p-value < 0.05) and showed that the top 10 positively enriched gene sets in EAE-affected retinas were related to several processes including the electron transport chain, respiratory electron transport ATP synthesis by chemiosmotic coupling and heat production by uncoupling proteins, citric acid TCA cycles and respiratory electron transport, respiratory electron transport, graft versus host disease D7 up, glis2 target up, nonsense-mediated decay independent of the exon junction complex, cytoplasmic ribosomal proteins, SRP-dependent cotranslational protein targeting to the membrane, and oxidative phosphorylation ( and Supplementary Figure S5).
Figure 5. Curated gene sets enriched in the retinas of mice with EAE. The bar graphs depict the top 10 GSEA curated gene sets (FDR q-value < 0.05, NOM p-value < 0.05) that were positively enriched (shown in red bars) and negatively enriched (shown in green bars) in the EAE-affected retinas. The height of each bar in panels A and B indicates the strength of the normalized enrichment score (NES) and the size of the gene set, respectively.
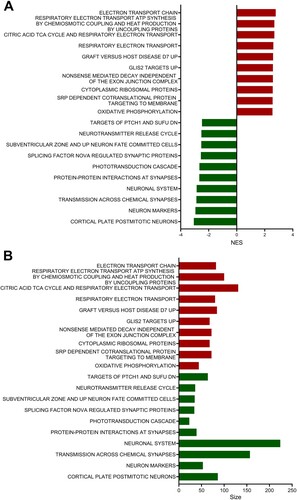
On the other hand, the top 10 negatively enriched gene sets included processes related to cortical plate postmitotic neurons, neuron markers, transmission across chemical synapses, the neuronal system, protein–protein interactions at synapses, the phototransduction cascade, splicing factor NOVA-regulated synaptic proteins, subventricular zone and up neuron fate-committed cells, the neurotransmitter release cycle, and targets of ptch1 and sufu DN ( and Supplementary Figure S6). and Supplementary Table S2 provide detailed reports on the GSEA with curated gene sets from the retinas of EAE-affected mice.
Table 4. GSEA results according to the MSigDB curated gene sets.
Discussion
This study aimed to identify potential molecular pathways associated with visual impairment in EAE, an animal model of MS, by analyzing changes in gene expression in the retinas of mice. Using RNA-seq, the retinal transcriptomes of control and EAE-affected mice were compared and revealed a significant upregulation of immune response- and inflammation-related genes among DEGs. Intriguingly, the downregulated DEGs were predominantly represented by only two genes, both of which are related to retinal structure and photoreceptor function.
An interesting observation during this study was the apparent asymmetry in the quantities of upregulated and downregulated genes. This phenomenon could potentially be attributed to either the selection of the statistical significance threshold or the inherent biological characteristics of the EAE model itself. Notably, the decision to set a relatively stringent fold-change threshold (with an absolute log2 fold change > 1) to identify significantly involved DEGs in the retinas of EAE mice might underlie the fewer observed downregulated genes than upregulated genes within the DEG dataset. In addition, a previous study showed that there was an imbalance in the expression of immune- and neural-related genes associated with the progression of the disease in non-obese diabetic mice with EAE (Baranzini et al. Citation2005). This existing knowledge could serve to elucidate the seemingly asymmetric expression of upregulated and downregulated genes observed within the current DEG dataset.
Based on the results of our study, the c1qb, itgam, and itgb2 hub genes were upregulated, which might be associated with the common characteristics of EAE and MS pathogenesis, particularly T-cell mediated inflammation and demyelination. It has been suggested that the complement system is involved in the pathology of MS and EAE (Hammond et al. Citation2020; Park and Jung Citation2022). Various investigations have highlighted increased C1q expression in cerebral white matter lesions and spinal cord regions (Ingram et al. Citation2014) as well as in the hippocampi of subjects affected by MS and EAE (Michailidou et al. Citation2015; Hammond et al. Citation2020). It was additionally reported that macrophage-1 antigen, which is composed of the complement receptor subunits ITGAM (CD11b) and ITGB2 (CD18), is implicated not only in myelin phagocytosis mediated by microglia and macrophages but also in T-cell-driven demyelination in EAE (Bullard et al. Citation2005). In accordance with these findings, our results consistently align with the characteristic pathology of both EAE and MS, particularly in the context of complement system involvement.
Prior investigations have delved into the analysis of DEGs in various tissues such as retinal inflammatory cells (Cruz-Herranz et al. Citation2021), hippocampi (Weerasinghe-Mudiyanselage et al. Citation2022), and olfactory bulbs (Kim et al. Citation2019) in EAE animal models as well as peripheral blood mononuclear cells of patients with MS (Tuller et al. Citation2011). Nonetheless, the present study is the first to focus exclusively on DEGs within EAE-affected retinas. Notably, within this study, the upregulation of tyrobp expression in the retinas of EAE-affected mice parallels its upregulation in the hippocampi, suggesting its involvement across select nervous tissues. In a distinctive context, the downregulation of the expression of ndst4 and hapln1 appears to be exclusive to the retinas of EAE mice, highlighting potential unique roles for these genes in the retinal response.
Microglial infiltration/activation and loss of RGCs were also observed in the histopathological analysis, which is consistent with previous findings in EAE (Manogaran et al. Citation2019). Previous studies have also shown the involvement of innate immunity and molecular changes in innate immune cells in the retinas during EAE progression (Cruz-Herranz et al. Citation2021). However, the molecular mechanisms responsible for retinal tissue damage in EAE-affected mice remain poorly understood. Therefore, we attempted to identify the molecular alterations in EAE-affected retinas that are responsible for EAE-related visual impairments.
This study utilized GO, GSEA, and STRING analyses to investigate the functional changes in the retinas of mice with EAE. Previous studies have suggested that retinal innate immune responses are significantly involved in EAE pathogenesis and tissue damage (Cruz-Herranz et al. Citation2021), which is consistent with our findings. GO analysis of DEGs in EAE-affected retinas revealed significant enrichment in immune system processes, including immune responses, leukocyte-mediated immunity, and innate immune responses. GSEA showed that the most positively enriched gene sets were related to respiratory electron transport and oxidative phosphorylation, which are associated with mitochondrial pathology in EAE-affected retinas. Previous studies have linked axonal degeneration to mitochondrial changes and ROS production caused by oxidative stress in the chronic phases of MS and EAE (van Horssen et al. Citation2011), and macrophage-derived ROS can cause mitochondrial pathology in EAE-affected spinal cords, leading to focal axonal degeneration (Nikic et al. Citation2011). A significant increase in mitochondrial respiratory chain complex activity has been reported in MS remyelinated axons (Zambonin et al. Citation2011). Conversely, the neuronal system, PPIs at synapses, and the phototransduction cascade were negatively enriched in the GSEA. The PPIs in the synapse pathway, which contains synaptic adhesion-like molecule (SALM)-related genes, such as synaptic adhesion-like molecule 1-3 genes (salm1-3) and post-synaptic density 95 (psd95) genes, were negatively enriched in the GSEA. The SALM family is a leucine-rich repeat-containing synaptic adhesion molecule subfamily that promotes neurite outgrowths and has synaptogenic properties (Nam et al. Citation2011). The SALM family is involved in interactions with PSD95 (Morimura et al. Citation2006), whose expression was decreased in the inner retinas of EAE mice compared with control mice (Jin et al. Citation2019). The GSEA also revealed negative enrichment of genes involved in the phototransduction cascade pathway, such as ATP-binding cassette subfamily A member 4 (abca4) and phosphodiesterase 6B (pde6b) genes. ABCA4 protein, which is expressed in the photoreceptor outer segment disc membrane, is associated with retinal dystrophy (Kim et al. Citation2022), and phosphodiesterase 6 (PDE6) enzymes, which are located in both rod and cone photoreceptor cells, are crucial for the phototransduction cascade. Dysfunction of PDE6 activity causes retinal dystrophies in retinal degeneration 1, a mouse animal model of retinitis pigmentosa (Sahaboglu et al. Citation2013). These negatively enriched pathways in the retinas of EAE-affected mice may contribute to dysfunction of the neuronal system and phototransduction in the retinas.
In this study, the retinas of EAE-affected mice have been found to contain several novel genes including ndst4 and halpln1 that may contribute to visual dysfunction. Among the immune response- and inflammation-related genes identified in the retina, certain genes have been identified as hub genes that play significant roles in retinal inflammation.
One such gene is c1q, which is involved in the classical complement pathway and plays a role in target recognition (Schartz and Tenner Citation2020). In particular, C1q is a critical component of the complement cascade that is involved in synaptic remodeling (Zabel and Kirsch Citation2013). C1q is also involved in neuroprotection (Benoit et al. Citation2012) and axon regeneration (Peterson et al. Citation2015). In EAE-affected optic nerves, gene expression of c1q was found to be increased in activated microglia (Jin et al. Citation2019). In other conditions, such as retinal ischemia/reperfusion injury (Kuehn et al. Citation2008) and diabetes (Church et al. Citation2022), c1qb expression has also been reported to be upregulated in the retina. While C1q promotes and degrades damaged RGCs and removes cell debris from apoptotic RGCs (Kuehn et al. Citation2008), it has been reported that complement-mediated synapse elimination is abnormally reactivated in neurodegenerative diseases of the CNS and retina (Stevens et al. Citation2007). The increased expression of c1qb observed in this study might be related to downregulation of the synaptic-related pathways in the GSEA. Further investigation is needed to better elucidate the mechanisms underlying the abnormal reactivation of synaptic elimination in relation to c1qb.
Cathepsin S (ctss) plays an essential role in antigen presentation, being involved in both the processing of antigens and the processing of the Invariant chain (li; CD74), which can act as an MHC class II chaperone (Anderson and Miller Citation1992; Riese et al. Citation1996). Cathepsin S has been largely linked to inflammatory responses, oxidative phosphorylation, coagulation, and epithelial–mesenchymal transition, as shown in diabetic retinopathy (Someya et al. Citation2022). In models of autoimmunity, inhibition of cathepsin S causes both suppression of inflammation and disease chronicity index (Tato et al. Citation2017). While cathepsin S inhibitors have been investigated as treatments for autoimmune diseases (Baugh et al. Citation2011), it remains unclear whether they can reduce the severity of visual impairment associated with MS and EAE. The increased expression of cathepsin S observed in this study is likely related to inflammation, oxidative phosphorylation, and endothelial-mesenchymal transition. Identifying the mechanisms underlying visual impairments is necessary to determine whether cathepsin S affects them.
Integrins, such as itgam and itgb2, have been identified as inflammatory factors through cell migration and adhesion (Hynes Citation2002). Upregulation of these genes has been reported in diabetic retinopathy in Zucker diabetic fatty rats, as seen in the CNS inflammation, including spinal cord injury (Lund et al. Citation2022) and hemorrhage (Weng et al. Citation2022). Therefore, upregulation of itgam and itgb2 might promote leukocyte recruitment in the retina, which might be a therapeutic target.
Tyrobp, a hub gene in the hippocampus in EAE (Weerasinghe-Mudiyanselage et al. Citation2022), has also been found to be upregulated in EAE-affected retinas. Triggering receptor expressed on myeloid cells 2/DNAX activating protein of 12 kDa (TREM2/DAP12) signaling promotes the proliferation, migration, and phagocytosis of apoptotic neurons in microglia (Konishi and Kiyama Citation2018). In addition, upregulation of TREM2/DAP12 via SYK increases proangiogenic cytokines in Müller cells, which contributes to diabetic retinopathy progression (Yerlikaya et al. Citation2022). Both upregulation of tyrobp and syk might be involved in the glial activation and be associated with chronic retinopathy in EAE.
On the other hand, only two downregulated genes were identified in the present study, namely, ndst4 and hapln1; ndst4 encodes for heparan sulfate N-deacetylase/N-sulphotransferase (NDST) enzymes, which are responsible for the sulphation and modification of heparan sulfate (Aikawa et al. Citation2001). Heparan sulfate plays a crucial role in regulating several interleukins and chemokines, which are known mediators of inflammation (Farrugia et al. Citation2018). It is also essential for the projection of axons from RGCs to the optic nerve head (Coulson-Thomas Citation2016). In addition, the downregulation of ndst4, which has been reported in cases of retinal ischemia (Neo et al. Citation2020) and in vitro model of ALS (Lo et al. Citation2021), may contribute to the inflammatory process and dysregulation of RGC axon guidance.
Furthermore, hapln1 encodes for hyaluronan and proteoglycan link protein 1 (HAPLN1), which is abundant in the interphotoreceptor matrix of the human retina (Ishikawa et al. Citation2015). Studies have suggested that the interphotoreceptor matrix may play a role in retinal degeneration. Downregulation of hapln1 has been previously reported to be involved in dysfunction of RGCs (Rocha et al. Citation2020) and Müller cells (Wang et al. Citation2013) in the retina. However, the effect of hapln1 downregulation in the retinas of mice with EAE remains unclear. The disruption of the interphotoreceptor matrix, which contains proteoglycans such as hapln1 (Ishikawa et al. Citation2015), may be responsible for the downregulation of hapln1 and may contribute to visual impairments resulting from retinal degeneration.
In conclusion, this study utilized RNA-seq data analysis to identify transcriptomic profiling and hub genes in the retinas of mice with EAE. The upregulation of c1qb, ctss, tyrobp, syk, itgam, and itgb2, which are involved in immune responses, and downregulation of ndst4 and hapln1, which are involved in dysfunction of RGCs, may contribute to visual impairments in EAE-affected mice. These genes could serve as potential targets for future therapeutic studies on visual impairment in EAE. The findings of this study provide novel insights into the molecular mechanisms underlying visual disturbances in EAE and highlight potential therapeutic targets for future investigation.
CRediT authorship contribution statement
SH, CM, and TS participated in research design. SH, PDEWM and SK performed the study. SH, CM, and TS contributed in analysis and writing first draft of manuscript. All authors read and approved the final manuscript.
Data availability
Data will be made available on request.
Disclosure statement
No potential conflict of interest was reported by the author(s).
Additional information
Funding
References
- Ahn JS, Won JH, Kim DY, Jung SE, Kim BJ, Kim JM, Ryu BY. 2022. Transcriptome alterations in spermatogonial stem cells exposed to bisphenol A. Anim Cells Syst (Seoul). 26(2):70–83. doi:10.1080/19768354.2022.2061592.
- Aikawa J, Grobe K, Tsujimoto M, Esko JD. 2001. Multiple isozymes of heparan sulfate/heparin GlcNAc N-deacetylase/GlcN N-sulfotransferase. Structure and activity of the fourth member, NDST4. J Biol Chem. 276(8):5876–5882. doi:10.1074/jbc.M009606200.
- Anderson MS, Miller J. 1992. Invariant chain can function as a chaperone protein for class II major histocompatibility complex molecules. Proc Natl Acad Sci U S A. 89(6):2282–2286. doi:10.1073/pnas.89.6.2282.
- Balcer LJ, Frohman EM. 2010. Evaluating loss of visual function in multiple sclerosis as measured by low-contrast letter acuity. Neurology. 74 Suppl 3(Suppl 3):S16–S23. doi:10.1212/WNL.0b013e3181dbb664.
- Baranzini SE, Bernard CC, Oksenberg JR. 2005. Modular transcriptional activity characterizes the initiation and progression of autoimmune encephalomyelitis. J Immunol. 174(11):7412–7422. doi:10.4049/jimmunol.174.11.7412.
- Baugh M, Black D, Westwood P, Kinghorn E, McGregor K, Bruin J, Hamilton W, Dempster M, Claxton C, Cai J, et al. 2011. Therapeutic dosing of an orally active, selective cathepsin S inhibitor suppresses disease in models of autoimmunity. J Autoimmun. 36(3–4):201–209. doi:10.1016/j.jaut.2011.01.003.
- Baxter AG. 2007. The origin and application of experimental autoimmune encephalomyelitis. Nat Rev Immunol. 7(11):904–912. doi:10.1038/nri2190.
- Benjamini Y, Hochberg Y. 1995. Controlling the false discovery rate - a practical and powerful approach to multiple testing. J R Stat Soc B. 57(1):289–300.
- Benoit ME, Clarke EV, Morgado P, Fraser DA, Tenner AJ. 2012. Complement protein C1q directs macrophage polarization and limits inflammasome activity during the uptake of apoptotic cells. J Immunol. 188(11):5682–5693. doi:10.4049/jimmunol.1103760.
- Borjini N, Fernandez M, Giardino L, Calza L. 2016. Cytokine and chemokine alterations in tissue, CSF, and plasma in early presymptomatic phase of experimental allergic encephalomyelitis (EAE), in a rat model of multiple sclerosis. J Neuroinflammation. 13(1):291. doi:10.1186/s12974-016-0757-6.
- Bullard DC, Hu X, Schoeb TR, Axtell RC, Raman C, Barnum SR. 2005. Critical requirement of CD11b (Mac-1) on T cells and accessory cells for development of experimental autoimmune encephalomyelitis. J Immunol. 175(10):6327–6333. doi:10.4049/jimmunol.175.10.6327.
- Casselman P, Cassiman C, Casteels I, Schauwvlieghe PP. 2021. Insights into multiple sclerosis-associated uveitis: a scoping review. Acta Ophthalmol. 99(6):592–603. doi:10.1111/aos.14697.
- Chin CH, Chen SH, Wu HH, Ho CW, Ko MT, Lin CY. 2014. Cytohubba: identifying hub objects and sub-networks from complex interactome. BMC Syst Biol. 8 Suppl 4(Suppl 4):S11. doi:10.1186/1752-0509-8-S4-S11.
- Church KA, Rodriguez D, Vanegas D, Gutierrez IL, Cardona SM, Madrigal JLM, Kaur T, Cardona AE. 2022. Models of microglia depletion and replenishment elicit protective effects to alleviate vascular and neuronal damage in the diabetic murine retina. J Neuroinflammation. 19(1):300. doi:10.1186/s12974-022-02659-9.
- Coulson-Thomas VJ. 2016. The role of heparan sulphate in development: the ectodermal story. Int J Exp Pathol. 97(3):213–229. doi:10.1111/iep.12180.
- Cruz-Herranz A, Oertel FC, Kim K, Canto E, Timmons G, Sin JH, Devereux M, Baker N, Michel B, Schubert RD, et al. 2021. Distinctive waves of innate immune response in the retina in experimental autoimmune encephalomyelitis. JCI Insight. 6(11):e149228. doi:10.1172/jci.insight.149228.
- Danecek P, Bonfield JK, Liddle J, Marshall J, Ohan V, Pollard MO, Whitwham A, Keane T, McCarthy SA, Davies RM, et al. 2021. Twelve years of SAMtools and BCFtools. Gigascience. 10(2):giab008. doi:10.1093/gigascience/giab008.
- Farrugia BL, Lord MS, Melrose J, Whitelock JM. 2018. The role of heparan sulfate in inflammation, and the development of biomimetics as anti-inflammatory strategies. J Histochem Cytochem. 66(4):321–336. doi:10.1369/0022155417740881.
- Ge SX, Jung D, Yao R. 2020. ShinyGO: a graphical gene-set enrichment tool for animals and plants. Bioinformatics. 36(8):2628–2629. doi:10.1093/bioinformatics/btz931.
- Green AJ, McQuaid S, Hauser SL, Allen IV, Lyness R. 2010. Ocular pathology in multiple sclerosis: retinal atrophy and inflammation irrespective of disease duration. Brain. 133(Pt 6):1591–1601. doi:10.1093/brain/awq080.
- Hammond JW, Bellizzi MJ, Ware C, Qiu WQ, Saminathan P, Li H, Luo S, Ma SA, Li Y, Gelbard HA. 2020. Complement-dependent synapse loss and microgliosis in a mouse model of multiple sclerosis. Brain Behav Immun. 87:739–750. doi:10.1016/j.bbi.2020.03.004.
- Hong G, Zhang W, Li H, Shen X, Guo Z. 2014. Separate enrichment analysis of pathways for up- and downregulated genes. J R Soc Interface. 11(92):20130950. doi:10.1098/rsif.2013.0950.
- Horstmann L, Schmid H, Heinen AP, Kurschus FC, Dick HB, Joachim SC. 2013. Inflammatory demyelination induces glia alterations and ganglion cell loss in the retina of an experimental autoimmune encephalomyelitis model. J Neuroinflammation. 10:120. doi:10.1186/1742-2094-10-120.
- Hynes RO. 2002. Integrins: bidirectional, allosteric signaling machines. Cell. 110(6):673–687. doi:10.1016/S0092-8674(02)00971-6.
- Ingram G, Loveless S, Howell OW, Hakobyan S, Dancey B, Harris CL, Robertson NP, Neal JW, Morgan BP. 2014. Complement activation in multiple sclerosis plaques: an immunohistochemical analysis. Acta Neuropathol Commun. 2:53. doi:10.1186/2051-5960-2-53.
- Ishikawa M, Sawada Y, Yoshitomi T. 2015. Structure and function of the interphotoreceptor matrix surrounding retinal photoreceptor cells. Exp Eye Res. 133:3–18. doi:10.1016/j.exer.2015.02.017.
- Jin J, Smith MD, Kersbergen CJ, Kam TI, Viswanathan M, Martin K, Dawson TM, Dawson VL, Zack DJ, Whartenby K, et al. 2019. Glial pathology and retinal neurotoxicity in the anterior visual pathway in experimental autoimmune encephalomyelitis. Acta Neuropathol Commun. 7(1):125. doi:10.1186/s40478-019-0767-6.
- Kim BM, Song HS, Kim JY, Kwon EY, Ha SY, Kim M, Choi JH. 2022. Functional characterization of ABCA4 genetic variants related to Stargardt disease. Sci Rep. 12(1):22282. doi:10.1038/s41598-022-26912-6.
- Kim D, Langmead B, Salzberg SL. 2015. HISAT: a fast spliced aligner with low memory requirements. Nat Methods. 12(4):357–360. doi:10.1038/nmeth.3317.
- Kim J, Ahn M, Choi Y, Ekanayake P, Park CM, Moon C, Jung K, Tanaka A, Matsuda H, Shin T. 2019. Gene expression profile of olfactory transduction signaling in an animal model of human multiple sclerosis. Exp Neurobiol. 28(1):74–84. doi:10.5607/en.2019.28.1.74.
- Konishi H, Kiyama H. 2018. Microglial TREM2/DAP12 signaling: a double-edged sword in neural diseases. Front Cell Neurosci. 12:206. doi:10.3389/fncel.2018.00206.
- Kuehn MH, Kim CY, Jiang B, Dumitrescu AV, Kwon YH. 2008. Disruption of the complement cascade delays retinal ganglion cell death following retinal ischemia-reperfusion. Exp Eye Res. 87(2):89–95. doi:10.1016/j.exer.2008.04.012.
- Langmead B, Salzberg SL. 2012. Fast gapped-read alignment with Bowtie 2. Nat Methods. 9(4):357–359. doi:10.1038/nmeth.1923.
- Larabee CM, Desai S, Agasing A, Georgescu C, Wren JD, Axtell RC, Plafker SM. 2016. Loss of Nrf2 exacerbates the visual deficits and optic neuritis elicited by experimental autoimmune encephalomyelitis. Mol Vis. 22:1503–1513.
- Lo TW, Figueroa-Romero C, Hur J, Pacut C, Stoll E, Spring C, Lewis R, Nair A, Goutman SA, Sakowski SA, et al. 2021. Extracellular vesicles in serum and central nervous system tissues contain microRNA signatures in sporadic amyotrophic lateral sclerosis. Front Mol Neurosci. 14:739016. doi:10.3389/fnmol.2021.739016.
- Love MI, Huber W, Anders S. 2014. Moderated estimation of fold change and dispersion for RNA-Seq data with DESeq2. Genome Biol. 15(12):550. doi:10.1186/s13059-014-0550-8.
- Lund MC, Ellman DG, Nissen M, Nielsen PS, Nielsen PV, Jorgensen C, Andersen DC, Gao H, Brambilla R, Degn M, et al. 2022. The inflammatory response after moderate contusion spinal cord injury: A time study. Biology (Basel). 11(6):939.
- Manogaran P, Samardzija M, Schad AN, Wicki CA, Walker-Egger C, Rudin M, Grimm C, Schippling S. 2019. Retinal pathology in experimental optic neuritis is characterized by retrograde degeneration and gliosis. Acta Neuropathol Commun. 7(1):116. doi:10.1186/s40478-019-0768-5.
- Michailidou I, Willems JG, Kooi EJ, van Eden C, Gold SM, Geurts JJ, Baas F, Huitinga I, Ramaglia V. 2015. Complement C1q-C3-associated synaptic changes in multiple sclerosis hippocampus. Ann Neurol. 77(6):1007–1026. doi:10.1002/ana.24398.
- Morimura N, Inoue T, Katayama K, Aruga J. 2006. Comparative analysis of structure, expression and PSD95-binding capacity of Lrfn, a novel family of neuronal transmembrane proteins. Gene. 380(2):72–83. doi:10.1016/j.gene.2006.05.014.
- Nakajima H, Hosokawa T, Sugino M, Kimura F, Sugasawa J, Hanafusa T, Takahashi T. 2010. Visual field defects of optic neuritis in neuromyelitis optica compared with multiple sclerosis. BMC Neurol. 10:45. doi:10.1186/1471-2377-10-45.
- Nam J, Mah W, Kim E. 2011. The SALM/Lrfn family of leucine-rich repeat-containing cell adhesion molecules. Semin Cell Dev Biol. 22(5):492–498. doi:10.1016/j.semcdb.2011.06.005.
- Neo T, Gozawa M, Takamura Y, Inatani M, Oki M. 2020. Gene expression profile analysis of the rabbit retinal vein occlusion model. PLoS One. 15(7):e0236928.
- Nikic I, Merkler D, Sorbara C, Brinkoetter M, Kreutzfeldt M, Bareyre FM, Bruck W, Bishop D, Misgeld T, Kerschensteiner M. 2011. A reversible form of axon damage in experimental autoimmune encephalomyelitis and multiple sclerosis. Nat Med. 17(4):495–499. doi:10.1038/nm.2324.
- Noble J, Forooghian F, Sproule M, Westall C, O'Connor P. 2006. Utility of the national Eye institute VFQ-25 questionnaire in a heterogeneous group of multiple sclerosis patients. Am J Ophthalmol. 142(3):464–468. doi:10.1016/j.ajo.2006.04.051.
- Park HJ, Jung H. 2022. Neuro-immune interactions at single-cell resolution in neurodevelopmental, infectious, and neurodegenerative diseases. Anim Cells Syst (Seoul). 26(4):137–147. doi:10.1080/19768354.2022.2110937.
- Pertea M, Kim D, Pertea GM, Leek JT, Salzberg SL. 2016. Transcript-level expression analysis of RNA-seq experiments with HISAT, StringTie and Ballgown. Nat Protoc. 11(9):1650–1667. doi:10.1038/nprot.2016.095.
- Pertea M, Pertea GM, Antonescu CM, Chang TC, Mendell JT, Salzberg SL. 2015. Stringtie enables improved reconstruction of a transcriptome from RNA-Seq reads. Nat Biotechnol. 33(3):290–295. doi:10.1038/nbt.3122.
- Peterson SL, Nguyen HX, Mendez OA, Anderson AJ. 2015. Complement protein C1q modulates neurite outgrowth in vitro and spinal cord axon regeneration in vivo. J Neurosci. 35(10):4332–4349. doi:10.1523/JNEUROSCI.4473-12.2015.
- Ransohoff RM, Hafler DA, Lucchinetti CF. 2015. Multiple sclerosis-a quiet revolution. Nat Rev Neurol. 11(3):134–142. doi:10.1038/nrneurol.2015.14.
- R Core Team. 2013. R: A language and environment for statistical computing.
- Reich DS, Lucchinetti CF, Calabresi PA. 2018. Multiple sclerosis. N Engl J Med. 378(2):169–180. doi:10.1056/NEJMra1401483.
- Riese RJ, Wolf PR, Bromme D, Natkin LR, Villadangos JA, Ploegh HL, Chapman HA. 1996. Essential role for cathepsin S in MHC class II-associated invariant chain processing and peptide loading. Immunity. 4(4):357–366. doi:10.1016/S1074-7613(00)80249-6.
- Rocha LR, Nguyen Huu VA, Palomino La Torre C, Xu Q, Jabari M, Krawczyk M, Weinreb RN, Skowronska-Krawczyk D. 2020. Early removal of senescent cells protects retinal ganglion cells loss in experimental ocular hypertension. Aging Cell. 19(2):e13089. doi:10.1111/acel.13089.
- Rosenkranz SC, Kaulen B, Zimmermann HG, Bittner AK, Dorr M, Stellmann JP. 2021. Validation of computer-adaptive contrast sensitivity as a tool to assess visual impairment in multiple sclerosis patients. Front Neurosci. 15:591302. doi:10.3389/fnins.2021.591302.
- Sahaboglu A, Paquet-Durand O, Dietter J, Dengler K, Bernhard-Kurz S, Ekstrom PA, Hitzmann B, Ueffing M, Paquet-Durand F. 2013. Retinitis pigmentosa: rapid neurodegeneration is governed by slow cell death mechanisms. Cell Death Dis. 4(2):e488. doi:10.1038/cddis.2013.12.
- Salter AR, Tyry T, Vollmer T, Cutter GR, Marrie RA. 2013. “Seeing” in NARCOMS: a look at vision-related quality of life in the NARCOMS registry. Mult Scler. 19(7):953–960. doi:10.1177/1352458512469694.
- Schartz ND, Tenner AJ. 2020. The good, the bad, and the opportunities of the complement system in neurodegenerative disease. J Neuroinflammation. 17(1):354. doi:10.1186/s12974-020-02024-8.
- Shannon P, Markiel A, Ozier O, Baliga NS, Wang JT, Ramage D, Amin N, Schwikowski B, Ideker T. 2003. Cytoscape: a software environment for integrated models of biomolecular interaction networks. Genome Res. 13(11):2498–2504. doi:10.1101/gr.1239303.
- Shin T, Ahn M, Kim J, Jung K, Moon C, Kim MD. 2021. Visual dysfunction in multiple sclerosis and its animal model, experimental autoimmune encephalomyelitis: a review. Mol Neurobiol. 58(7):3484–3493. doi:10.1007/s12035-021-02355-4.
- Shin T, Kojima T, Tanuma N, Ishihara Y, Matsumoto Y. 1995. The subarachnoid space as a site for precursor T cell proliferation and effector T cell selection in experimental autoimmune encephalomyelitis. J Neuroimmunol. 56(2):171–178. doi:10.1016/0165-5728(94)00144-D.
- Shindler KS, Guan Y, Ventura E, Bennett J, Rostami A. 2006. Retinal ganglion cell loss induced by acute optic neuritis in a relapsing model of multiple sclerosis. Mult Scler. 12(5):526–532. doi:10.1177/1352458506070629.
- Someya H, Ito M, Nishio Y, Sato T, Harimoto K, Takeuchi M. 2022. Osteopontin-induced vascular hyperpermeability through tight junction disruption in diabetic retina. Exp Eye Res. 220:109094. doi:10.1016/j.exer.2022.109094.
- Sorensen TL, Ransohoff RM. 1998. Etiology and pathogenesis of multiple sclerosis. Semin Neurol. 18(3):287–294. doi:10.1055/s-2008-1040879.
- Stevens B, Allen NJ, Vazquez LE, Howell GR, Christopherson KS, Nouri N, Micheva KD, Mehalow AK, Huberman AD, Stafford B, et al. 2007. The classical complement cascade mediates CNS synapse elimination. Cell. 131(6):1164–1178. doi:10.1016/j.cell.2007.10.036.
- Subramanian A, Tamayo P, Mootha VK, Mukherjee S, Ebert BL, Gillette MA, Paulovich A, Pomeroy SL, Golub TR, Lander ES, et al. 2005. Gene set enrichment analysis: a knowledge-based approach for interpreting genome-wide expression profiles. Proc Natl Acad Sci U S A. 102(43):15545–15550. doi:10.1073/pnas.0506580102.
- Szklarczyk D, Gable AL, Nastou KC, Lyon D, Kirsch R, Pyysalo S, Doncheva NT, Legeay M, Fang T, Bork P, et al. 2021. The STRING database in 2021: customizable protein-protein networks, and functional characterization of user-uploaded gene/measurement sets. Nucleic Acids Res. 49(D1):D605–D612. doi:10.1093/nar/gkaa1074.
- Talman LS, Bisker ER, Sackel DJ, Long DA, Galetta KM, Ratchford JN, Lile DJ, Farrell SK, Loguidice MJ, Remington G, et al. 2010. Longitudinal study of vision and retinal nerve fiber layer thickness in multiple sclerosis. Ann Neurol. 67(6):749–760.
- Tassoni A, Farkhondeh V, Itoh Y, Itoh N, Sofroniew MV, Voskuhl RR. 2019. The astrocyte transcriptome in EAE optic neuritis shows complement activation and reveals a sex difference in astrocytic C3 expression. Sci Rep. 9(1):10010. doi:10.1038/s41598-019-46232-6.
- Tato M, Kumar SV, Liu Y, Mulay SR, Moll S, Popper B, Eberhard JN, Thomasova D, Rufer AC, Gruner S, et al. 2017. Cathepsin S inhibition combines control of systemic and peripheral pathomechanisms of autoimmune tissue injury. Sci Rep. 7(1):2775. doi:10.1038/s41598-017-01894-y.
- Tokuda K, Baron B, Kuramitsu Y, Kitagawa T, Tokuda N, Morishige N, Kobayashi M, Kimura K, Nakamura K, Sonoda KH. 2018. Optimization of fixative solution for retinal morphology: a comparison with Davidson's fixative and other fixation solutions. Jpn J Ophthalmol. 62(4):481–490. doi:10.1007/s10384-018-0592-7.
- Tuller T, Atar S, Ruppin E, Gurevich M, Achiron A. 2011. Global map of physical interactions among differentially expressed genes in multiple sclerosis relapses and remissions. Hum Mol Genet. 20(18):3606–3619. doi:10.1093/hmg/ddr281.
- van Horssen J, Witte ME, Schreibelt G, de Vries HE. 2011. Radical changes in multiple sclerosis pathogenesis. Biochim Biophys Acta. 1812(2):141–150. doi:10.1016/j.bbadis.2010.06.011.
- Villoslada P, Cuneo A, Gelfand J, Hauser SL, Green A. 2012. Color vision is strongly associated with retinal thinning in multiple sclerosis. Mult Scler. 18(7):991–999. doi:10.1177/1352458511431972.
- Wang X, Fan J, Zhang M, Sun Z, Xu G. 2013. Gene expression changes under cyclic mechanical stretching in rat retinal glial (Muller) cells. Plos One. 8(5):e63467. doi:10.1371/journal.pone.0063467.
- Weerasinghe-Mudiyanselage PDE, Kang S, Kim JS, Kim JC, Kim SH, Wang H, Shin T, Moon C. 2022. Transcriptome profiling in the Hippocampi of mice with experimental autoimmune encephalomyelitis. Int J Mol Sci. 23(23):14829. doi:10.3390/ijms232314829.
- Weng W, Cheng F, Zhang J. 2022. Specific signature biomarkers highlight the potential mechanisms of circulating neutrophils in aneurysmal subarachnoid hemorrhage. Front Pharmacol. 13:1022564. doi:10.3389/fphar.2022.1022564.
- Yerlikaya EI, Toro AL, Sunilkumar S, VanCleave AM, Leung M, Kawasawa YI, Kimball SR, Dennis MD. 2022. Spleen tyrosine kinase contributes to Muller Glial expression of proangiogenic cytokines in diabetes. Invest Ophthalmol Vis Sci. 63(11):25. doi:10.1167/iovs.63.11.25.
- Zabel MK, Kirsch WM. 2013. From development to dysfunction: microglia and the complement cascade in CNS homeostasis. Ageing Res Rev. 12(3):749–756. doi:10.1016/j.arr.2013.02.001.
- Zambonin JL, Zhao C, Ohno N, Campbell GR, Engeham S, Ziabreva I, Schwarz N, Lee SE, Frischer JM, Turnbull DM, et al. 2011. Increased mitochondrial content in remyelinated axons: implications for multiple sclerosis. Brain. 134(Pt 7):1901–1913. doi:10.1093/brain/awr110.