
ABSTRACT
Eurasian otters (Lutra lutra) have a broad distribution across Eurasia, but biogeographic data outside of western Europe is limited to disconnected pockets. Based on current subspecies designations, Asia appears to harbour a large proportion of the species’ diversity, with 10 of 12 Eurasian otter subspecies found in Asia. Here we provide a range-wide synthesis of mitochondrial data, inferring a timeline and pattern of phylogeographic signals. Whole mitochondrial genomes of 27 Eurasian otters across 4 subspecies are presented from newly generated data (n = 6; 4 from Korea, 1 from Hong Kong and 2 from UK), assembled from the Sequence Read Archive (n = 4), and sourced from GenBank (n = 17). We then combined whole mitochondrial genome results with cytochrome b data to increase the sample size and contextualise our results with prior studies. We identified five distinct lineages that were discordant with current subspecies classification. Phylogenetic dating revealed that the earliest diverging lineage was the Japanese lineage, with remaining lineages diverging ≥0.08 million years ago. Mitochondrial diversity calculated by sample locations seemed mainly driven by the presence of multiple lineages. When grouping samples by lineage, genetic diversity was highest in Lineage 1 (primarily found in China and Laos), followed by Lineage 2 (primarily found in Korea), and lowest diversity identified in Lineage 3 (primarily found in Europe). Our findings highlight previously undetected lineage diversity within Eurasian otters, but also the need for further taxonomic and genomic evaluation of the species in Asia. The identified unique, distinct lineages of Eurasian otters also warrant urgent conservation attention.
Introduction
Eurasian otters (Lutra lutra; Linnaeus, 1758) have the largest geographic distribution of any otter (subfamily Lutrinae) species, spanning from the Iberian Peninsula in the West, to Japan in the East, from Norway and Russia in the north, to North Africa and Southeast Asia in the south (Roos et al. Citation2015). Population declines and bottlenecks have prompted protective legislation and extensive monitoring and research in Western Europe, but only limited protection or research has been extended to subspecies and populations in Asia (Basnet et al. Citation2020), despite reports of severe declines in China during recent decades (Li and Chan Citation2018; Chen et al. Citation2023). Threats to this globally ‘near threatened’ species vary across their range and are broad, encompassing chemical pollution, habitat loss and fragmentation, and illegal trade (Roos et al. Citation2015). As in other widely distributed Eurasian carnivores such as brown bears (Ursus arctos) and red foxes (Vulpes vulpes) (Davison et al. Citation2011; Statham et al. Citation2014), it is likely that these understudied regions of Asia hold a large proportion of the diversity of the species, both genetically and phenotypically. Indeed, 10 of the 12 known Eurasian otter subspecies are found in Asia (Hung and Law Citation2016).
Despite the debate around delineating populations into evolutionarily significant units, subspecies and species, these classifications and terms have value in the practical conservation and management of endangered species (Fraser and Bernatchez Citation2001). Multiple subspecies of Eurasian otters have been described over the last 250 years based on a combination of geographic distribution and morphological evidence, usually derived from a limited number of examined specimens. Between seven and 28 subspecies have been cited, with the 2015 IUCN Red List report indicating seven subspecies (Roos et al. Citation2015), although another commonly referenced paper indicates 12 extant subspecies (Hung and Law Citation2016). The only genomic assessment of Eurasian otter subspecies was conducted by Waku et al. (Citation2016), identifying the genetically distinct Japanese otter using whole mitochondrial genome sequences. Currently, the data required to establish the Japanese otter as a separate species (Lutra nippon) or a Eurasian otter subspecies (Lutra lutra nippon) is lacking, for example phenotyping and morphology, and therefore we refer to the Japanese otter as a subspecies, L. l. nippon as in Waku et al. (Citation2016). Publication of the evidence for the distinct Japanese otter in 2016, four years after Eurasian otters were declared extinct in Japan in 2012 (Waku et al. Citation2016), highlights the urgency of further genetic assessments of the species. Many Eurasian otter subspecies are currently restricted to small geographic regions, for which only very limited information on the species’ conservation status is available. For example, L. l. aurobrunnea is endemic to ‘the lower and central hilly region of Nepal’ (Hung and Law Citation2016), where there have been ‘no recent sightings documented’ and ‘literature reports [are] largely over 30 years old’ (Yoxon and Yoxon Citation2019). Although a combination of risk factors is leading to global otter population declines, the structuring of small, remote, isolated populations enhances the risk of putative subspecies, such as L. l. aurobrunnea, going extinct before any research on the presence or taxonomy of the subspecies is conducted.
Based on a lack of sightings since 1979, L. l. nippon was declared extinct in Japan in 2012. However, Eurasian otters were recorded on camera traps in Japan in 2017 (Nakanishi and Izawa Citation2019). Nakanishi and Izawa (Citation2019) hypothesise that otters may have naturally or artificially been reintroduced to Japan across the 60 km strait from the coastal islands of the Korean Peninsula. If otters did manage to cross from Korea to Japan, gene flow of L. l. nippon from Japan to Korea – before the Japanese population had gone extinct – is also plausible. However, prior studies of mitochondrial variation in Korea have shown very low diversity (Koh et al. Citation2004), indicating that this region is unlikely to harbour any L. l. nippon. As one of Japan’s nearest neighbouring countries, analysis of multiple samples from Korea provides the opportunity to investigate within-region variation, while also evaluating the possibility that the Japanese lineage (L. l. nippon), currently believed to be extinct, might in fact persist outside of Japan.
Genetic tools provide an insight into the evolutionary history, processes, and divergences among populations, offering a framework for assigning subspecies classifications based on phylogenetic history. Commonly used markers include control region and cytochrome b regions of the mitochondrial genome, often ranging from 100–400 base pairs (bp) in length (Cassens et al. Citation2000; Ferrando et al. Citation2004), with some examples of fragments 900–1600 bp in length (Mucci et al. Citation1999; Koh et al. Citation2004; Koepfli et al. Citation2008; Coudrat et al. Citation2022). In Eurasian otters, control region fragments have been utilised most extensively in previous studies, however this fragment has a very limited resolution (du Plessis et al. Citation2023). In contrast, cytochrome b has been less frequently used, but as a 1140 bp fragment, it potentially has a higher resolution for fine-scale, recent evolutionary processes. This marker has been used in phylogenetics (Koepfli and Wayne Citation1998) and species identification (Fernandes et al. Citation2008), but more recently has been effective in assessing regional taxonomy and phylogeography, identifying haplotypes from Italy, Iraq (Moretti et al. Citation2017), Korea, Japan (Park et al. Citation2019), and Laos (Coudrat et al. Citation2022). Even fewer studies have used whole mitochondrial genome sequences, at least 16,000 bp in length (Jang et al. Citation2009; Waku et al. Citation2016), which provide a significant improvement in genetic resolution (i.e. number of variable sites, and hence statistical support for phylogenetic groupings; (Keis et al. Citation2013)) over both control region and cytochrome b fragments. Increasingly, studies are using concatenations of multiple mitochondrial markers, resulting in 1500–4000 bp in length, analysed in parallel to autosomal microsatellites or a subset of whole mitochondrial genomes (Coudrat et al. Citation2022; Jang-Liaw et al. Citation2023). Both Coudrat et al. (Citation2022) and Jang-Liaw et al. (Citation2023) highlighted the value of local studies, using established markers in combination with a subset of whole mitochondrial genomes. Specifically, they have been applied to species identification and occurrence, and baseline population genetics in regions where conducting Eurasian otter population genetics is challenging and existing knowledge is currently limited (Coudrat et al. Citation2022; Jang-Liaw et al. Citation2023).
Here we present a phylogeographic assessment of the Eurasian otter, based on whole mitochondrial sequences across the species range, with a focus on populations in Asia. To contextualise our findings with prior studies, we also include analyses of the cytochrome b gene, which in previous studies has been surveyed across a broader geographic range. Combining evidence from high-resolution whole mitochondrial genome sequences with the larger sample size of cytochrome b sequences available, we address the following three hypotheses: (1) that the distinct Japanese lineage (L. l. nippon) is not present in Korea or elsewhere in eastern Eurasia; (2) that genetic lineages do not reflect subspecies classifications based on geography; and (3) that there is higher mitochondrial variation in Asia than in western Europe.
Methods
Sample collection and sequencing
Samples () from UK (GBR01, GBR02), Hong Kong (CHN01) and South Korea (KOR01, KOR02, KOR03) were collected and sequenced using short, paired end reads, for this study (see Supplementary Material).
Table 1. Eurasian otter sample accessions, locations, and publications for whole mitochondrial genome data included in this study. Metadata for all newly generated, publicly available SRA and whole mitochondrial genome sequences analysed in the study. Whole mitochondrial genome lineages are shown, as inferred in this and prior studies.
Previously published whole mitochondrial genome data
Paired-end Sequence Read Archive (SRA) data was available for three samples, from Russia, Norway and Denmark, alongside single-end read data for one sample collected in 1923 from Sumatra (). These data were downloaded and assembled using the same pipeline as the newly generated data, except for the Sumatran sample (SRR5192239). A further 16 previously published whole mitochondrial genome sequences were available on GenBank alongside the one from the Eurasian otter reference genome (LR822067), and the Hairy-nosed otter (Lutra sumatrana) was included as an outgroup, leading to a total of 28 whole mitochondrial genome sequences included in these analyses (). Known sample locations and mapping for regional samples are given in Supplementary Material.
Putative subspecies classifications were assigned based on the known locations of samples and the geographic distribution of subspecies according to Hung and Law (Citation2016), where possible. Currently, there is no other information which could be used to discern subspecies. From the 12 currently recognised subspecies, we have sampled four; L. l. lutra, L. l. chinensis, L. l. barang and L. l. nippon.
Whole mitochondrial genome assembly and analyses
All newly generated and SRA data were assembled using NOVOPlasty v4.3.1 (Dierckxsens et al. Citation2017), except for sample SRR5192239 which was assembled using MITObim v1.9.1 (Hahn et al. Citation2013) (see Supplementary Material).
All whole mitochondrial genome sequences were aligned using MAFFT v7.481 (Katoh et al. Citation2005; Katoh et al. Citation2002), using the ‘ – auto’ option to automatically select an appropriate alignment strategy, which was FFT-NS-2 (fast, progressive method). Sequences were aligned with and without the outgroup, before removing the repeat region in Geneious Prime v2022.0.2 (https://www.geneious.com). Both with and without the outgroup aligned, the repetitive region was removed from bases 16,034–16,255 (relative to the reference mitochondrial sequence, LR822067), resulting in a final alignment length of 16,471 bp with the outgroup, and 16,432 bp without the outgroup. PopArt v1.7 (Leigh and Bryant Citation2015) was used to produce a TCS network (Clement et al. Citation2002) of this alignment, with the outgroup removed, and indels not considered (therefore some haplotypes are collapsed into a single node). The R packages pegas (Paradis Citation2010) and ape (Paradis and Schliep Citation2019) were used to calculate summary statistics including segregating sites, haplotype diversity and nucleotide diversity (π). The standard error of the nucleotide diversity estimate was calculated as the square root of the variance estimated by pegas, divided by the square root of sample size. Summary statistics were calculated by groups based on both broad geographic region and whole mitochondrial lineage membership (see SM1). BEAST2 v2.6.6 (Bouckaert et al. Citation2019) was used to produce a phylogeny, and date divergences. ModelFinder (Kalyaanamoorthy et al. Citation2017) within IQ-TREE (Nguyen et al. Citation2015) was used to identify the best-fitting model, based on the Bayesian Information Criterion (BIC), which could be implemented in BEAST2. This was the HKY model (Hasegawa et al. Citation1985), defined as unequal transition/transversion rates, using unequal, empirical base frequencies, and estimating the proportion of invariant sites. Variation across sites was modelled using a gamma distribution, with a kappa (ratio of transition and transversion rates) of 2 and a strict molecular clock. The Markov chain Monte Carlo (MCMC) was run for 15,000,000 iterations and stored every 1000. Convergence was assessed using Tracer v1.7.2 (Rambaut et al. Citation2018), where all ESS values were over 500. TreeAnnotator was used to combine iterations, after discarding the first 10% as burn-in, and FigTree v1.4.4 (http://tree.bio.ed.ac.uk/software/figtree/) was used to visualise the tree.
As there are limited fossil calibration points available within a reasonable phylogenetic distance from Eurasian otters, to provide effective estimations of intraspecific divergence times, priors were selected based on estimated divergence times of our outgroup (L. sumatrana) from our species (L. lutra), taken from previous large scale dated phylogenies. Of the four previous studies to estimate the divergence time of L. sumatrana and L. lutra, two scenarios are supported by two studies each. Firstly, Koepfli et al. (Citation2008) estimated that L. sumatrana and L. lutra diverged at 1.8 million years ago (Mya, 0.9–2.7 95% Highest Probability Density, HPD) based on eight fossil calibration points across all mustelids, including a Lutra affinis fossil from 3.6 Mya (early Pliocene). Secondly, Law et al. (Citation2018) estimated the same species diverged at 1.67 Mya (0.99–2.5 95% HPD) based on 74 fossil calibration points across all Musteloidea species. Thirdly, Waku et al. (Citation2016) estimated much earlier divergence times occurring at 3.24 Mya (1.80–4.81 95% HPD), based on two fossil calibration points >14 Mya, and finally, Hassanin et al. (Citation2020) estimated this divergence to be 3.4 or 3.8 Mya (using either log-normal or uniform fossil calibration priors, respectively) based on 74 fossil calibration points across Carnivora. Based on these studies, we set the time of divergence between L. sumatrana and L. lutra using an external prior, to obtain intraspecific divergence times within L. lutra. Specifically, we used two alternative calibration time scenarios for the L. sumatrana and L. lutra divergence, occurring at (1) 0.9–2.7 Mya and (2) 1.80–4.81 Mya, implemented in BEAST2 as uniform priors, and we present results from both scenarios.
Cytochrome b
Cytochrome b sequences were gathered from GenBank and combined with all whole mitochondrial genome sequences used in this study, totalling 91 sequences from 141 samples. Sequences were aligned and trimmed to 1140 bp of the cytochrome b based on the annotated reference mitochondrial genome (NC_062277.1). A TCS network, and summary statistics were generated using the same methods as for the whole mitochondrial genome data. Full methods for cytochrome b analyses are provided in Supplementary Material. For sample KOR02, uncertainty between an A or G base at 282 bp made it not possible to determine as either haplotype KO3 or KO4, and it is therefore handled as a separate haplotype for summary statistics, rather than incorrectly classifying as either KO3 or KO4, but we acknowledge that it is not a unique haplotype.
Results
Based on the alignment of 27 sequences of 16,432 bp, 26 unique haplotypes across 890 segregating sites were identified. For the cytochrome b region, 141 sequences were included for 1140 bp, from which 27 unique haplotypes were identified. Known cytochrome b haplotypes made up 13 of these, and the remaining 14 haplotypes were novel or unnamed, and therefore we named them as LUT01 to LUT14 (see SM1).
The TCS network of the whole mitochondrial genome sequences identified five main lineages ((a)), the geographic locations of which are visualised in . Although less clear due to the limited resolution provided by the shorter fragment, the cytochrome b TCS network results ((b)) were consistent with the findings from the whole mitochondrial genome sequences, showing the same five main lineages (geographic locations presented in Figure SM 1).
Figure 1. Statistical parsimony networks of Eurasian otters based on (A) whole mitochondrial genomes and (B) cytochrome b. (A) Network of 27 whole mitochondrial genome sequences (16,432 bp, following removal of the tandem repeat region), where nodes are labelled by sample ID/accession and sample location (see SM1). (B) Network of 141 cytochrome b sequences (1140 bp), where nodes are labelled by haplotype name (see SM1). The main five mitochondrial lineages identified in this study are circled and labelled by lineage name, and subspecies found in that lineage. Nodes are a pie chart, colour coded by the number of samples from each sample location, grouped into broad geographic regions, and sized according to haplotype frequency. Dashes on lines represent mutational steps.
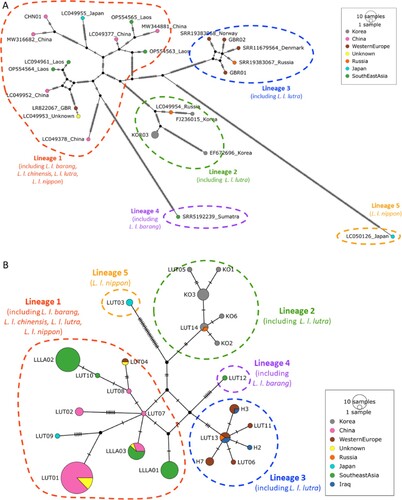
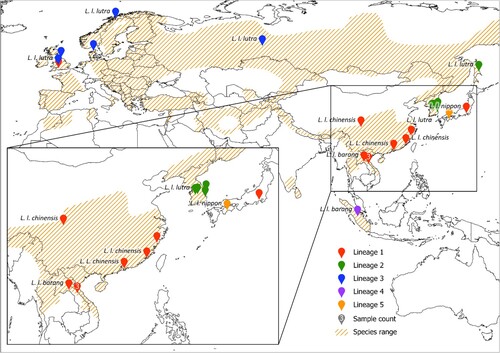
Figure 2. Map of sample locations, sample counts, subspecies classifications and whole mitochondrial genome lineages. Exact sample locations are represented by a pin, and where this was not available, the centroid of a region is also represented by a pin (details of exact and centroid locations in SM1). The number of samples from a location is given in white within the pin if it is more than 1. The subspecies classifications of each sample are given in black text beside the pin, with adjacent, duplicate subspecies labels removed. The full species range is highlighted in orange hash from (Roos et al. Citation2015). Of the 27 Eurasian otter samples included in this study, the locations of 22 are plotted, 1 is unknown, and the only location information given for 2 was ‘Korea’ and for 2 was ‘China’, therefore these are not included in this map.
For the whole mitochondrial genomes data, when samples were grouped by geographic origin, the number of segregating sites and nucleotide diversity were significantly higher in the Japanese samples due to both Lineages 1 and 5 being present (). Korea showed the lowest nucleotide diversity, followed by China and Western Europe, with sample sizes of 6, 6 and 5. Regardless of sample sizes (n = 2), 2–3× higher nucleotide diversities were observed in Russia and Southeast Asia than Korea, China, and Western Europe. This is likely due to the large geographic range captured by the 2 Russian samples, and the 2 distinct lineages captured by both the Southeast Asian and Russian samples. When samples were grouped by lineage, the lowest nucleotide diversity and number of segregating sites were observed within Lineage 3 (primarily identified in Western Europe) despite its broad geographic range. Lineage 2, found in samples from Korea and east Russia, showed higher nucleotide diversity and segregating sites, and even higher values were found for Lineage 1 (primarily identified in Asia). Due to only one haplotype being identified for both Lineage 4 and Lineage 5, mitochondrial diversity within these lineages could not be determined.
Table 2. Summary statistics of whole mitochondrial genome diversity of Eurasian otters calculated across broad geographic regions and mitochondrial genome lineage. Sample size (n), number of haplotypes (nh), segregating sites (s), haplotype diversity (h) and nucleotide diversity (π). Southeast Asia includes samples from Laos and Sumatra, and Western Europe includes samples from UK, Denmark and Norway.
Summary statistics for the cytochrome b data reflect the patterns observed in the whole mitochondrial genome sequence summary statistics (see Supplementary Table 1). Despite many fewer samples included for whole mitochondrial genomes (n = 27) compared to cytochrome b sequences (n = 141), a similar number of unique haplotypes were identified; 26 whole mitochondrial genome haplotypes compared to 27 cytochrome b haplotypes. The number of segregating sites (s) and haplotype diversity (h) are lower in the cytochrome b dataset than whole mitochondrial genome sequences, reflecting the differences between the markers. Nucleotide diversity is comparable between datasets, with the exception of a decrease from 0.005 in whole mitochondrial genomes to 0.003 in cytochrome b for Southeast Asia due to the addition of many samples of the same haplotype identified in Laos. A similar effect is observed for China.
For the dated phylogeny, priors and estimated mean divergence times (and 95% HPD intervals) of each lineage identified in are given in . The resulting topology estimated from the whole mitochondrial genome phylogenetic analysis was consistent between the two tested scenarios (which assumed two different divergence times between L. lutra and L. sumatrana; ). As expected, dates of divergence among lineages reflected the differences in priors between scenarios, with all divergence dates being earlier when the prior for outgroup divergence was earlier (scenario 2). In line with previous studies, lineage 5 (L. l. nippon sample) was the earliest to diverge within this dataset, between 0.29 and 1.55 Mya, i.e. within the Pleistocene. The 95% HPD intervals overlapped for the remaining divergences among lineages, and all divergences occurred prior to 0.08 Mya.
Figure 3. Dated maximum clade credibility tree from BEAST2 of Eurasian otter whole mitochondrial genome lineages. Topology, branch lengths and 95% HPD interval bars for divergence times were estimated using priors from scenario 1, which assumed a divergence between L. lutra and L sumatrana at 0.9–2.7 Mya. Values at nodes show estimated mean date of lineage divergence based on priors from scenario 1 (left value)/scenario 2 (right value). Time is given in units of Million years ago (Mya). All node posterior probabilities were 1, except the divergence of Lineage 4, which was 0.86 for scenario 1 and 0.87 for scenario 2.
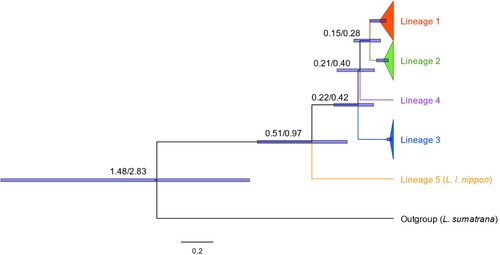
Table 3. Calibration priors and estimated divergence times of Eurasian otter lineages as estimated using BEAST2. All units are Million years ago (Mya), and in brackets are 95% HPD intervals.
Discussion
Using a combination of newly generated and previously published whole mitochondrial genome and cytochrome b data, we here provide a range-wide synthesis and timeline of the phylogeography of Eurasian otters. While we acknowledge the limited sample size, distribution and subspecies captured in this dataset, we believe this work provides a significant development to our understanding of the species and subspecies relative to prior studies.
Mitochondrial lineages and their discordance with current subspecies
Whole mitochondrial genome Lineages 1 and 2 were originally defined by Waku et al. (Citation2016), and subsequently their geographic distribution was expanded by du Plessis et al. (Citation2023), and further expanded in this study. Specifically, here we identified Lineage 1 to include two additional samples from China (from Hong Kong and Kinmen Island) and three additional samples from Laos. We also identified three additional samples from South Korea in Lineage 2. This confirms the known geographic distributions of these lineages: Lineage 1 is found in China, Japan, Laos and the UK, and Lineage 2 is found in Korea and east Russia. du Plessis et al. (Citation2023) described a previously uncharacterised lineage (Lineage 3), to which the present study assigns two additional samples from the UK, demonstrating the presence of this lineage in western Europe and central Russia.
In addition, we here describe a further two mitochondrial lineages of Eurasian otters: Lineage 4 containing the distinct L. l. barang sample from Sumatra, and Lineage 5 containing the distinct L. l. nippon from Japan as identified in Waku et al. (Citation2016). We found no evidence of lineage 5 in Korea nor neighbouring mainland Asia, however more sampling would be required to investigate if the (extinct) Japanese L. l. nippon is present in Korea (our first hypothesis).
Of the five samples labelled as L. l. barang, one from Sumatra (SRR5192239) and four from Laos (LC094961, OP554563, OP554564, OP554565), the Laos samples were assigned to Lineage 1, and only the sample from Sumatra was identified as Lineage 4. Similarly, the two samples labelled as L. l. nippon (LC049955 and LC050126) were not grouped together but separated into Lineages 1 and 5. Although L. l. chinensis samples are only found in Lineage 1, L. l. lutra samples are found across Lineages 1, 2 and 3. Overall, there is therefore no concordance between the subspecies classification based on Hung and Law (Citation2016) and whole mitochondrial genome lineages, supporting our second hypothesis.
The cytochrome b results highlight the difficulties in identifying the distinct lineages observed from the whole mitochondrial genomes when assessing only a 1140 bp fragment. However, using samples sequenced for cytochrome b increased the sample size and geographic breadth assessed in this study. When comparing summary statistics of the whole mitochondrial genome and cytochrome b datasets, nucleotide diversity was highlighted as a robust metric for use in comparisons among different mitochondrial fragments, showing much less variation between datasets than the number of segregating sites or haplotype diversity. Extracting the cytochrome b region from all whole mitochondrial genome sequences included in our analyses enabled us to identify corresponding lineages across both datasets. Firstly, the sample size of the divergent Lineage 5 (L. l. nippon) increased to two when combining whole mitochondrial genome and cytochrome b data, with the additional sample also being from Japan. Furthermore, we have expanded the likely geographic range of Lineage 3 to include southern Europe (Italy and Portugal), and Iraq. Specifically, three haplotypes (H1, H2 and H3) were identified in samples from Iraq, two of which were also identified in whole mitochondrial genome samples from central Russia, UK and Norway, all from Lineage 3. Samples from Iraq were from two locations, one in northern Iraq, near to the range of L. l. lutra (containing haplotypes from Lineages 1, 2 and 3), and one from southern Iraq, close to or within the distribution range attributed to L. l. meridionalis, for which the whole mitochondrial genome has not yet been sequenced. Our results tentatively indicate that this subspecies (L. l. meridionalis) is likely to belong to Lineage 3, consistent with possible inclusion in L. l. lutra. This result highlights not only the importance of populations in Asia for their disproportionately large genetic and taxonomic variation relative to the well-studied western European populations, but also the importance of populations across the range, for example in the Middle East and North Africa, for which demographic information is difficult to obtain, much less samples for genetic or genomic analysis.
This discordance among subspecies classifications and mitochondrial lineages has been identified in other Eurasian mammals, such as the Eurasian lynx (Lynx lynx) (Mengüllüoğlu et al. Citation2021; Behzadi et al. Citation2022), in contrast to species such as the red fox (Vulpes vulpes) which shows considerable overlap between subspecies and mitochondrial lineages in North Africa and the Middle East (Statham et al. Citation2014). These examples, and the Eurasian otter, highlight the growing need for combined genetic and morphometric analyses to confidently delineate species, subspecies or distinct lineages from intricate species and subspecies complexes, as demonstrated by Colella et al. (Citation2021) for ermines (Mustela spp.).
Diversification timeline and regional genetic diversity
Overall, whole mitochondrial genome haplotype diversity was high; we only observed one duplicate haplotype, highlighting the value of genomics relative to prior genetic methods (Keis et al. Citation2013). When samples were grouped by location, we observed the highest diversity in regions where more than one lineage was found, for example Japan and Russia. Within lineages, the lowest mitochondrial variation was observed in lineage 3 (found in western Europe), followed by lineage 2 (Korea and east Russia), and the highest variation was observed in lineage 1 (primarily occurring in Asia). These results support our third hypothesis, that mitochondrial variation is higher in Asia (lineage 2 in Korea and lineage 1 in China) than western Europe (lineage 3). These high levels of genetic diversity further highlight the urgent need for genomic studies into the subspecies and populations of Eurasian otters in Asia.
Across Eurasian mammals, high mitochondrial diversity and multiple distinct lineages have been identified in Asia (Li et al. Citation2021). Most notable are distinct Japanese lineages found in multiple species, for example in Eurasian otters (Waku et al. Citation2016; Park et al. Citation2019), brown bears (Ursus arctos) (Hirata et al. Citation2013), black bears (Ursus thibetanus) (Kishida et al. Citation2022; Zou et al. Citation2022), red foxes (Vulpes vulpes) (Statham et al. Citation2014; Kutschera et al. Citation2013), and grey wolves (Canis lupus) (Koblmüller et al. Citation2016). These studies have suggested that multiple waves of recolonisation have resulted in diverse mitochondrial lineages in Japan, with Koblmüller et al. (Citation2016) highlighting the role of sea level changes in the geographic separation of specific lineages. For red foxes, these geographically restricted populations in Japan, show lower genetic diversity than the geographically widespread lineages (Kutschera et al. Citation2013), in contrast to what we have observed in the Eurasian otter.
The obtained dated phylogeny is consistent with prior studies (Waku et al. Citation2016), but provides a higher resolution of recent divergences within Eurasian otters than previous work. Divergences among Lineages 1, 2, 3 and 4, are likely to have occurred during the Late Pleistocene, at least 0.08 Mya, whereas the divergence of Lineage 5 is likely to have occurred earlier. However, due to a paucity of suitable fossil calibration points for Eurasian otters and close relatives, it is difficult to provide narrower confidence intervals of divergence times for this species. Assuming these mitochondrial lineages evolved in geographic isolation, separated around 0.08–1.55 Mya depending on the calibration prior scenario, it is likely that regions containing multiple lineages arose through recent natural or artificial translocations. Incidentally, both regions identified in this study to contain multiple mitochondrial lineages in close geographic proximity, Japan and UK, have been hypothesised to have been impacted by recent translocations of the species. du Plessis et al. (Citation2023) identified signals of recent translocations of Asian Eurasian otters to Britain, based on both nuclear and mitochondrial genomic data, and Nakanishi and Izawa (Citation2019) hypothesised that Japan is currently being recolonised by otters from the Korean peninsula, based on camera trapping data. Unfortunately, without modern samples from Japan we cannot validate this hypothesis, however we have included the sample LC049955 published by Waku et al. (Citation2016), which is from Japan, from 1915 or 1916, which groups within Lineage 1 (and mainly comprises samples from China and Laos). Assuming that Lineage 5 (L. l. nippon; represented by sample LC050126) has been present in Japan since at least the 1900s (likely very much longer), the presence of Lineage 1 (sample LC049955) suggests that Lineages 1 and 5 may have coexisted in Japan at least throughout the 1900s, rather than a recent recolonisation of Japan by Lineage 1 postdating the L. l. nippon extinction in 2012. Future work should characterise samples from Japan and surrounding regions over time and to include nuclear data where possible, in order to understand the presence and potential coexistence of multiple mitochondrial lineages in Japan.
This work adds to a growing list of studies investigating range-wide phylogeography of mammals across Eurasia, identifying common and unique biogeographic processes which have shaped the mitochondrial diversity observed in modern populations. Here, we provide the first whole mitochondrial genome assessment of subspecies classifications of Eurasian otters, with a focus on subspecies and populations in Asia. We find discordance between genetic lineages and subspecies, and therefore recommend further research to fully resolve and identify the genetic lineages in the region. We also recommend the use of the identified lineages and nomenclature, to inform conservation and management of the species in Asia, for example when discussing translocations among populations, to avoid anthropogenically mediated gene flow of evolutionarily distinct and isolated populations.
Supplemental Material
Download MS Excel (25.2 KB)Acknowledgements
We would like to thank all present and past Cardiff University Otter Project staff and volunteers, and the Kadoorie Farm and Botanic Gardens for the collection, storage and donation of a sample (CHN01). The Bioinformatic analyses were performed on the Cardiff School of Biosciences’ Biocomputing Hub HPC/Cloud infrastructure, and we are immensely thankful to Dr Ian Merrick and Andy Ells for their support. We thank the editor and two anonymous reviewers for their helpful feedback. Author contibutions: SJdP, FH, and SH designed research, BL and SH collected samples and coordinated sequencing, SJdP conducted analyses and wrote paper with guidance from FH and K-PK. All co-authors provided feedback on the paper.
Disclosure statement
No potential conflict of interest was reported by the author(s).
Data availability statement
Unique haplotype data have been deposited to NCBI Nucleotide Database with the accession numbers OR655422-OR655427 and BK064847. Cardiff University Otter Project has licences to possess and transport otters for England, Wales and Scotland. Permission to possess and transport sample CHN01 was obtained from the Agriculture, Fisheries and Conservation Department of Hong Kong.
Additional information
Funding
References
- Basnet A, Ghimire P, Timilsina YP, Bist BS. 2020. Otter research in Asia: trends, biases and future directions. Glob Ecol Conserv. 24:13.
- Behzadi F, Malekian M, Fadakar D, Adibi MA, Bärmann EV. 2022. Phylogenetic analyses of Eurasian lynx (Lynx lynx Linnaeus, 1758) including new mitochondrial DNA sequences from Iran. Sci Rep. 12:3293. doi:10.1038/s41598-022-07369-z.
- Bouckaert R, Vaughan TG, Barido-Sottani J, Duchêne S, Fourment M, Gavryushkina A, Heled J, Jones G, Kühnert D, De Maio N. 2019. BEAST 2.5: an advanced software platform for Bayesian evolutionary analysis. PLoS Comput Biol. 15:e1006650. doi:10.1371/journal.pcbi.1006650.
- Cassens I, Tiedemann R, Suchentrunk F, Hartl GB. 2000. Mitochondrial DNA variation in the European otter (Lutra lutra) and the use of spatial autocorrelation analysis in conservation. J Hered. 91:31. doi:10.1093/jhered/91.1.31.
- Chen M, Zhang C, Fu A, Shi G, Wang J, Zhan Z, Luan X. 2023. Spatio-temporal distribution pattern and the correlation with key environmental factors of Eurasian otter (Lutra lutra) in Northeast China. Glob Ecol Conserv. 44:e02492.
- Clement M, Snell Q, Walker P, Posada D, Crandall K. 2002. TCS: estimating gene genealogies. In: Parallel and Distributed Processing Symposium, International: 0184. Ft. Lauderdale (FL): IEEE Computer Society.
- Colella JP, Frederick LM, Talbot SL, Cook JA. 2021. Extrinsically reinforced hybrid speciation within Holarctic ermine (Mustela spp.) produces an insular endemic. Divers Distrib. 27:747. doi:10.1111/ddi.13234.
- Coudrat CN, Chutipong W, Sukmak M, Sripiboon S, Klinsawat W. 2022. Taxonomic status of otter species in Nakai-Nam Theun National Park, Lao PDR, based on DNA evidence. Ecol Evol. 12:e9601. doi:10.1002/ece3.9601.
- Davison J, Ho SY, Bray SC, Korsten M, Tammeleht E, Hindrikson M, Østbye K, Østbye E, Lauritzen S-E, Austin J. 2011. Late-Quaternary biogeographic scenarios for the brown bear (Ursus arctos), a wild mammal model species. Quat Sci Rev. 30:418. doi:10.1016/j.quascirev.2010.11.023.
- de Ferran V, Figueiró HV, de Jesus Trindade F, Smith O, Sinding M-HS, Trinca CS, Lazzari GZ, Veron G, Vianna JA, Barbanera F. 2022. Phylogenomics of the world’s otters. Curr Biol. 32:3650.
- Dierckxsens N, Mardulyn P, Smits G. 2017. NOVOPlasty: de novo assembly of organelle genomes from whole genome data. Nucleic Acids Res. 45:e18. doi:10.1093/nar/gkw1060.
- du Plessis SJ, Blaxter M, Koepfli K-P, Chadwick EA, Hailer F. 2023. Genomics reveals complex population history and unexpected diversity of Eurasian otters (Lutra lutra) in Britain relative to genetic methods. Mol Biol Evol. 40(11). doi:10.1093/molbev/msad207.
- Fernandes CA, Ginja C, Pereira I, Tenreiro R, Bruford MW, Santos-Reis M. 2008. Species-specific mitochondrial DNA markers for identification of non-invasive samples from sympatric carnivores in the Iberian Peninsula. Conserv Genet. 9:681. doi:10.1007/s10592-007-9364-5.
- Ferrando A, Ponsa M, Marmi J, Domingo-Roura X. 2004. Eurasian otters, Lutra lutra, have a dominant mtDNA haplotype from the Iberian Peninsula to Scandinavia. J Hered. 95:430. doi:10.1093/jhered/esh066.
- Fraser DJ, Bernatchez L. 2001. Adaptive evolutionary conservation: towards a unified concept for defining conservation units. Mol Ecol. 10:2741. doi:10.1046/j.1365-294X.2001.t01-1-01411.x.
- Gray J. 1867. Notice of Lutronectes whiteleyi, an otter from Japan. Proc Zool Soc Lond. 180.
- Hahn C, Bachmann L, Chevreux B. 2013. Reconstructing mitochondrial genomes directly from genomic next-generation sequencing reads – a baiting and iterative mapping approach. Nucleic Acids Res. 41:e129. doi:10.1093/nar/gkt371.
- Hasegawa M, Kishino H, Yano T-A. 1985. Dating of the human-ape splitting by a molecular clock of mitochondrial DNA. J Mol Evol. 22:160. doi:10.1007/BF02101694.
- Hassanin A, Véron G, Ropiquet A, van Vuuren BJ, Lécu A, Goodman S, Haider J, Nguyen TT. 2020. Evolutionary history of Carnivora (Mammalia, Laurasiatheria) inferred from mitochondrial genomes. bioRxiv.
- Hirata D, Mano T, Abramov AV, Baryshnikov GF, Kosintsev PA, Vorobiev AA, Raichev EG, Tsunoda H, Kaneko Y, Murata K. 2013. Molecular phylogeography of the brown bear (Ursus arctos) in Northeastern Asia based on analyses of complete mitochondrial DNA sequences. Mol Biol Evol. 30:1644. doi:10.1093/molbev/mst077.
- Hung N, Law CJ. 2016. Lutra lutra (Carnivora: Mustelidae). Mamm Species. 48:109. doi:10.1093/mspecies/sew011.
- Jang KH, Ryu SH, Hwang UW. 2009. Mitochondrial genome of the Eurasian otter Lutra lutra (Mammalia, Carnivora, Mustelidae). Genes Genom. 31:19. doi:10.1007/BF03191134.
- Jang-Liaw N-H, Tan Y-C, Chang C-J, Juan C-H, Hou H-Y, Chung L-W, Cao H-S, Waku D, Chang S-W, Lee L-L. 2023. Genetic diversity and structure of Eurasian otters on Kinmen Island. Conserv Genet. 24:589–606. doi:10.1007/s10592-023-01525-2.
- Kalyaanamoorthy S, Minh BQ, Wong TK, Von Haeseler A, Jermiin LS. 2017. ModelFinder: fast model selection for accurate phylogenetic estimates. Nat Methods. 14:587. doi:10.1038/nmeth.4285.
- Katoh K, Kuma K-I, Toh H, Miyata T. 2005. MAFFT version 5: improvement in accuracy of multiple sequence alignment. Nucleic Acids Res. 33:511. doi:10.1093/nar/gki198.
- Katoh K, Misawa K, Kuma K, Miyata T. 2002. MAFFT: a novel method for rapid multiple sequence alignment based on fast Fourier transform. Nucleic Acids Res. 30:3059. doi:10.1093/nar/gkf436.
- Keis M, Remm J, Ho SY, Davison J, Tammeleht E, Tumanov IL, Saveljev AP, Männil P, Kojola I, Abramov AV. 2013. Complete mitochondrial genomes and a novel spatial genetic method reveal cryptic phylogeographical structure and migration patterns among brown bears in north-western Eurasia. J Biogeogr. 40:915. doi:10.1111/jbi.12043.
- Ki JS, Hwang DS, Park TJ, Han SH, Lee JS. 2010. A comparative analysis of the complete mitochondrial genome of the Eurasian otter Lutra lutra (Carnivora; Mustelidae). Mol Biol Rep. 37:1943. doi:10.1007/s11033-009-9641-0.
- Kim H-N, Jo Y-S. 2021. Complete mitochondrial genome sequencing of Lutra lutra (Linnaeus, 1758) (Carnivora: Mustelidae) and its phylogenetic status in Mustelidae. Mitochondrial DNA Part B. 6:2066. doi:10.1080/23802359.2021.1942274.
- Kishida T, Ohashi M, Komatsu Y. 2022. Genetic diversity and population history of the Japanese black bear (Ursus thibetanus japonicus) based on the genome-wide analyses. Ecol Res. 37(5):647–657. doi:10.1111/1440-1703.12335.
- Koblmüller S, Vilà C, Lorente-Galdos B, Dabad M, Ramirez O, Marques-Bonet T, Wayne RK, Leonard JA. 2016. Whole mitochondrial genomes illuminate ancient intercontinental dispersals of grey wolves (Canis lupus). J Biogeogr. 43:1728. doi:10.1111/jbi.12765.
- Koepfli KP, Deere KA, Slater GJ, Begg C, Begg K, Grassman L, Lucherini M, Veron G, Wayne RK. 2008. Multigene phylogeny of the Mustelidae: resolving relationships, tempo and biogeographic history of a mammalian adaptive radiation. BMC Biol. 6:22. doi:10.1186/1741-7007-6-10.
- Koepfli KP, Wayne RK. 1998. Phylogenetic relationships of otters (Carnivora: Mustelidae) based on mitochondrial cytochrome b sequences. J Zool. 246:401. doi:10.1111/j.1469-7998.1998.tb00172.x.
- Koh HS, Yoo MH, Lee BG, Park JG. 2004. Molecular DNA systematic analyses of East Asian mammals: sequence variation of cytochrome b gene and control region of mitochondrial DNA of common otter, Lutra lutra lutra L. (Mammalia, Carnivora) from Korea. Korean J Biol Sci. 8:231. doi:10.1080/12265071.2004.9647755.
- Kutschera VE, Lecomte N, Janke A, Selva N, Sokolov AA, Haun T, Steyer K, Nowak C, Hailer F. 2013. A range-wide synthesis and timeline for phylogeographic events in the red fox (Vulpes vulpes). BMC Evol Biol. 13:1. doi:10.1186/1471-2148-13-114.
- Law CJ, Slater GJ, Mehta RS. 2018. Lineage diversity and size disparity in Musteloidea: testing patterns of adaptive radiation using molecular and fossil-based methods. Syst Biol. 67:127. doi:10.1093/sysbio/syx047.
- Leigh JW, Bryant D. 2015. POPART: full-feature software for haplotype network construction. Methods Ecol Evol. 6:1110. doi:10.1111/2041-210X.12410.
- Li F, Chan BPL. 2018. Past and present: the status and distribution of otters (Carnivora: Lutrinae) in China. Oryx. 52:619. doi:10.1017/S0030605317000400.
- Li Y, Fujiwara K, Osada N, Kawai Y, Takada T, Kryukov AP, Abe K, Yonekawa H, Shiroishi T, Moriwaki K. 2021. House mouse Mus musculus dispersal in East Eurasia inferred from 98 newly determined complete mitochondrial genome sequences. Heredity. 126:132. doi:10.1038/s41437-020-00364-y.
- Margaryan A, Noer CL, Richter SR, Restrup ME, Bülow-Hansen JL, Leerhøi F, Langkjær EMR, Gopalakrishnan S, Carøe C, Gilbert MTP. 2021. Mitochondrial genomes of Danish vertebrate species generated for the national DNA reference database, DNAmark. Environ DNA. 3:472. doi:10.1002/edn3.138.
- Mead D, Hailer F, Chadwick E, Miguez RP, Smith M, Corton C, Oliver K, Skelton J, Betteridge E, Doulcan J, et al. 2020. The genome sequence of the Eurasian river otter, Lutra lutra Linnaeus 1758. Wellcome Open Res. 5:33. doi:10.12688/wellcomeopenres.15722.1.
- Mengüllüoğlu D, Ambarlı H, Barlow A, Paijmans JL, Sayar AO, Emir H, Kandemir İ, Hofer H, Fickel J, Förster DW. 2021. Mitogenome phylogeny including data from additional subspecies provides new insights into the historical biogeography of the Eurasian lynx Lynx lynx. Genes. 12:1216. doi:10.3390/genes12081216.
- Mohd Salleh F, Ramos-Madrigal J, Peñaloza F, Liu S, Mikkel-Holger SS, Riddhi PP, Martins R, Lenz D, Fickel J, Roos C. 2017. An expanded mammal mitogenome dataset from Southeast Asia. GigaScience. 6:gix053. doi:10.1093/gigascience/gix053.
- Moretti B, Al-Sheikhly OF, Guerrini M, Theng M, Gupta BK, Haba MK, Khan WA, Khan AA, Barbanera F. 2017. Phylogeography of the smooth-coated otter (Lutrogale perspicillata): distinct evolutionary lineages and hybridization with the Asian small-clawed otter (Aonyx cinereus). Sci Rep. 7:13. doi:10.1038/s41598-017-00065-3.
- Mucci N, Pertoldi C, Madsen AB, Loeschcke V, Randi E. 1999. Extremely low mitochondrial DNA control-region sequence variation in the otter Lutra lutra population of Denmark. Hereditas. 130:331. doi:10.1111/j.1601-5223.1999.00331.x.
- Nakanishi N, Izawa M. 2019. Rediscovery of otters on the Tsushima Islands, Japan by trail cameras. Mamm Study. 44:215. doi:10.3106/ms2018-0043.
- Nguyen L-T, Schmidt HA, Von Haeseler A, Minh BQ. 2015. IQ-TREE: a fast and effective stochastic algorithm for estimating maximum-likelihood phylogenies. Mol Biol Evol. 32:268. doi:10.1093/molbev/msu300.
- Paradis E. 2010. pegas: an R package for population genetics with an integrated–modular approach. Bioinformatics. 26:419. doi:10.1093/bioinformatics/btp696.
- Paradis E, Schliep K. 2019. ape 5.0: an environment for modern phylogenetics and evolutionary analyses in R. Bioinformatics. 35:526. doi:10.1093/bioinformatics/bty633.
- Park H-C, Kurihara N, Kim KS, Min M-S, Han S, Lee H, Kimura J. 2019. What is the taxonomic status of East Asian otter species based on molecular evidence? Focus on the position of the Japanese otter holotype specimen from museum. Animal Cells Syst. 23:228. doi:10.1080/19768354.2019.1601133.
- Rambaut A, Drummond AJ, Xie D, Baele G, Suchard MA. 2018. Posterior summarization in Bayesian phylogenetics using Tracer 1.7. Syst Biol. 67:901. doi:10.1093/sysbio/syy032.
- Roos A, Loy A, de Silva P, Hajkova P, Zemanová B. 2015. Lutra lutra. The IUCN Red List of threatended species 2015: e. T12419A21935287.
- Statham MJ, Murdoch J, Janecka J, Aubry KB, Edwards CJ, Soulsbury CD, Berry O, Wang Z, Harrison D, Pearch M. 2014. Range-wide multilocus phylogeography of the red fox reveals ancient continental divergence, minimal genomic exchange and distinct demographic histories. Mol Ecol. 23:4813. doi:10.1111/mec.12898.
- Waku D, Nophaseud L, Ando M, Praxaysombath B, Sasaki H, Ogawa H, Sasaki T. Unpublished. The distributional information of Eurasian Otter (Lutra lutra) from uninvestigated area of Laos using fecal DNA.
- Waku D, Segawa T, Yonezawa T, Akiyoshi A, Ishige T, Ueda M, Ogawa H, Sasaki H, Ando M, Kohno N, Sasaki T. 2016. Evaluating the phylogenetic status of the extinct Japanese otter on the basis of mitochondrial genome analysis. PLoS One. 11:19. doi:10.1371/journal.pone.0149341.
- Yoxon P, Yoxon B. 2019. Eurasian otter (Lutra lutra): a review of the current world status. OTTER, J Int Otter Surviv Fund. 5:53.
- Zou T, Kuang W, Yin T, Frantz L, Zhang C, Liu J, Wu H, Yu L. 2022. Uncovering the enigmatic evolution of bears in greater depth: the hybrid origin of the Asiatic black bear. Proc Natl Acad Sci USA. 119(31):e2120307119. doi:10.1073/pnas.2120307119.