
ABSTRACT
Neurulation is an important shape-transforming event during embryonic development where a flat neural plate is converted into a neural tube. Failure in this morphogenetic process accounts for one of the most common birth defects. Mechanical biology has provided key insights into neural tube formation and curvature among many physical properties that are eliciting attention. However, the lack of a proper model to study the effect of curvature has limited the potential to reveal its role in neurulation. In this study, we introduce a novel cell culture method called plate-curving cell culture where a polydimethylsiloxane (PDMS) plate of desired physical properties is curved in either a concave or convex form while the human pluripotent stem cell culture induced to have early neural plate identity is placed on top of its surface. With this method, we observed the elongation of cell colony morphology, as well as the perpendicular alignment of the cell division axis in the concave surface; the oriented cell division does not seem to explain the colony elongation. Transcriptome comparison in search of alternate possibilities suggested selectively altered pathways in the concave surface culture. Our new method is widely available, easy-to-use and culture-friendly, facilitating future mechanobiological studies of neurulation.
Introduction
Function follows form in every level of biology and a developing embryo assuming the right form through a process termed morphogenesis is of paramount importance for the development of an organism, as its defects are likely to lead to embryonic lethality or postnatal dysfunctions. Neurulation, a process where a flat sheet of the neuroectoderm, the origin for all prospective components of the future nervous system, transforms into a tube structure called the neural tube that eventually develops into the brain and the spine, is one the key shape-transforming events of early embryonic development and its malformation accounts for one of the most frequent and serious forms of birth defects around the world (Zaganjor et al. Citation2016; Avagliano et al. Citation2019). While studies in the biology of neural tube formation and its defects boast a long history, scientists now have begun to wonder how physical properties affect the processes of neurulation (Sokol Citation2016; Nikolopoulou et al. Citation2017; Vijayraghavan and Davidson Citation2017), whose questions traditionally fall on the domain of mechanical biology. Recently, mechanobiological studies based on human pluripotent stem cell (hESC) derived in vitro models started to shed novel insights into the topic (Abdel Fattah et al. Citation2021; Karzbrun et al. Citation2021), where physical elements such as geometry and external tension were revealed to be important factors in neural tube formation.
One of the themes that have become relevant in the mechanobiology of morphogenesis is curvature, with which various cellular processes such as cell shape change, proliferation, cellular migration and even stem cell differentiation are modulated (Werner et al. Citation2017; Callens et al. Citation2020; Schamberger et al. Citation2023). Curvature is particularly interesting in neural tube formation because the very first step of neurulation involves the curving of a differentiated neural plate by apical constriction (Nishimura et al. Citation2012; Nikolopoulou et al. Citation2017; Vijayraghavan and Davidson Citation2017) after which the morphogenesis of a neural fold and neural ridges, the formation of hinge points and the neural tube closure follows (Nikolopoulou et al. Citation2017). However, as the processes of neural tube formation involve complex interplay between chemical morphogens and various physical factors in a continually changing system, a dedicated method to appreciate the curvature’s role in neurulation is necessary. Yet, to the best of our knowledge, no model is present to recapitulate the curved neuroepithelium, leaving their effect on the neurulation largely unaddressed.
In this study, we present a novel plate-curving cell culture method that directly addresses this matter, where we cultured hESC-derived human early neuroepithelium-like cell colonies on top of an elastic, culture-compatible polydimethylsiloxane (PDMS) plate and imposed curvature on them upon their early neural induction to mimic the conditions of the early neuroepithelium. We observed tissue-level morphological changes of the curved neuroepithelium and were able to diminish the role of oriented division in morphogenesis. We also detected molecular signatures of distinct developmental signaling pathways in these curved neuroepithelia, which might contribute to the morphogenetic changes and their further progression into a more differentiated state.
Results
Plate-curving cell culture method and establishment of human neuroepithelium-like cell sheets
We envisioned a cell culture system where cell colonies were cultured on top of an elastic plate and when desired, the plate was curved and fit inside a well to maintain the curvature in either concave or convex curvature ((B)). We implemented such an experimental design by fabricating PDMS chips and placing them inside a common 6-well culture plate through sterile techniques while the PDMS curved plates harbored hESC colonies on the top of their surface. We termed this method a plate-curving cell culture. Because cells on the curved plates were contained in regular culture plates, they were able to be cultured in common incubators indefinitely without any further setups so long as the cells themselves could permit the cell culture. Details for the fabrication of PDMS plates and the prerequisite conditions for cell culture such as the coating of extracellular matrix can be found in the Materials and Methods section.
Figure 1. Plate curving cell culture and a modeling of early human neuroepithelium in vitro. (A) A graphic representation for a culture and induction scheme for human embryonic stem cell-derived neuroepithelium (hESC-NE) (B) Graphic overview for plate curving cell culture on concave (left) and convex (right) surface. (C) ICC/IF images between human pluripotent stem cells and hESC-NE denoted as dSMADi +48hr. NANOG is a marker for undifferentiated pluripotency. SOX2 is a marker for undifferentiated neural lineage cells. N-cadherin is the key cadherin of neuroepithelium. SOX1 is a marker for neural progenitor. (D) Common epithelial features associated cytoskeletal elements in hESC-NE.
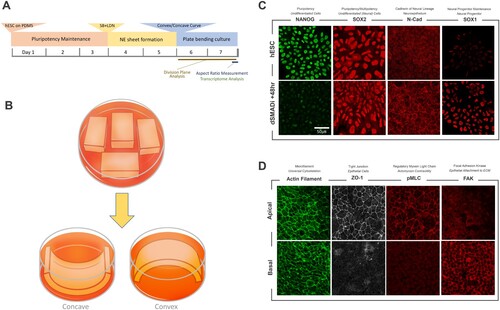
To recapitulate the early human neuroepithelium, we devised a culture scheme where a cell culture of a human embryonic stem cell (hESC) line was maintained on a flat surface before being subjected to surface curvature by plate curving along with the neural induction with dual SMAD inhibition (Chambers et al. Citation2009) and maintained for 48 h ((A)). On the flat PDMS plates, undifferentiated hESCs maintained the expressions of stemness markers and lost stem cell marker NANOG upon neural induction while they increased neural lineage markers such as N-CAD and SOX1 ((C)). After this neuroepithelial (NE) induction, hESC-NE clusters also exhibited the features of apicobasal polarization such as apical concentration of ZO1 and pMLC proteins, and the basal localization of FAK ((D)), indicating they retained the proper epithelial features where the key mechanical polarities of morphogenesis originate (Wang Citation2021). In summary, our model could recapitulate the transition of the neural plate to a curved form from a flat disc of ectoderm and display both appropriate cell identity markers and epithelial features as an in vitro model of the early neuroepithelium on curvature.
Plate curving in concave but not in convex form induces tissue-level morphological change
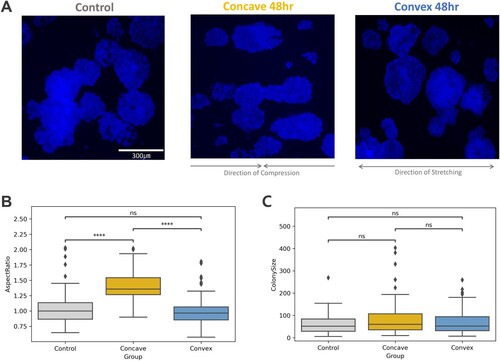
To examine how curvature would affect the tissue-level morphology of the early neuroepithelial cell sheets, we quantified the morphology of hESC-NE cell colonies cultured on top of uncurved, concave, and convex surfaces at the time of neural induction ((A)). It was revealed that when their aspect ratio was measured by fitting their outermost edges to a square, hESC-NEs subjected to a concave curve for 48 h showed a significantly different form from that of the control and this elongation was oriented along the axis of the surface curvature, the longitudinal axis of PDMS plates, while on the convex and flat surface, there was no significant change ((B)). We questioned whether the overall colony size changed in the concave surface, which might have affected the aspect ratio through differential growth, but their representative colony size measurements were not significantly altered among the groups ((C)).
Figure 2. hESC-NE after 48-hour curvature application. (A) Examples of Hoechst images for each condition, control, concave 48hr, and convex 48hr (B) A box with t-test annotation, drawn from the aspect ratio (width/height) data. (Control n = 82, Concave 48hr n = 62, Convex 48 hr n = 120) P-values from Welch’s t-test were marked with asterisks if found significant or marked as ns for non-significance. (ns: p > 0.05. *: 0.01 < p ≤ 0.05. **: 0.001 < p ≤ 0.01. ***: 0.0001 < p ≤ 0.001. ****: p ≤ 0.0001) (C) A box plots with t-test annotation, drawn from the colony size (width * height) data from the same experiment samples.
We noticed that there is a question raised about the tissue elongation in curved surfaces, on the role of cell migration and cell proliferation (Rougerie et al. Citation2020). It seemed feasible for our plate-bending cell culture to address this matter, as our experimental design inevitably involved an element of external force known to orient cell division angles.
Oriented division is not a prevalent factor for tissue-level morphological change in curvature
We predicted that in our plate-curving cell culture, it was feasible to appreciate the relative impact of oriented cell division, as our experimental design inevitably included the factor of compression and stretching as the cell colonies were curved after the epithelium was established on a flat surface. While the surface length on which the hESC-NE cells lay at the time of cell seeding and pluripotency maintenance was the same length as the neutral axis of the PDMS plate, when their substrate plate was curved, the cell sheets themselves were also bent and deformed. Then the cell culture will be either compressed in the concave surface or stretched with the convex curve, whose magnitude of deformation will be dependent on the thickness of the plate ((A)). Oriented division upon external stress is a well-defined characteristic of epithelial cells (Aw et al. Citation2016; Hart et al. Citation2017), and we developed a measurement system to quantify the division angle from the stained mitotic nuclei ((B)). We demonstrated that hESC-NE cells indeed underwent oriented division after 45 min of plate curving cell culture in either concave-compression or convex-stretching form and by modifying the thickness of the PDMS plate by 3.5, 4.5, and 5.5 mm, the division angles were dose-dependently oriented along the thickness of the plate ((C–E)). This was how early in vivo neural ectodermal cells would behave upon external stress (Scarpa et al. Citation2018; Sausedo et al. Citation1997), and oriented division along the direction of stress in stretching was demonstrated from previous studies of epithelial cells (Hart et al. Citation2017) while perpendicular division in compression could be inferred from the direction of stress in compression. This also demonstrated that plate-bending cell culture could exert external stress as intended when the culture started from a flat surface.
Figure 3. Division angle characterization of hESC-NE on plate curving cell culture. (A) A schematic for estimating strain magnitude for plate curving. (B) An example of semi-automated division angle measurement from a Hoechst image. (C) The angular distribution of the uncurved hESC-NE. (D) The angular distributions of hESC-NE on concave surface, applied with differing compression magnitudes derived from the plate thickness of 3.5 mm (n = 595), 4.5 mm (n = 867), and 5.5 mm (n = 506), respectively. (E) The angular distributions of hESC-NE on convex surface, applied with differing stretching magnitudes derived from the plate thickness of 3.5 mm (n = 735), 4.5 mm (n = 974), and 5.5 mm (n = 240), respectively. (F) A violin plot of hESC-NE on curvature at different temporal exposure, placed under concave or convex surface, with KS test annotation compared from uncurved control. (Control_temporal n = 418, Stretch 15 min n = 572, Stretch 45min_temporal n = 697, Stretch 75 min n = 630, Stretch 24hr n = 411, Stretch 48hr n = 505, Comp 45min_temporal n = 488, Comp 24hr n = 411, Comp 48hr n = 629), with the testing of each group by two-sample Kolmogorov-Smirnov test for their statistically significant difference. P-values from K-S test were marked with asterisks if found significant or marked as ns for non-significance. (ns: p > 0.05. *: 0.01 < p ≤ 0.05. **: 0.001 < p ≤ 0.01. ***: 0.0001 < p ≤ 0.001. ****: p ≤ 0.0001).
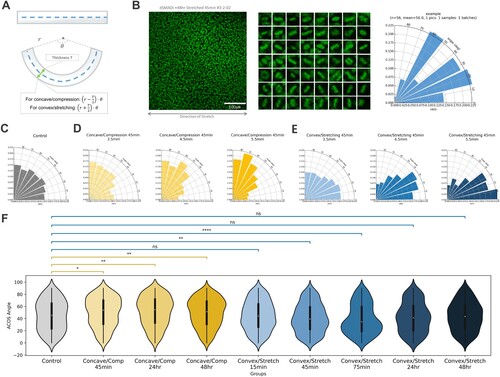
We noticed that the direction of oriented division in the concavity-compression group was perpendicular to the axis of tissue elongation. If this oriented division continues in this manner even after the 48 h of applying curvature, we could decide that curvature was not at least a prevalent factor of tissue-level curvature-induced morphological change. Indeed, this was what we found to be true when we examined the division angles in 24 and 48 h of exerting concavity-compression ((F)). Remarkably, even after 48 h, cells under convexity-compression continued to undergo oriented division perpendicular to the direction of the stress, whose division angle was, in turn, orthogonal to the direction of colony elongation, unlike the convexity-stretching group whose oriented division started to regress to a uniform distribution like the control after 24 h, a feasible behavior for external stretching as the oriented division was suggested as a mechanism for relieving tensile stress in some developmental contexts (Campinho et al. Citation2013). If concave curvature-induced colony elongation was more dominantly influenced by continued oriented division, the colony elongation seen in would have been impossible, and this led us to conclude that oriented division was at least not a major factor for colony elongation caused by concave curvature.
Transcriptome analysis of hESC-NE after 24-hour curvature application
To discover associated biological pathways that might drive the tissue-level morphological change, as well as the curvature’s broad effect in its metabolism and cell fate determination, as seen in both neural (Yuen et al. Citation2023) and other lineages (Swanson et al. Citation2022; Yang et al. Citation2022), we performed bulk RNA-seq analysis on hESC-NE with 24-h curvature application to reveal the first transcriptomic change upon curvature application.
To extract differentially expressed genes (DEGs) in each curvature group, we defined DEGs for all combinations of comparison between experiment groups as genes that passed the p-value threshold of < 0.005 and log2 fold change value over 0.5 or under −0.5 in each gene-wise comparison and the DEGs from all groups normalized against the same gene in other groups were collectively displayed as a heatmap ((A)). From the hierarchical clustering of its dendrogram, it was observed that each experiment group was well separated, generally regarded as a positive sign of differential expression between the experiment groups.
Figure 4. Bioinformatic analyses of RNA-seq data from 24-hour curvature exposure on hESC-NE. (A) A heatmap representation for DEGs selected from all two-member combination of the three experiment groups, control, concave 24hr, and convex 24hr. Any genes passed threshold of Welch’s t-test p-value < 0.005 and |Log2FC| > 0.5 were included in the heatmap, along with hierarchical clustering. (B) A volcano plot for the comparison group between the control and the convex group. Genes that passed Welch’s t-test p-value < 0.005 and |Log2FC| > 0.5 were annotated for their gene symbol. (C) Linear separation plots from perceptron-without-weight analysis. Three only genes, either protein-coding or long non-coding RNA, were presented. y=1 represents the concave group and y=0 the control. (D) Over-representation analysis with Enrichr was conducted on the possibly co-regulated genes with the three genes, BIK, CABS1, and LINC02205, extracted by selecting genes exceeding Pearson’s r of 0.8 and its p-value under 0.001. Biological pathways that passed threshold of false discovery rate (FDR) < 0.2 were displayed in a dot plot, where the color represents its p-value and the size of dot signifies its ratio in the given genes of interest. (E) A dot plot summary of GSEA performed between the concave (positive) and the uncurved control, where each gene set is listed from up to bottom, from the lowest normative p-value to the highest. Each graphic ball whose size represents the ratio of the genes in the gene set, is positioned from left to right according to their normalized enrichment scores (NES), where positive NES notes enrichment in the stretching group and negative NESs indicates enrichment in the compression group. The absolute value of the NES shows the magnitude of enrichment from Gene Ontology. (F) Examples of significant GSEA results associated with energy metabolism from Gene Ontology. (G) Examples of significant GSEA results associated with morphogenetic processes from the comparison between the concave (positive) and convex (negative) group from MSigdb.
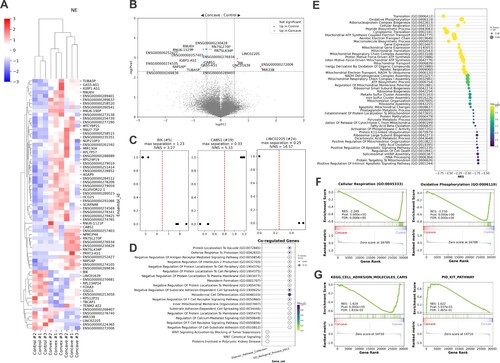
Then we focused on the comparison between the concave and the control groups, in which tissue-level elongation was observed in our previous result. A handful of genes were determined to be DEGs if they passed the threshold of Welch's t-test p-value < 0.005 and |Log2FC| > 0.5 ((B), Supplementary Table 1A). We also trained a vertical perceptron model with the concave and control groups, analytics of our own making where each gene was measured for their ‘vertically linear’ separation, with consideration of the intra-group variance as described in Materials and Methods, as an alternate approach for strict, maximal filtering of significant DEGs ((C), Supplementary Table 1B). From the intersection of the two lists of DEGs performed to filter significant DEGs with maximal margin, we identified 15 genes of interest (Supplementary Table 1C), and we selected three genes, BIK, CABS1, and LINC02205, for being either protein-coding genes or a long non-coding RNA as the rest were the transcripts of pseudogenes. To reveal a set of genes possibly co-regulated with these most significant DEGs, we performed transcriptome-wide Pearson’s r correlation test with BIK, CABS1, and LINC02205, and defined co-regulation as Pearson’s r reaching over 0.8 and its p-value being less than 0.001, which yielded a list of 31 genes (Supplementary Table 2). These co-regulated genes with BIK, CABS1, and LINC02205 were subjected to over-representation analysis (ORA) to reveal their presumptive collective influence on biological pathways (D). The interpretation of these results is described in the Discussion section.
We further analyzed the RNA-seq data through gene set enrichment analysis (GSEA) for more sensitive, threshold-free analysis of the transcriptome data (Subramanian et al. Citation2005). We used the Gene Ontology database (Ashburner et al. Citation2000; Gene Ontology et al. Citation2023) for a pre-ranked GSEA analysis between the concave and control groups and observed that several biological pathways passed the threshold of false discovery rate (FDR) < 0.05 ((E)). We noticed that energy metabolism pathways were downregulated in the concave group ((F)). Transition to lower energy metabolic activity is known in the context of embryonic development, especially when pluripotent stem cells lose their pluripotency (Miyazawa and Aulehla Citation2018; Tsogtbaatar et al. Citation2020). Both the control and concave groups were equally treated with the neural induction material, and thus, despite distinct cell differentiation was yet to be detected in the GSEA analysis of RNA sequencing data, the early in vitro neuroepithelium on a concave surface might be more primed in its progression toward a more differentiated state. This result further supports the possibility that curvature itself has a role in the differentiation process of the early neuroepithelium. In another comparison made with MSigdb (Liberzon et al. Citation2015), we were hinted at the pathways that might have influenced the differential morphological processes between the concave and convex groups ((G)). In the elongated concave group, cell adhesion molecules were downregulated compared to the convex group, and the same proposition was made on the differential effectiveness of cell migration between the concave and the convex groups, as having less cell adhesion is likely to facilitate cell movement (Werner et al. Citation2017; Schamberger et al. Citation2023). Also, the KIT pathway, which was reported to implement self-organization in epithelial patterning during development (Liberzon et al. Citation2015), was upregulated in the concave group, which might further help to explain why two types of curvature expressed different morphogenetic behaviors.
Discussion
To provide a morphologically correct in vitro model of early neuroepithelium, we developed a new culture method called plate-curving cell culture. With it, we replicated what is known to be true about curvature and tissue-level morphology, showed that oriented division might not be the direct cause of tissue elongation at concave surfaces, and suggested clues from gene expression data that will help to understand how the mechanobiology of curvature shapes the chemical–mechanical patterning and the tube morphogenesis during neurulation. Our work will provide yet another evidence for the importance of curvature on embryonic development and neural tube formation.
Regarding the different tissue-level behavior between hESC-NE on a concave and convex surface, it is reported that cells behave differently in concave and convex surfaces (Werner et al. Citation2017; Citation2018) and topographical curvature is known to elongate the tissue on it (Rougerie et al. Citation2020). It is also known that other types of cells such as fibroblast and mesenchymal stromal cells increase their speed of migration upon concave curvature but not in convex or flat surface (Park et al. Citation2009; Werner et al. Citation2017). Our result is in line with these previous results and demonstrates that plate-curving cell culture can act as a model for curvature in biological systems albeit its simplicity. We note that in our result only the cells on global concave curvature showed altered tissue-level morphology, which might suggest that in the in vivo neuroepithelium, which is placed on a concave surface as the neurulation progresses, there would be expansion of the neural plate to a lateral axis, which could have a pronounced effect in the neural fold formation.
This led us to hypothesize that this curvature-induced lateral growth might have a role in the folding of the neural plate. The tissue elongation along the lateral axis, or the future dorsoventral (DV) axis after the neural tube closure, is likely to cause cell packing along the axis if it takes place in a confined geometry. This will lead to eventual buckling due to cell compression from the tissue growth in a limited space, as suggested in some references (McShane et al. Citation2015; Wang Citation2021). Given that the concave curvature is initiated most probably by apical constriction, the resultant small curvature will cause tissue-level elongation along the lateral axis and because of it, denser cell packing would be caused. Then the early neuroepithelium would be placed on top of a more concave surface, which will ultimately initiate the positive feedback that would eventually cause buckling along the lateral axis and the creation of a fold. This will ensure that the neural plate forms a groove, and it would provide the basis for the following steps of neurulation, such as hinge point formation which is clearly caused by the chemical patterning from the nearby surface ectoderm (Karzbrun et al. Citation2021), to complete the neural tube closure. If geometric constraints could be integrated into the plate curving cell culture through micropatterning on a ‘flexible substrate’ that would allow the actual bending of the cell sheets, the details of neural groove formation will be further elucidated.
As for oriented division, which is a plausible factor to orient the colony elongation in its division axis, it did not seemingly influence the colony morphology dominantly because the division angle was perpendicular to the orientation of colony size expansion. It is also worth mentioning that, as our experimental procedure had to involve un-curving of the plates for tissue fixation and immunostaining, which might have left experimental artifact on the division axis, though its prominence would be far less significant within 48 h of surface curvature. Further experiments with live imaging will clarify this and related issues in the future.
For the transcriptome comparisons of long-term cultured hESC-NE, we found several genes, especially CABS1 and BIK, whose expressions were significantly affected by the curvatures. These genes are previously unreported genes in the context of morphogenesis in the early neuroepithelium, but CABS1 encodes for a calcium-binding protein predicted to be involved in the motility and proper development of sperm (Kawashima et al. Citation2009; Zhang et al. Citation2021) and its expression was significantly upregulated in the concave group, which might suggest that a novel role of the gene in the curvature-induced morphological change, possibly involving motile cilia. In addition, the protein encoded by the BIK gene is involved in proapoptotic pathways and it was significantly downregulated in the concave group, which might have some repercussions on the development of the early neuroepithelium under concave curvature as cell death/survival is one of the important factors in embryonic development.
We also note that in the analysis of co-regulated genes with the three most significant genes, BIK, CABS1, and LINC02205, we found the enrichment of biological pathways such as the negative regulation of protein localization to the cell periphery and substrate adhesion-dependent cell spreading. These results might make sense for the differential expression in the concave group, of CABS1, involving motile cilium and of BIK affecting cell survival/cell death. The functions of these protein localization and substrate adhesion-dependent cell spreading pathways are also in line with the known behavior of the cell placed on a curved surface (Rougerie et al. Citation2020; Schamberger et al. Citation2023). Moreover, signaling pathways of developmental patterning such as the WNT signaling pathway was detected in the analysis, and it could imply that curvature in the neuroepithelium might influence the chemical–mechanical patterning of the early neuroepithelium. It was notable that FGF20 transcripts were only present in the concave hESC-NE group in our RNA-seq data (Supplementary Material), and its transcription is known to sign the cell’s targeting by the WNT signaling pathway (Chamorro et al. Citation2005). The analysis of co-regulation candidate genes with the most significant DEGs in the curved early neuroepithelium seems to suggest both morphogenetic process and cell fate patterning.
Finally, we would also like to note that physical factors are receiving attention from various fields of biology (Mammoto et al. Citation2012; Piccolo et al. Citation2022; Zhou et al. Citation2022), and especially in developmental biology, where not only secreted factors and cell–cell contacts, but also various mechanical signals themselves have been revealed to influence the ultimate developmental design (Sarig et al. Citation2018; Alvarez and Smutny Citation2022; Qiu et al. Citation2023). However, many of the tools that brought forth recent discoveries were carried out with custom-made, highly specialized machinery. Our plate-curving cell culture only requires commonly available laboratory materials, and as we demonstrated to modify external stress with different thicknesses of the plates, other physical properties unexplored in this paper, such as substrate stiffness and geometric confinement through micro-patterning of ECM coating or PDMS fabrication for local patterns. Plate-curving cell culture also supports massive batches of experiments as several samples can be simultaneously loaded on a single culture plate. We expect that its innate simplicity and availability will provide an optimal method for exploring the feasibility of a serious scientific endeavor in the mechanobiology of curvature.
Materials and methods
Plate-curving cell culture with polydimethylsiloxane (PDMS)
To cast polydimethylsiloxane (PDMS) plates, 10 units of SYLGARD™ 184 Silicone Elastomer A were poured into a weighing dish and 1 unit of SYLGARD™ 184 Silicone Elastomer B was mixed with compound A using a sterile instrument. In this work, the mixture was placed on a sterile 100 × 100 square petri dish with a grid and weighed for 45−75 g to achieve a thickness of 3.5–5.5 mm for the resultant PDMS plates. Then the mixture was vacuum-pressurized with the lid open for around 30 min until all the bubbles were removed and cured at 65°C for 16 h. When the PDMS was fully consolidated, the PDMS disc was cut into individual plates (38 × 19 × 3.5–5.5 mm). These PDMS plates were either autoclaved or treated with 70% ethanol for sterilization for cell culture.
Human embryonic stem cell culture conditions and neuroepithelial differentiation
Human embryonic stem cell line H9 was used throughout the experiments if not otherwise mentioned. For live-cell time-lapse imaging, a human induced pluripotent stem cell line with H2B-GFP was used. These cell lines were maintained with mTeSR1™ media (Stem Cell Technologies, Canada) on a culture-treated 6-well plate coated with Corning® Matrigel® Growth Factor Reduced (GFR) Basement Membrane Matrix (Corning, USA), and passaged with ReLeSR™ (Stem Cell Technologies, Canada) before cells became confluent, in compliance with the procedures described in the manufacturer’s technical manual of mTeSR1™, MA29106.
For the seeding of the H9 cells on the PDMS plates, diluted Matrigel of 1:100 was loaded on the plate at 4°C for at least 8 h and subsequently incubated for 1 h at 37°C. After the coating, ReLeSR-dissociated cells aliquoted to reach full confluency at day 6 of the new subculture were placed on the PDMS and cultured for 3 additional days with mTeSR1 media. To induce the neuroepithelium-like cell colonies, the dual SMAD inhibition (dSMADi) protocol (Chambers et al. Citation2009) was used, treating cells with N2B27 media containing 10 μM of SB431542 and 0.1 μM of LDN.
Immunocytochemistry/immunofluorescence (ICC/IF)
For the ICC/IF, cells were fixed with 4% paraformaldehyde for 20 min immediately after the experiment and the sample was washed with PBS three times. If needed, fixed samples were stored in a sterile dish with autoclaved PBS. Next, the fixed samples were incubated with a blocking solution consisting of 5% bovine serum albumin (BSA) and 0.1% Triton X-100 in 1× PBS for 15 min at room temperature (RT). Then, the primary antibodies with appropriate titer were added for 2 h at RT. After several times of rinsing, the samples were incubated with secondary antibodies for 30 min. Finally, the samples were thoroughly washed, mounted, and examined under the microscope. For the complete list of antibodies and fluorescence used in this paper, please refer to .
Table 1. The list of antibodies, secondary antibodies used in this work.
Confocal microscopy, light microscopy, and live imaging
Leica TCS SP8 Confocal Microscope was used for fluorescent microscopy of the PDMS plate samples processed with ICC/IF. For the measurement of the division angle, 25× magnification was used. For the visualization of cytoskeletal components, 63x or 100x magnification was used. Otherwise noted, all cell nuclei images are Z-stacked images, while cytoskeletal and cell junctional images were single or shallow Z-stack images of two or three pictures. A custom Python-based script was used to produce their projected images (GitHub). Note that every time a strained nuclear image was observed, only 15% of the total width of the plate from the midline was taken from left and right, as the actual local strain gradient exerted on the surface is expected to be confined to the middle portion of the plate. The EVOS™ M5000 Imaging System was used for microscopy under lower magnification. Overall cell colony size was measured from the images acquired from this device if not otherwise noted. The Olympus IX83 Live Imaging Microscope was used for the live-cell time-lapse imaging. For the imaging of H2B-GFP cells, fluorescent images were taken at the rate of two frames per second for 90 min. The cells were placed under a miniature incubator, keeping temperature, moisture, and CO2 levels suitable for cell culture.
Semi-automated division angle measurement and data visualization
A Python script was coded for the rapid measurement of cell division angle and the determination of the cell cycle phase (https://github.com/BroMynn/Plate-Bending-Cell-Culture). The semi-automated cell division angle measurement system took only minimal user inputs, for example, the designation of two points of the major axis of dividing cells with each click of a mouse button, and the classification of their cell cycle with a single keyboard input. Based on the nuclear/chromosome morphology, distinct cell cycle phases, the prometaphase, the metaphase, the anaphase, and the telophase were recognized, and only cells inarguably recognizable in their division plane were included in the count.
For the visualization of the experiment data, a custom Python-based script was used, using open-source libraries such as Matplotlib, StatAnnot, and Seaborn. Throughout this paper, angular distribution plots had seven bins with equal spacing (90–77.14–64.28–51.42–38.57–25.71–12.85–0), and the direction of external force was always marked 0°.
RNA extraction and RNA sequencing
RNA was extracted from tissue using the mirVana™ miRNA Isolation Kit (ThermoFisher) according to the manufacturer's recommended procedures. After total RNA purification, the sample was treated with DNase using a DNA-Free kit (Ambion) to eliminate potential DNA contamination that could have interfered with the result interpretation.
RNA purity was determined by assaying 1 µl of the total RNA extract on a NanoDrop8000spectrophotometer. Total RNA integrity was checked using an Agilent Technologies 2100 Bioanalyzer with an RNA Integrity Number (RIN) value.
mRNA sequencing libraries were prepared according to the manufacturer’s instructions (Illumina Truseq stranded mRNA library prep kit). mRNA was purified and fragmented from total RNA (1µg) using poly-T oligo-attached magnetic beads using two rounds of purification. Cleaved RNA fragments primed with random hexamers were reverse transcribed into first-strand cDNA using reverse transcriptase, random primers, and dUTP in place of dTTP. These cDNA fragments then had the addition of a single ‘A’ base and subsequent ligation of the adapter. The products were purified and enriched with PCR to create the final strand-specific cDNA library.
The quality of the amplified libraries was verified by automated electrophoresis (Tapestation, Agilent). After qPCR using the KAPA SYBR FAST qPCR Master Mix (Kapa Biosystems), we combined libraries that index tagged in equimolar amounts in the pool. RNA sequencing is performed using an Illumina NovaSeq 6000 system following provided protocols for 2×100 sequencing.
RNA-seq alignment, RNA-seq normalization, differentially expressed genes extraction, perceptron-without-weight, co-regulated gene expression with correlation, over-expression analysis with Enrichr and gene set enrichment analysis
To preprocess RNA-seq data, HISAT2 (Kim et al. Citation2019) was used to align mRNA reads to the human reference genome GRCh38.109 and featureCounts (Liao et al. Citation2014) were used to count the reads. Transcript-per-million (TPM) was used to normalize the RNA read counts across the samples. The raw Fastq and raw read count files are deposited in the GEO Accession Number of GSE247786.
The methods in Python implementation of differentially expressed genes extraction based on Welch’s t-test and fold change, perceptron-without-weight, and correlation are available on the first author’s GitHub page (https://github.com/BroMynn/Plate-Bending-Cell-Culture), along with the visualization in heatmap, volcano plot, and linear separation plot. Over-expression analysis was performed on these DEGs with Enrichr (Chen et al. Citation2013) against biological pathways gene sets such as Reactome (Gillespie et al. Citation2022), KEGG (Kanehisa and Goto Citation2000), Elsevier Pathway Collections, and Gene Ontology (Ashburner et al. Citation2000; Gene Ontology et al. Citation2023)
Perceptron-without-weight is first introduced in this work as an alternative way for DEG extraction. It aims to separate gene expression values from one gene between two groups with a linear expression without weight, thus the name perceptron-without-weight, and try to find the optimal threshold where the maximal separation between the end/first element from each group occurs, a manner reminiscent of support vector machine and perceptron. Maximal separation is defined as the distance of the first elements of each label proximal to the threshold. This enables to measure the ‘safety’ of separation between the groups where 100% vertical linear separation is possible, and with the additional help of intra-group variance normalized score (IVNS), which is maximal separation divided by the average of each group’s standard deviation, genes with maximum separation can be extracted.
Gene set enrichment analysis (GSEA) (Subramanian et al. Citation2005) was used to perform pathway analysis and GSEApy (Fang et al. Citation2023) (version 1.0.4) was used for the Python implementation and visualization of GSEA results. GSEA was performed with the parameter of 5000 permutations on the curated gene sets derived from MSigdb (Liberzon et al. Citation2015), KEGG (Kanehisa and Goto Citation2000), and Reactome (Gillespie et al. Citation2022) to be used in embryonic developmental context, which is also available at the above GitHub page. A custom ranking metric, where the log2 fold change values for each gene were multiplied by the corresponding ‘circular function’ of Welch’s t-test p-value, which was calculated as 1-SQRT(1-(p-1)2) was used for pre-ranked GSEA.
Supplemental Material
Download MS Excel (877.5 KB)Disclosure statement
No potential conflict of interest was reported by the author(s).
Additional information
Funding
References
- Abdel Fattah AR, Daza B, Rustandi G, Berrocal-Rubio MA, Gorissen B, Poovathingal S, Davie K, Barrasa-Fano J, Condor M, Cao X, et al. 2021. Actuation enhances patterning in human neural tube organoids. Nat Commun. 12(1):3192. doi:10.1038/s41467-021-22952-0.
- Alvarez Y, Smutny M. 2022. The emerging role of mechanical forces in cell fate acquisition. Front Cell Dev Biol. 10:864522. doi:10.3389/fcell.2022.864522.
- Ashburner M, Ball CA, Blake JA, Botstein D, Butler H, Cherry JM, Davis AP, Dolinski K, Dwight SS, Eppig JT, et al. 2000. Gene ontology: a tool for the unification of biology. The Gene Ontology Consortium. Nat Genet. 25(1):25–29.
- Avagliano L, Massa V, George TM, Qureshy S, Bulfamante GP, Finnell RH. 2019. Overview on neural tube defects: from development to physical characteristics. Birth Defects Res. 111(19):1455–1467. doi:10.1002/bdr2.1380.
- Aw WY, Heck BW, Joyce B, Devenport D. 2016. Transient tissue-scale deformation coordinates alignment of planar cell polarity junctions in the mammalian skin. Curr Biol. 26(16):2090–2100. doi:10.1016/j.cub.2016.06.030.
- Callens SJP, Uyttendaele RJC, Fratila-Apachitei LE, Zadpoor AA. 2020. Substrate curvature as a cue to guide spatiotemporal cell and tissue organization. Biomaterials. 232:119739. doi:10.1016/j.biomaterials.2019.119739.
- Campinho P, Behrndt M, Ranft J, Risler T, Minc N, Heisenberg CP. 2013. Tension-oriented cell divisions limit anisotropic tissue tension in epithelial spreading during zebrafish epiboly. Nat Cell Biol. 15(12):1405–1414. doi:10.1038/ncb2869.
- Chambers SM, Fasano CA, Papapetrou EP, Tomishima M, Sadelain M, Studer L. 2009. Highly efficient neural conversion of human ES and iPS cells by dual inhibition of SMAD signaling. Nat Biotechnol. 27(3):275–280. doi:10.1038/nbt.1529.
- Chamorro MN, Schwartz DR, Vonica A, Brivanlou AH, Cho KR, Varmus HE. 2005. FGF-20 and DKK1 are transcriptional targets of β-catenin and FGF-20 is implicated in cancer and development. EMBO J. 24(1):73–84. doi:10.1038/sj.emboj.7600460.
- Chen EY, Tan CM, Kou Y, Duan Q, Wang Z, Meirelles GV, Clark NR, Ma'ayan A. 2013. Enrichr: interactive and collaborative HTML5 gene list enrichment analysis tool. BMC Bioinform. 14:128. doi:10.1186/1471-2105-14-128.
- Fang Z, Liu X, Peltz G. 2023. GSEApy: a comprehensive package for performing gene set enrichment analysis in Python. Bioinformatics. 39:1. doi:10.1093/bioinformatics/btac757.
- Gene Ontology C, Aleksander SA, Balhoff J, Carbon S, Cherry JM, Drabkin HJ, Ebert D, Feuermann M, Gaudet P, Harris LN, et al. 2023. The Gene Ontology knowledgebase in 2023. Genetics. 224:1.
- Gillespie M, Jassal B, Stephan R, Milacic M, Rothfels K, Senff-Ribeiro A, Griss J, Sevilla C, Matthews L, Gong C, et al. 2022. The reactome pathway knowledgebase 2022. Nucleic Acids Res. 50(D1):D687–D692. doi:10.1093/nar/gkab1028.
- Hart KC, Tan J, Siemers KA, Sim JY, Pruitt BL, Nelson WJ, Gloerich M. 2017. E-cadherin and LGN align epithelial cell divisions with tissue tension independently of cell shape. Proc Natl Acad Sci U S A. 114(29):E5845–E5853.
- Kanehisa M, Goto S. 2000. KEGG: Kyoto encyclopedia of genes and genomes. Nucleic Acids Res. 28(1):27–30. doi:10.1093/nar/28.1.27.
- Karzbrun E, Khankhel AH, Megale HC, Glasauer SMK, Wyle Y, Britton G, Warmflash A, Kosik KS, Siggia ED, Shraiman BI, et al. 2021. Human neural tube morphogenesis in vitro by geometric constraints. Nature. 599(7884):268–272. doi:10.1038/s41586-021-04026-9.
- Kawashima A, Osman BAH, Takashima M, Kikuchi A, Kohchi S, Satoh E, Tamba M, Matsuda M, Okamura N. 2009. Cabs1 Is a novel calcium-binding protein specifically expressed in elongate spermatids of Mice1. Biol Reprod. 80(6):1293–1304. doi:10.1095/biolreprod.108.073866.
- Kim D, Paggi JM, Park C, Bennett C, Salzberg SL. 2019. Graph-based genome alignment and genotyping with HISAT2 and HISAT-genotype. Nat Biotechnol. 37(8):907–915. doi:10.1038/s41587-019-0201-4.
- Liao Y, Smyth GK, Shi W. 2014. featureCounts: an efficient general purpose program for assigning sequence reads to genomic features. Bioinformatics. 30(7):923–930. doi:10.1093/bioinformatics/btt656.
- Liberzon A, Birger C, Thorvaldsdottir H, Ghandi M, Mesirov JP, Tamayo P. 2015. The Molecular Signatures Database (MSigDB) hallmark gene set collection. Cell Syst. 1(6):417–425. doi:10.1016/j.cels.2015.12.004.
- Mammoto A, Mammoto T, Ingber DE. 2012. Mechanosensitive mechanisms in transcriptional regulation. J Cell Sci. 125(Pt 13):3061–3073.
- McShane SG, Mole MA, Savery D, Greene ND, Tam PP, Copp AJ. 2015. Cellular basis of neuroepithelial bending during mouse spinal neural tube closure. Dev Biol. 404(2):113–124. doi:10.1016/j.ydbio.2015.06.003.
- Miyazawa H, Aulehla A. 2018. Revisiting the role of metabolism during development. Development. 145:19. doi:10.1242/dev.131110.
- Nikolopoulou E, Galea GL, Rolo A, Greene ND, Copp AJ. 2017. Neural tube closure: cellular, molecular and biomechanical mechanisms. Development. 144(4):552–566. doi:10.1242/dev.145904.
- Nishimura T, Honda H, Takeichi M. 2012. Planar cell polarity links axes of spatial dynamics in neural-tube closure. Cell. 149(5):1084–1097. doi:10.1016/j.cell.2012.04.021.
- Park JY, Lee DH, Lee EJ, Lee S-H. 2009. Study of cellular behaviors on concave and convex microstructures fabricated from elastic PDMS membranes. Lab Chip. 9(14):2043–2049. doi:10.1039/b820955c.
- Piccolo S, Sladitschek-Martens HL, Cordenonsi M. 2022. Mechanosignaling in vertebrate development. Dev Biol. 488:54–67. doi:10.1016/j.ydbio.2022.05.005.
- Qiu X, Deng Z, Wang M, Feng Y, Bi L, Li L. 2023. Piezo protein determines stem cell fate by transmitting mechanical signals. Hum Cell. 36(2):540–553. doi:10.1007/s13577-022-00853-8.
- Rougerie P, Pieuchot L, dos Santos RS, Marteau J, Bigerelle M, Chauvy P-F, Farina M, Anselme K. 2020. Topographical curvature is sufficient to control epithelium elongation. Sci Rep. 10(1):14784. doi:10.1038/s41598-020-70907-0.
- Sarig U, Sarig H, Gora A, Krishnamoorthi MK, Au-Yeung GCT, de-Berardinis E, Chaw SY, Mhaisalkar P, Bogireddi H, Ramakrishna S, et al. 2018. Biological and mechanical interplay at the macro- and microscales modulates the cell-niche fate. Sci Rep. 8(1):3937. doi:10.1038/s41598-018-21860-6.
- Sausedo RA, Smith JL, Schoenwolf GC. 1997. Role of nonrandomly oriented cell division in shaping and bending of the neural plate. J Comp Neurol. 381(4):473–488. doi:10.1002/(SICI)1096-9861(19970519)381:4<473::AID-CNE7>3.0.CO;2-#.
- Scarpa E, Finet C, Blanchard GB, Sanson B. 2018. Actomyosin-Driven Tension at Compartmental Boundaries Orients Cell Division Independently of Cell Geometry In Vivo. Dev Cel. 47(6):727–740. doi: 10.1016/j.devcel.2018.10.029.
- Schamberger B, Ziege R, Anselme K, Ben Amar M, Bykowski M, Castro APG, Cipitria A, Coles RA, Dimova R, Eder M, et al. 2023. Curvature in biological systems: its quantification, emergence, and implications across the scales. Adv Mater. 35(13):e2206110. doi:10.1002/adma.202206110.
- Sokol SY. 2016. Mechanotransduction during vertebrate neurulation. Curr Top Dev Biol. 117:359–376. doi:10.1016/bs.ctdb.2015.11.036.
- Subramanian A, Tamayo P, Mootha VK, Mukherjee S, Ebert BL, Gillette MA, Paulovich A, Pomeroy SL, Golub TR, Lander ES, et al. 2005. Gene set enrichment analysis: a knowledge-based approach for interpreting genome-wide expression profiles. Proc Natl Acad Sci U S A. 102(43):15545–15550. doi:10.1073/pnas.0506580102.
- Swanson WB, Omi M, Woodbury SM, Douglas LM, Eberle M, Ma PX, Hatch NE, Mishina Y. 2022. Scaffold pore curvature influences ΜSC fate through differential cellular organization and YAP/TAZ activity. Int J Mol Sci. 23(9):4499. doi:10.3390/ijms23094499.
- Tsogtbaatar E, Landin C, Minter-Dykhouse K, Folmes CDL. 2020. Energy metabolism regulates stem cell pluripotency. Front Cell Dev Biol. 8:87. doi:10.3389/fcell.2020.00087.
- Vijayraghavan DS, Davidson LA. 2017. Mechanics of neurulation: from classical to current perspectives on the physical mechanics that shape, fold, and form the neural tube. Birth Defects Res. 109(2):153–168. doi:10.1002/bdra.23557.
- Wang YC. 2021. The origin and the mechanism of mechanical polarity during epithelial folding. Semin Cell Dev Biol. 120:94–107. doi:10.1016/j.semcdb.2021.05.027.
- Werner M, Blanquer SB, Haimi SP, Korus G, Dunlop JW, Duda GN, Grijpma DW, Petersen A. 2017. Surface curvature differentially regulates stem cell migration and differentiation via altered attachment morphology and nuclear deformation. Adv Sci. 4(2):1600347.
- Werner M, Kurniawan NA, Korus G, Bouten CVC, Petersen A. 2018. Mesoscale substrate curvature overrules nanoscale contact guidance to direct bone marrow stromal cell migration. J R Soc Interface. 15(145):20180162. doi:10.1098/rsif.2018.0162.
- Yang Y, Xu T, Bei HP, Zhang L, Tang CY, Zhang M, Xu C, Bian L, Yeung KW, Fuh JYH, et al. 2022. Gaussian curvature-driven direction of cell fate toward osteogenesis with triply periodic minimal surface scaffolds. Proc Natl Acad Sci U S A. 119(41):e2206684119. doi:10.1073/pnas.2206684119.
- Yuen HY, Yip WS, To S, Zhao X. 2023. Microcurvature landscapes induce neural stem cell polarity and enhance neural differentiation. Bio-Design Manufact. 6(5):522–535. doi:10.1007/s42242-023-00243-5.
- Zaganjor I, Sekkarie A, Tsang BL, Williams J, Razzaghi H, Mulinare J, Sniezek JE, Cannon MJ, Rosenthal J. 2016. Describing the prevalence of neural tube defects worldwide: a systematic literature review. PLoS One. 11(4):e0151586. doi:10.1371/journal.pone.0151586.
- Zhang X, Zhou W, Zhang P, Gao F, Zhao X, Shum WW, Zeng X. 2021. Cabs1 maintains structural integrity of mouse sperm flagella during epididymal transit of sperm. Int J Mol Sci. 22:2.
- Zhou H, Wang M, Zhang Y, Su Q, Xie Z, Chen X, Yan R, Li P, Li T, Qin X, et al. 2022. Functions and clinical significance of mechanical tumor microenvironment: cancer cell sensing, mechanobiology and metastasis. Cancer Commun. 42(5):374–400.