
ABSTRACT
Ultrasonic and digital dermatoscopy diagnostic methods are used in order to estimate the changes of structure, as well as to non-invasively measure the changes of parameters of lesions of human tissue. These days, it is very actual to perform the quantitative analysis of medical data, which allows to achieve the reliable early-stage diagnosis of lesions and help to save more lives. The proposed automatic statistical post-processing method based on integration of ultrasonic and digital dermatoscopy measurements is intended to estimate the parameters of malignant tumours, measure spatial dimensions (e.g. thickness) and shape, and perform faster diagnostics by increasing the accuracy of tumours differentiation. It leads to optimization of time-consuming analysis procedures of medical images and could be used as a reliable decision support tool in the field of dermatology.
1. Introduction
The number of incidences of skin melanoma had grown up faster over the last three decades, avoiding exclusion to different age groups. Looking at the statistics of melanoma cases, the rate per period 2005–2014 has increased by 3% per year in the group of men and women who are 50 years old and older but had stabilized among those younger than age 50. Even though melanoma is diagnosed for only about 1% of skin cancers, it leads to the majority of skin cancer deaths [Citation1]. This trend is mainly caused because of genetics, environmental factors, and other addictions [Citation2–Citation4].
The purposes of exploration of the lesion parameters of human tissue are to have a faster diagnosis, informative prediction of the illness, also to reduce the cost of possible treatment, and to save as much lives as it is feasible. The main task is to find the way which leads to accurate diagnostics. First signs of the dermatoscopy appeared in 1948 and a Spitz nevus was introduced as ‘melanoma of childhood’ due to the potentiality of the technologies and histopathologic features at that time [Citation5]. In 1953, Arthur C. Allen, Helwig in 1954, and other researches continued their investigations from the classification of benign and malignant nevus perspective [Citation6]. Later, in 1987, Pehamberger et al. presented a new diagnostic approach named as a ‘pattern analysis’ [Citation7]. Pattern analysis was designated to detect and provide diagnostic accuracy for pigmented skin lesions diseases, such as melanoma and other skin damages [Citation7].
Another one approach which is leading to the faster diagnostic was proposed in 1990 by Bahmer et al. It is named as the seven-point checklist. This approach is based on a simplified pattern analysis and it uses seven standard criteria presented in the guidelines of the terminology consensus on dermoscopy [Citation8,Citation9]. In 1994, Stolz et al. have presented a paper introducing a modification of the ABCD rule in order to influent early-stages diagnosis of malignant skin melanoma [Citation10]. Two years later, Menzies et al. have presented a new diagnostic approach, based on the recognition of two negative dermoscopic features (not favouring melanoma diagnosis) and nine positive features (favouring melanoma diagnosis). This method has shown sensitivity and specificity of 92% and 71%, respectively [Citation11]. Choosing of method or an optimal algorithm depends on aims of task analysis and data characteristics.
Over the last decade, enough methods of data mining application in medicine are found. In diagnosis, there are widely applied neural networks, decision trees, decision rules [Citation12], methods for search of associative rules (for costs analysis) [Citation13], prediction of patient health, and treatment probability, as well as, very popularly use, combinations of prediction algorithms [Citation14]. In 2014, N. Esfandiari et al. [Citation15] carried out a literature review; there are described applications of data mining in medicine based on analysis of the structured data. They stated that classification (neural networks, decision trees, decision rules, support vector model), clustering (k-means, hierarchical clustering), and associative search (a priori associative rules search) models are the most popular in medicine. Lalayants et al. [Citation16] have said that the solution of successful medical data mining is to identify the right activity of healthcare institution or to find the clinical problem. Data mining methods are usually used in biomedical data analysis and visualization tasks in order to facilitate decision-making [Citation17]. If the data mining process would be simple enough, the management of information problems would be already solved long time ago (R. Bellazzi, B. Zupan [Citation14]). Practical data mining application in medicine has some obvious barriers as technological problems, trans-disciplinary communication, ethics, and patient data security [Citation13,Citation17,Citation18].
Medical research leads to a lot of data characterizing the condition of patient. All these data are dynamically changing and depend on patient illness, patient biological condition, environment, the quality of life, related diseases, and other actual reasons that can be described as a random factor. The change of medical statistics observations is described by primary statistics analysis. Jose et al. [Citation19] have presented a new approach in order to improve early diagnostic of skin melanoma from the dermatoscopic images. They have used a general ABCD features and involved other personalized features as skin type, age, and gender. The accuracy of this approach is equal to 86%. In the meantime, a sensitivity of this method is equal to 94% and specificity is equal to 68%.
Other approach for decision support tool was proposed by Daniel Ruiz et al. in 2011 [Citation20]. This independently working method includes artificial neural network (ANN) classifiers, a Bayesian classifier, and the algorithm of the K-nearest neighbours. In 2012, a group of researches has presented an automatic detection of melanoma method based on ANN model [Citation21].
The dermatoscopy-based analysis methods allow to analyse the surface of the skin. The analysis of deeper skin layer can also be informative in order to recognize malignant skin tumour at the early stage. Unfortunately, most of the studies have been related with the thickness measurements of melanocytic skin tumours [Citation22,Citation23]. There are only few studies, related with the melanocytic skin tumour diagnosis based on the analysis of the acquired ultrasonic data.
The objective of the presented research was the development and application of statistical post-processing method in order to achieve faster, more accurate, and independent experience of the investigator in early-stage diagnosis of the melanocytic skin tumours.
In this study, the automatic statistical post-processing method based on analysis of ultrasonic and digital dermatoscopy images of melanocytic skin tumours is presented. The method is intended to estimate the parameters of malignant and benign skin tumours and to increase the accuracy of the early-stage diagnosis. It leads to faster diagnostics and optimization of time-consuming analysis procedures of medical images and could be used in the field of dermatology.
2. Method
2.1. An automatic segmentation of boundaries of skin tumours
Nowadays, many segmentation methods which could be split into different categories are widely used, for example: thresholding approaches, region-growing and region-merging approaches [Citation24], classifiers, clustering approaches, Markov random field models, ANNs, deformable models [Citation25,Citation26], atlas-guided approaches [Citation27], quadric functions with the implementation in order to avoid confusing between shadows and pigmented skin lesions [Citation28], THz spectroscopic imaging and clustering algorithms [Citation29], texture and fractal analysis [Citation30,Citation31], watershed technique [Citation32], gradient vector flow algorithms [Citation33] coherent analysis [Citation34], melanoma recognition system method based on the ABCD criteria [Citation35], support vector machines [Citation36]. In addition to image segmentation tools as active contours and snakes, edge detection and clustering techniques based on thresholding were used [Citation37]. Edge detection technique is not effective when applying on skin images, because of the additional details, such as hair. Active contours [Citation38] and snake’s method [Citation39] are less attractive due to the complex shape of the melanoma suspicious lesions. Since thresholding does not present any of these disadvantages [Citation40], it could be used in order to get the reliable results.
Thresholding approach is the most common procedure used in different applications, for example, in biomedical image analysis [Citation41,Citation42], handwritten character identification [Citation43], automatic target recognition [Citation44], change-detection applications [Citation45–Citation47], reconstruction of a map of interference fringes [Citation48], and segmentation based on colour images [Citation49]. Colour is one of the most significant low-level feature that can be used to extract homogeneous regions which are related to objects or part of objects most of the time, multilevel thresholding technique approaches [Citation50,Citation51], thresholding approach in Otsu algorithm [Citation52], threshold approach in segmentation of satellite images [Citation53], and other applications [Citation15,Citation54].
In this study, boundaries of melanocytic skin tumours in dermatoscopic and ultrasonic images are detected by using Gaussian smoothing and global thresholding technique. Gaussian smoothing is based on mathematical convolution operation of two-dimensional Gaussian kernel function. Normally, it could be interpreted as the mean filter, but in this special case, the kernel properly represents the shape of Gaussian distribution. The degree of Gaussian smoothing strongly depends on the standard deviation of the distribution [Citation14]. In this research standard deviation is chosen to be wide enough and is equal to 5.
Gaussian smoothing–spatial filtering was implemented according to equation [Citation14]:
Here, is the mean and
is the variance.
Meanwhile, thresholding:
Here, T is the global threshold.
During the thresholding, the grey-level images are converted into binary pictures by using an appropriate threshold. All the values which are equal to or below the applied threshold are called as a background, and all the grey-level values which are higher are called as an object [Citation12].
Exclusion of benign and malignant tumours boundaries is made by using an application of thresholding procedure which is based on the expectation–maximization (EM) algorithm. EM algorithm depends on the maximum likelihood estimation which can be expressed as , where
The whole methodology of EM algorithm processing is depended on the random values’ calculations. The procedure of values’ convergence takes from several to hundreds of iterations, which means that the estimation of tumour contour depends on the initial values [Citation55]. After this cycle, a skin tumour with the contour of largest area is selected [Citation12]. Many research studies are made by using this approach of EM algorithm and could be found in [Citation13,Citation16–Citation18,Citation56,Citation57].
Dermatoscopic, ultrasonic, and histological images have been collected at the Department of Skin and Venereal Diseases of Lithuanian University of Health Sciences. The study was approved by regional ethics committee. The cases of 31 suspicious melanocytic skin tumours, which included 19 melanomas and 12 benign nevi, were analysed. The images being analysed within the study were selected according to two criteria: covered size of the tumour up to 1 cm in diameter and histological thickness of ≤2.5 mm.
Ultrasonic data were acquired during non-invasive examination of human skin using DUB-USB ultrasound system (‘Taberna pro medicum’, Germany) with mechanically scanned single-elementfocused transducer with centre frequency of 22 MHz; the received A-scan ultrasonic signals were digitized and transferred to personal computer in order to reconstruct the B-scan image. Optical dermatoscopic images were acquired using spectrophotometer SimSys© (MedX Health Corp., Canada) operating in dermatoscopy mode and transferred to personal computer. The radius of informative area of optical images was 11 mm. After surgical excision and during the routine histopathology, the diagnosis of skin lesions was confirmed.
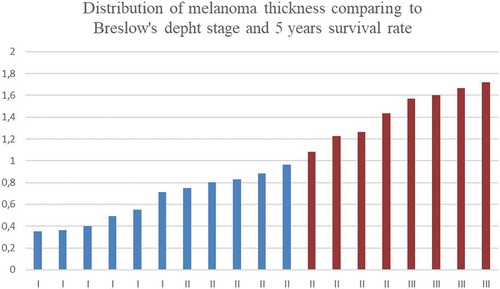
The relationship between melanoma thickness and its malignance, as well as the distribution of survival rates, is presented in . Following the guidelines presented by British Association of Dermatologist, the survival rate when the tumour is less than 1 mm is equal to 95−100% and is presented in blue colour (see ), while in the case of thicker tumour, survival rate is equal to 80–95% and is shown in red colour (see ) [Citation58].
Figure 1. Distribution of melanoma thickness comparing to Breslow’s depth stage and 5 years survival rate.
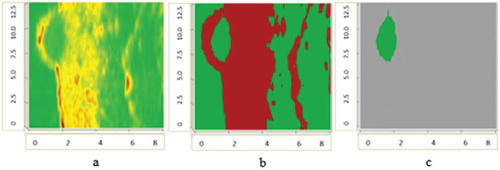
The application of contours selection of ultrasonic and digital dermatoscopy skin melanoma images is presented in –. Ultrasonic raw B-scan images are presented in and (a). The results of transforming raw ultrasound B-scan and digital dermatoscopy images are shown in –. Meanwhile, the results of application of Gaussian smoothing and thresholding procedure as detected informative regions are shown in )–(c) images.
Figure 2. Ultrasonic B-scan images (raw and processed) of skin melanoma, axes are in millimetres: a – ultrasonic raw B-scan image, b – binary B-scan image, c – detected informative region.
Figure 3. Digital Dermatoscopy Images (raw and processed) of skin melanoma, axes are in millimetres: a – raw optical image, b – binary optical image, c – detected informative region.
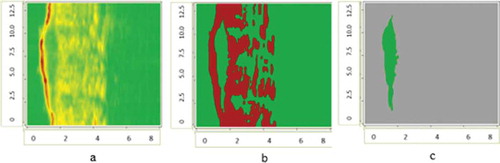
Figure 4. Ultrasonic B-scan images (raw and processed) of benign nevus, axes are in millimetres: a – ultrasonic raw B-scan image, b – binary B-scan image, c – detected informative region.
Figure 5. Digital dermatoscopy images (raw and processed) of benign nevus, axes are in millimetres: a – raw optical image, b – binary optical image, c – detected informative region.
2.2. Quantitative parameters evaluation and selection
The purpose of this research part was to separate significant and not relevant parameters in order to increase the classification accuracy of ultrasonic and digital dermatoscopy images. The selection of parameters does not include peculiarities of vascularity structure. The thickness of analysed skin tumours in this research varies between 0.36 mm and 1.72 mm. For all B-scan ultrasonic and digital dermatoscopy images, 46 parameters of tumour structure were evaluated, such as form features and spatial region criteria, i.e. 19 parameters of ultrasonic images and 27 parameters of digital dermatoscopy images.
For ultrasonic B-scan images, it was made a direct calculation of length, thickness, and spatial region, as well as other form features and relative parameters, such as maximum length, area, perimeter, average skewness (from 1000 directions), maximum skewness, the skewness of length projection, average kurtosis (from 1000 directions), maximum kurtosis, minimum kurtosis, and the kurtosis of length projection. Also the relative estimations, such as the ratio of average skewness (from 1000 directions) and maximum skewness, the ratio of average skewness (from 1000 directions) and the skewness of length projection, the ratio of maximum skewness and the skewness of length projection, the ratio of average kurtosis (from 1000 directions) and maximum kurtosis, the ratio of average kurtosis (from 1000 directions) and minimum kurtosis, the ratio of average kurtosis (from 1000 directions) and the kurtosis of length projection, the ratio of maximum kurtosis and the kurtosis of length projection, the ratio of minimum kurtosis and the kurtosis of length projection, and the ratio of perimeter and area, were made.
For digital dermatoscopy images, there were estimated different shape parameters as maximum diameter, minimum diameter, perimeter, area, average skewness (from 1000 directions), maximum skewness, average kurtosis (from 1000 directions), maximum kurtosis, minimum kurtosis, and 10 deciles and the relative parameters, such as the ratio of maximum diameter and average diameter, the ratio of minimum diameter and average diameter, the ratio of maximum and minimum diameters, the ratio of average skewness (from 1000 directions) and maximum skewness, the ratio of average kurtosis (from 1000 directions) and maximum kurtosis, the ratio of average kurtosis (from 1000 directions) and minimum kurtosis, and the ratio of perimeter and area.
In this study, F test was used in order to select informative parameters for discriminant analysis of malignant and benign skin tumours. The F test is closely related to the analysis of variance, which is known as a parametric statistical way to estimate the significances between two or more groups [Citation59]. In 1987, Parasurama has shown that univariate F test could be used to assess the significant differences between two variances [Citation60]:
The results of F test depend on the degrees of freedom, which correspond to the numerator and the denominator and also depend on the level of significance. If the value of F test is less than the critical value, then there is no significant difference between variances, and the null hypothesis should be returned or otherwise, we should reject it. In such research, the univariate F-ratio test is used in order to estimate the significance of the discriminating power of all of the common variables, taken separately, excluding among and between the various sets of groups [Citation61].
Under the application of Fisher’s test (F test) used in the case of discriminant analysis and the Chi-squared test used in logistic regression model, all the estimated parameters of the 31 lesions (19 – melanoma, 12 – benign nevus) of the human tissue were clustered to significant and not relevant groups of quantitative parameters.
The logistic regression model is parametric because it has a finite set of parameters. Specifically, the parameters are the regression coefficients. These correspond to one for each predictor plus a constant. The Chi-squared test (also called the Wald Chi-squared test) is a way to find out if parameters in this model are significant. The test can be used for a multitude of different models including those with binary variables or continuous variables [Citation62].
The null hypothesis for the test is: some parameter equals to some value. If the null hypothesis is rejected, it suggests that the variables in question can be removed without significant impact to the model fit [Citation62].
The Wald test statistic [Citation62] is evaluated according to the following equation:
where is maximum likelihood estimator (MLE),
is ….,
is expected Fisher information (evaluated at the MLE).
To satisfy the condition of null hypothesis, WT is distributed by asymptotic Chi-square distribution together with the number of r degrees of freedom, where r indicates the rank of the parameter.
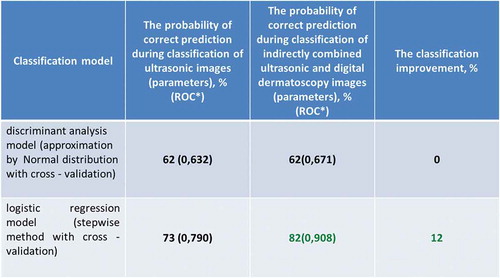
For discriminant analysis model under the F test, 5 significant (informative) parameters of ultrasonic images and 17 of digital dermatoscopy images were selected. By applying Chi-squared test for logistic regression model, two significant parameters of ultrasonic images and two of digital dermatoscopy images were identified. The significant parameters of two different classification models are shown in .
Table 1. Significant parameters evaluated from detected skin lesion region of ultrasonic and dermatoscopic images.
2.3. The classification of tumours by analysis of quantitative parameters extracted from ultrasonic and digital dermatoscopy images
As the purpose of this research was to increase the accuracy of medical measurements, an automatic classification between benign and malignant tumours is done by using discriminant and logistic regression models. These models were chosen due to the small amount of the data, but as a result they gave significant results. Discriminant analysis model was approximated by Normal distribution with the cross-validation. In the meantime, as the other classification model, a stepwise logistic regression with cross-validation was used [Citation63,Citation64].
For the discriminant analysis method, it is assumed that the prior probabilities of the set of observations are noted and that the group-specific densities at are evaluated, so that the probability of
belonging to group
, in the way of discriminant analysis, can be computed by using the statement of the theorem of Bayes [Citation65]:
Here, ԛt is a prior probability of group-specific observations, and ft(x) is a group-specific density.
For the purpose of classification, discriminant analysis method allows to divide p-dim vector area into separate regions, named, and the particular region
is the subarea including the p-dim vectors
so that
is the highest across the sets. If observation is in the region
so that it can be classified from group
[Citation65].
Nonparametric discriminant methods depend on nonparametric evaluation of group-specific probability densities [Citation65]. For the calculation of density to group t for all observations vector x, a defined radius r and an elaborate kernel are used.
Assume that is a
-dimensional vector. Here, a size of a ρ-dimensional piece of sphere bordered by z′z can be defined as [Citation65]:
Gamma function is represented by .
In a set of variables t, the size of a -dimensional ellipsoid bordered by
can be expressed as:
In this case, a Gaussian kernel density function with the mean zero and variance is used in order to establish a nonparametric density in each set and to build up a classification parameter [Citation65]. Gaussian kernel is calculated by using this expression:
Here, .
The classification of the observations is based on the set of unique densities which are calculated from the training group. After the evaluation of the group densities, the ulterior probabilities of group dependence at are also estimated. Then, the sample
is assigned into group
if assigned
produces the highest value of
[Citation65].
Another one of the prognostic models is the logistic regression prognostic model. All the observations for binary response (Y) models of an experimental or an individual observation can get one of the two possible values, for instance, if it is true and Y = 0 if it is false. Let
be a vector of expository variables and
is the probability of the refusal which needs to be estimated. Linear logistic model could be described as follows and is used by many researches [Citation66–Citation71]:
Here, represents the intercept criterion and
is the vector of s grade parameters.
If the nominal response logistic models are being used, with the k+1 maximum number of plausible responses which do not have a natural grading, then the logistic model can be expanded to a multinomial form, as it is shown below [Citation65]:
Here, are
intercept parameters, and the
are
vectors of slope parameters. More about the discrete choice or conditional logit models could be found in [Citation72].
3. Results
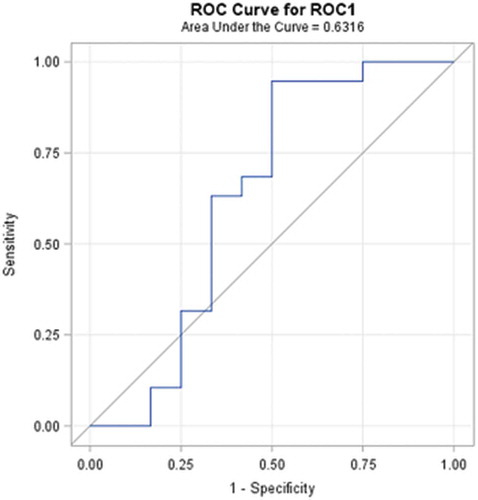
Diagnostic performance rate can be introduced in terms of the ability to classify objects into clinically relevant groups, as well as it also represents the accuracy of diagnostic tools. The obtained accuracy of the estimation depends on the quality of the outcomes provided by the classification results. A receiver-operating characteristic, known as a ROC graph, is a technique for visualizing, organizing, and selecting classifiers based on their performance [Citation73]. ROC curve informs about the degree of accuracy by showing the limits of an ability to discriminate between alternative states of health over the disease possibility. ROC methodology is based on statistical decision theory and was developed in the context of electronic signal detection and problems with radar in the early 1950s [Citation74]. The first signs of possibilities to use ROC curve analysis in medical decision-making tools were first suggested by Lusted [Citation75–Citation78]. After this, researches started to use this method in medical diagnostic [Citation79–Citation92] and medical imaging [Citation93–Citation103] aspects seeking to ensure faster diagnostic and save more lives of patients. In the last two decades, the ROC curve analysis is widely used in the field of dermatology [Citation87–Citation92]. As the ROC curve represents the ratio of sensitivity and 1-specificity and is one of the powerful tools used to check the accuracy of the model, it was agreed to it in this experimental study also. ROC curve of the classification of melanoma and benign melanocytic nevi analysing from ultrasonic B-scan images only by using discriminant analysis is presented in . ROC curve of indirectly combined digital dermatoscopy and ultrasonic medical images classification by using discriminant analysis is presented in . ROC curve of the classification of melanoma and benign melanocytic nevi analysing ultrasonic B-scan images only by using logistic regression is presented in . ROC curve of indirectly combined digital dermatoscopy and ultrasonic medical images classification by using logistic regression is presented in .
Figure 6. ROC curve of the classification of melanoma and benign melanocytic nevi analysing ultrasonic B-scan images only by using discriminant analysis.
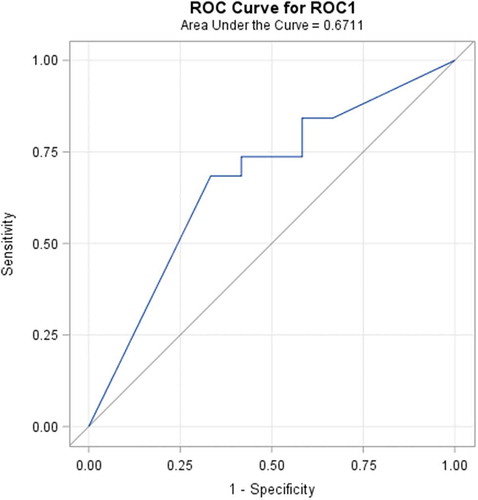
Figure 7. ROC curve of indirectly combined digital dermatoscopy and ultrasonic B-scan images classification by using discriminant analysis.
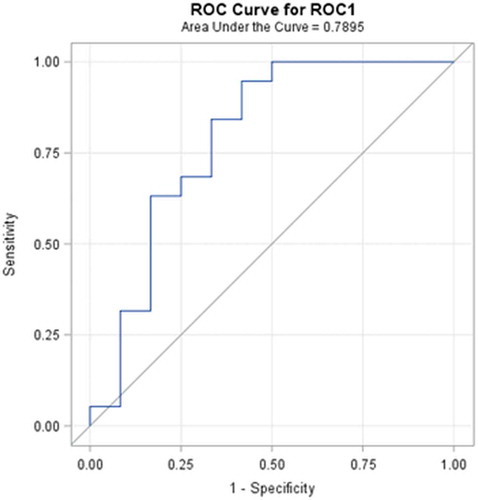
Figure 8. ROC curve of the classification of melanoma and benign melanocytic nevi analysing ultrasonic B-scan images only by using logistic regression.
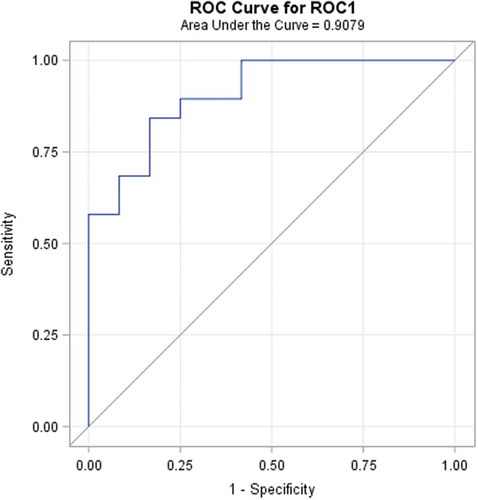
Figure 9. ROC curve of indirectly combined digital dermatoscopy and ultrasonic medical images classification by using logistic regression.
After the classification of malignant and benign tumour by analysis of quantitative parameters extracted from ultrasonic and digital dermatoscopy images, the results are presented in the .
Figure 10. The results of classification of melanoma and benign melanocytic nevi analysing ultrasonic B-scan images and in combination with analysis of digital dermatoscopy images.
In the case of discriminant analysis, the probability of correct prediction during the classification by using significant parameters of ultrasonic images is equal to 62%. Meanwhile, the probability of correct prediction during the classification by using significant parameters of indirectly combined ultrasonic and digital dermatoscopy images is also equal to 62% and the estimated area under the ROC curve is only 0.671. It means that there was no improvement made comparing the results of the discriminant analysis classification models. Looking at the outcomes of an application of stepwise logistic regression, it is obvious that the classification was improved by 12% (up to 82%) comparing with case of ultrasonic B-scan analysis only. The estimated area under the ROC curve is 0.908.
4. Conclusions
Within this study, an automatic statistical post-processing method for analysis of ultrasonic B-scan and digital dermatoscopy images was proposed. Method is able to estimate the set of quantitative parameters for differentiation of malignant (melanomas) and benignant (melanocytic nevus) tumours. For the analysis of region selection, an automatic segmentation of boundaries of skin tumours within ultrasonic B-scan and digital dermatoscopy images was performed. The significance of classification parameters was estimated for discriminant analysis model (Fisher’s test) and logistic regression model (Chi-squared test). For the discriminant analysis model, the sets of significant parameters of ultrasonic images (n = 5/19) and digital dermatoscopy images (n = 17/27) were estimated. In addition, for the logistic regression model, the sets of significant parameters of ultrasonic images (n = 2/19) and digital dermatoscopy images (n = 2/27) were estimated. By indirect combination of quantitative parameters estimated from ultrasonic B-scan images and digital dermatoscopy images, the probability of correct prediction by classification using the logistic regression model was improved by 12% (up to 82%) comparing with the case of ultrasonic B-scan analysis only. The estimated area under the ROC curve is 0.908. In the case of application of discriminant analysis classification models, the improvement was not obtained and the estimated area under the ROC curve is 0.671. Even though the logistic regression model has main advantages over discriminant analysis, i.e. it is more robust, it does not assume a linear relationship between the independent and dependent variables, but unfortunately, the advantages of logistic regression come at a cost: it requires much more data to achieve stable and meaningful results.
One more important thing is the quality of images of skin damages which can be affected by many different factors, such as technical and software issues of ultrasonic imaging system used for examination, the improper gain adjustment of the reived ultrasonic signals (which are reflected from the superficial tissue), and issues of ultrasonic transducer positioning over the damaged region of the skin.Factors such as human factor during the examination (e.g. unpredictable lateral shift of transducer by operator) and patient inability to be in stable position during the ultrasonic examination have a big impact to the results of medical examination. The influence of biological variability also gives the effect to image quality; due to presence of similar acoustic properties (densities and ultrasound velocities) in healthy tissue and damaged tissue, the reflections of ultrasonic waves are sufficiently low amplitude giving the lower quality ultrasonic image.
As a result, the proposed automatic statistical post-processing method leads to faster diagnostics by increasing the accuracy of differentiation of malignant tumours and optimization of time-consuming analysis procedures of medical images. It could be used as a reliable decision support tool in the field of dermatology.
Disclosure statement
No potential conflict of interest was reported by the authors.
Additional information
Funding
References
- American Cancer Society. Cancer facts and figure. Atlanta, Georgia: American Cancer Society; 2018.
- Lens MB, Dawes M. Global perspectives of contemporary epidemiological trends of cutaneous malignant melanoma. Br J Dermatol. 2004;150:1–11.
- Markovic SN, Erickson LA, Rao RD, et al. Malignant Melanoma in the 21st century, part 1: epidemiology, risk factors, screening, prevention, and diagnosis. Mayo Clin Proc. 2007;82(3):364–380.
- Parkin DM, Mesher D, Sasieni P. Cancers attributable to solar (ultraviolet) radiation exposure in the UK in 2010. Br J Cancer. 2011;105:S66–S69.
- Spitz S. Melanomas of childhood. Am J Pathol. 1948;24:591–609.
- Yoradjian A, Figueiredo NC, Pinto VM, et al. Spitz nevus and Reed nevus. An Bras Dermatol. 2012;87(3):349-359. ISSN 0365-0596.
- Pehamberger H, Steiner A, Wolff K. In vivo epiluminescence microscopy of pigmented skin lesions. I. Pattern analysis of pigmented skin lesions. J Am Acad Dermatol. 1987;17:571–583.
- Bahmer FA, Fritsch P, Kreusch J, et al. Diagnostic criteria in epiluminescence microscopy. Consensus meeting of the professional committee of analytic morphology of the society of dermatologic research, 17 November 1989 in Hamburg. Hautarzt. 1990;41:513–514.
- Argenziano G, Fabbrocini G, Carli P, et al. Epiluminescence microscopy for the diagnosis of doubtful melanocytic skin lesions. Comparison of the ABCD rule of dermatoscopy and a new 7-point checklist based on pattern analysis. Arch Dermatol. 1998;134:1563–1570.
- Stolz W, Riemann A, Cognetta AB, et al. ABCD rule of dermatoscopy: a new practical method for early recognition of malignant melanoma. Eur J Dermatol. 1994;4:521–527.
- Menzies SW, Ingvar C, Crotty KA, et al. Frequency and morphologic characteristics of invasive melanomas lacking specific surface microscopic features. Arch Dermatol. 1996;132:1178–1182.
- Bazi Y, Bruzzone L, Melgani F. Image thresholding based on the EM algorithm and the generalized Gaussian distribution. Pattern Recognit. 2007;40:619–634.
- Dempster AP, Laird NM, Rubin DB. Maximum likelihood from incomplete data via the EM algorithm. J R Stat Soc B. 1997;39:1–38.
- Smith SM, Brady JM. SUSAN – a new approach to low level image processing. Int J Comput Vis. 1997;23(1):45–78.
- Gao H, Wenbo X, Sun J, et al. Multilevel thresholding for image segmentation through an improved quantum-behaved particle swarm algorithm. EEE Trans Instrum Meas. 2010;59(4):934–946.
- Everitt BS, Hand DJ. Finite mixture distribution. Chapman and Hall, London: John Wiley; 1981. ISBN 0-387-95457-0.
- Jordan MI, Xu L. Convergence results for the EM approach to mixtures of expert architectures. Neural Networks. 1995;8:1409–1431.
- McLachlan GJ, Krishnan T. The EM algorithm and extensions. (NY): John Wiley; 1997. p. 400.
- Alcon JF, Ciuhu C, Kate W, et al. Automatic imaging system with decision support for inspection of pigmented skin lesions and melanoma diagnosis. IEEE J Sel Top Signal Process. 2009 Feb;3(1):357–362.
- Ruiz D, Berenguer V, Soriano A, et al. A decision support system for the diagnosis of melanoma: a comparative approach. Expert Syst Appl. 2011;38:15217–15223.
- Sheha MA, Mabrouk MS, Sharawy A. Artificial neural network method – automatic detection of melanoma skin cancer using texture analysis. Int J Comput Appl. 2012 Mar;42(20):22–26.
- Jasaitienė D, Valiukevičienė S, Linkevičiūtė G, et al. Principles of high-frequency ultrasonography for investigation of skin pathology. J Eur Acad Dermatol Venereol. 2011;25(4):375–382. Malden: Wiley-Blackwell. ISSN 0926-9959.
- Kučinskienė V, Samulėnienė DG, Gineikienė A, et al. Preoperative assessment of skin tumor thickness and structure using 14-MHz ultrasound. Medicina. 2014;50(3):150–155. Amsterdam: Elsevier. ISSN 1010-660X.
- Wong A, Scharcanski J, Fieguth P. Automatic skin lesion segmentation via iterative stochastic region merging. IEEE. 2011;15:929–936.
- Yan P, Xu Sh, Turkbey B, et al. Discrete deformable model guided by partial active shape model for TRUS image segmentation. IEEE Trans Biomed Eng. 2010;57:1158–1166.
- Zh. M, Tavare JMRS. A novel approach to segment skin lesions in dermoscopic images based on a deformable model. IEEE. 2016;20:1–10.
- Dzung L, Pham Y, Xu C, et al. A survey of current methods in medical image segmentation. Annu Rev Biomed Eng. Technical Report JHU/ECE99-01.1998 Jan 19:1–27.
- Cavalcanti PG, Scharcanski J, Lopes CBO. Shading attenuation in human skin color images. ISVC. 2010; 6453:1–7.
- Brun M-A, Formanek F, Yasuda A, et al. Terahertz imaging applied to cancer diagnosis. Phys Med Biol. 2010;55:4615–4623.
- Dobrescu R, Dobrescu M, Mocanu S, et al. Medical images classification for skin cancer diagnosis based on combined texture. Wseas Trans Biology Biomed. 2010;7:1–10.
- Sheha MA. Automatic detection of melanoma skin cancer using texture analysis. Int J Comput Appl. 2012;42:22–26.
- Wang H, Chen X, Moss RH, et al. Watershed segmentation of dermoscopy images using a watershed technique. Skin Res Technol. 2010;16:378–384.
- Zhou H, Schaefer G, Celebi ME, et al. Gradient vector flow with mean shift for skin lesion segmentation. Comput Med Imaging Graphics. 2011;35:121–127.
- Pereyra M, Dobigeon N, Batatia H, et al. Segmentation of skin lesions in 2D and 3D ultrasound images using a spatially coherent generalized Rayleigh mixture model. IEEE Trans Med Imaging. 2012;31:1509–1520.
- Abbas Q. Melanoma recognition framework based on expert definition of ABCD for dermoscopic images. Skin Res Technol. 2013;19:93–102.
- Abuzaghleh O, Barkana BD, Faezipour M. Noninvasive real-time automated skin lesion analysis system for melanoma early detection and prevention. IEEE. 2015;3:1–12.
- “Color image segmentation: a state-of-the-art survey.” New Delhi, India: Proc. Indian Nat. Science Academy, India, Vol. 67. 2001 Mar, p. 998–1006. A, Arch Dermatol.
- Abbas Q, Fondón I, Rashid M. Unsupervised skin lesions border detection via two-dimensional image analysis. Comput Methods Programs Biomed. 2011;104:1–15.
- Kass M, Witkin A, Terzopoulos D. Snakes: active contour models. Int J Comput Vis. 1998;1(4):321–331.
- Xu L, Jackowski M, Goshtasby A, et al. Segmentation of skin cancer images. Image Vis Comput. 1999;17:65–74.
- Sund T, Eilertsen K. An algorithm for fast adaptive binarization with applications in radiotherapy imaging. IEEE Trans Med Imaging. 2003;22:22–28.
- Celebi ME. Lesion border detection in dermoscopy images using ensembles of thresholding methods. Skin Res Technol. 2013;19:252–258.
- Solihin Y, Leedham CG. Integral ratio: a new class of global thresholding techniques for handwriting images. IEEE Trans Pattern Anal Mach Intell. 1999;21:761–768.
- Bhanu B. Automatic target recognition: state of the art survey. IEEE Trans Aerosp Electron Syst. 1986;AES-22:364–379.
- Bruzzone L, Prieto DF. Automatic analysis of the difference image for unsupervised change detection. IEEE Trans Geosci Remote Sensing. 2000;38:1171–1182.
- Bruzzone L, Prieto DF. An adaptive and semiparametric and context-based approach to unsupervised change detection in multitemporal remote sensing image. IEEE Trans Image Process. 2002;11:452–466.
- Rosin PL, Ioannidis E. Evaluation of global image thresholding for change detection. Pattern Recognition Lett. 2003;24:2345–2356.
- Palevicius P, Ragulskis M, Janusas G, et al. A technique for the reconstruction of a map of continuous curves from interference fringes. Proc SPIE. 2014;9286:1-8.
- Tan KS, Nor Ashidi Mat Isa. Color image segmentation using histogram thresholding – fuzzy C-means hybrid approach. Pattern Recognit. 2011;44:1–15.
- Horng MH. Multilevel thresholding selection based on the artificial bee colony algorithm for image segmentation. Expert Syst Appl. 2011;38:13785–13791.
- Sathya PD, Kayalvizhi R. Modified bacterial foraging algorithm based multilevel thresholding for image segmentation. Eng Appl Artif Intell. 2011;24:595–615.
- Vala HJ, Baxi A. A review on Otsu image segmentation algorithm. Int J Advanced Res Comput Eng Technol (IJARCET). 2013 Feb;2(2):387-389. ISSN: 2278 – 1323.
- Barbieri AL, De Arruda GF, Rodrigues FA, et al. An entropy based approach to automatic image segmentation of satellite images. Physica A. 2011;390:512–518.
- Tang K, Yuan X, Sun T, et al. An improved scheme for minimum cross entropy threshold selection based on genetic algorithm. Knowledge-Based Syst. 2011;24:1131–1138.
- Tomas R. The nonparametric estimation of multivariate distribution density applying clustering procedures. Vilnius. 2007;1:12–13.
- Render RA, Walker HF. Mixture densities, maximum likelihood and the EM algorithm. SIAM Rev. 1984;26:195–239.
- Tsuda K, Akaho S, Asai K. The EM algorithm for kernel matrix completion with auxiliary data. J Machine Learn Res. 2004;4(1):67–81.
- British Association of Dermatologist Guidelines, 2002. Available from: www.bad.org.uk.
- Brown FE. Marketing research: a structure for decision making. Reading (MA): Addison Wesley; 1980. ISBN: 0-8442-3443-5.
- Parasuraman A. Customer-oriented corporate cultures are crucial to services marketing success. J Serv Marketing. 1987;1:139–146.
- Edgeworth FY. On methods of ascertaining variations in the rate of births, deaths and marriages. J [Royal] Stat Soc. 1985;48:628–649.
- Wald A. Tests of statistical hypotheses concerning several parameters when the number of observations is large. Trans Am Math Soc. 1943;54:426–482.
- Chernick MR, Murthy VK, Nealy CD. Estimation of error rate for linear discriminant functions by resampling: non-Gaussian populations. Computers & Mathematics with Applications. 1988;15(1):29–37.
- Lachenbruch PA, Mickey MR. Estimation of error rates in discriminant analysis. Technometrics. 1968;10:1–11.
- Rosenblatt M. Remarks on some nonparametric estimates of a density function. Ann Math Stat. 1956;27:832–837.
- Agresti A. Categorical data analysis. 2nd ed. New York (NY): John Wiley & Sons; 2002. ISBN: 9780471249689.
- Allison PD. Logistic regression using the SAS system: theory and application. Cary (NC): SAS Institute Inc; 2001. ISBN 1-58025-352-0.
- Collett D. Modelling binary data. 2nd ed. London: Chapman & Hall; 2003. ISBN 9781584883241.
- Cox DR, Snell EJ. The analysis of binary data. 2nd ed. London: Chapman & Hall; 1989. ISBN: 0412306204.
- Hosmer DW Jr., Lemeshow S. Applied logistic regression. 2nd ed. New York (NY): John Wiley & Sons; 2000. ISBN: 9780471722144.
- Stokes ME, Davis CS, Koch GG. Categorical data analysis using the SAS system. 2nd ed. Cary (NC): SAS Institute Inc; 2000. ISBN-10: 0471224243.
- McFadden. Conditional logit analysis of qualitative choice behaviour. In Zaremba P (Ed).: Frontiers in econometrics. New York (NY): Academic Press; 1974. p. 105–142.
- Fawcett T. An introduction to ROC analysis. Pattern Recognit Lett. 2006;27:861–874.
- Mets CE. ROC methodology in radiologic imaging. Invest Radiol. 1986;21:720–733.
- Lusted LB. Logical analysis in Roentgen diagnosis. Radiology. 1960;74:178–193.
- Lusted LB. Introduction to medical decision making. Chicago (IL): Thomas Springfield; 1968. p. 32–61.
- Lusted LB. Decision-making studies in patient management. New England J Med. 1971;284:416–424.
- Lusted LB. Signal detectability and medical decision-making. Science. 1971;171:1217–1219.
- Swets JA Signal detection in medical diagnosis. In: Computer diagnosis and diagnostic methods. Chicago (IL): Thomas Springfeld; 1972. p. 8–28.
- McNeil BJ, Keeler E, Adelstein SJ. Primer on certain elements of medical decision making. New England J Med. 1975;293:211–215.
- McNeil BJ, Adelstein SJ. Determining the value of diagnostic and screening tests. J Nucl Med. 1976;17:439–448.
- Weinstein MC, Fineberg HV. Clinical decision analysis. Saunders, Philadelphia; WB Saunders. 1980. p. 309–330.
- Griner PF, Mayewski RJ, Mushlin AI, et al. Selection and interpretation of diagnostic tests and procedures: principles and applications. Ann Intern Med. 1981;94:553–592.
- Robertson EA, Zweig MH, Van Steirtghem AC. Evaluating the clinical efficacy of laboratory tests. Am J Clin Pathol. 1983;79:78–86.
- Swets JA. Measuring the accuracy of diagnostic systems. Science. 1988;240:1285–1293.
- Zweig MH, Campbell G. Receiver-operating characteristic (ROC) plots: a fundamental evaluation tool in clinical medicine. Clin Chem. 1993;39:561–577.
- Wan S, Zhang B. Smooth semiparametric receiver operating characteristic curves for continuous diagnostic tests. Statist Med. 2007;26:2565–2586.
- Alemayehu D, Zou KH. Applications of ROC analysis in medical research: recent developments and future directions. Acad Radiol. 2012 Dec;19(12):1457–1464.
- Zou KH, O’Malley AJ, Mauri L. Receiver-operating characteristic analysis for evaluating diagnostic tests and predictive models. Circulation. 2007;115:654–657.
- Pencina MJ, D’Agostino RB Sr, D’Agostino RB Jr, et al. Evaluating the added predictive ability of a new marker: from area under the ROC curve to reclassification and beyond. Statist Med. 2008;27:157–172.
- Li J. ROC analysis with multiple classes and multiple tests: methodology and its application in microarray studies. Biostatistics. 2008;9, 3:566–576.
- Ishwaran H, Gatsonis CA. A general class of hierarchical ordinal regression models with applications to correlated ROC analysis. Can J Stat. 2000;28(4):731–750.
- Goodenough DJ, Rossmann K, Lusted LB. Radiographic applications of signal detection theory. Radiology. 1972;105:199–200.
- Goodenough DJ, Rossmann K, Lusted LB. Radiographic applications of receiver operating characteristic (ROC) analysis. Radiology. 1974;110:89–95.
- Metz CE. Basic principles of ROC analysis. Semin Nucl Med. 1978;8:283–298.
- Swets JA. ROC analysis applied to the evaluation of medical imaging techniques. Invest Radiol. 1979;14:109–121.
- Swets JA, Pickett RM. Evaluation of diagnostic systems: methods from signal detection theory. New York (NY): Academic Press; 1982. p. 253.
- Metz CE. ROC methodology in radiologic imaging. Invest Radiol. 1986;21:720–733.
- Metz CE. Some practical issues of experimental design and data analysis in radiological ROC studies. Invest Radiol. 1989;24:234–245.
- Hanley JA. Receiver operating characteristic (ROC) methodology: the state of art. CRC Crit Rev Diagn Imaging. 1989;29:307–335.
- Hanley JA, McNeil BJ. The meaning and use of the area under a receiver operating characteristic (ROC) curve. Radiology. 1982;143:29–36.
- McNeil BJ, Hanley JA, Funkenstein HH, et al. The use of paired ROC curves in studying the impact of history on radiography interpretation. Radiology. 1983;149:75–77.
- Duncan JS, Ayache N. Medical image analysis: progress over two decades and the challenges ahead. IEEE Trans Pattern Anal Mach Intell. 2000 Jan;22(1):85–106.