
ABSTRACT
Sedimentation is one of the most popular wastewater treatment processes, and is used to separate solid particles from carrier fluid in settling tanks known as clarifiers. The clarifier, as the last major facility in wastewater treatment plants (WWTPs), can limit or define the performance of the overall WWTP. This paper presents a novel three-dimensional unsteady computational fluid dynamics (CFD) model to improve the efficiency of an industrial clarifier that had been experiencing underperformance and reduction in wastewater handling capacity. We propose a numerical technique to address the transient process of removing sludge from the floor of clarifiers by using rotating rakes. The CFD model was first applied to analyzing the ramifications of the current clarifier geometry on performance. The results show that the root causes for underperformance are related to the unconventional top side feed design of the clarifier, which leads to significant asymmetry in the flow distribution. The CFD model was next used to investigate various design modifications with the goal of improving the clarifier performance. A few geometry modification ideas such as an inward baffle, dissipating inlets, and a submerged skirt were found to create a more uniform flow distribution in the clarifier, significantly reducing the backflow into the feedwell and the velocity of the flow exiting the feedwell, which helps the solid particles to settle in the clarifier. These three designs were found to reduce the effluent total suspended solids (TSS) by more than 80% and thus significantly improve clarifier performance. It is believed that the CFD model developed in this study can become a computationally efficient tool for investigating the performance of industrial clarifiers with complex geometries and rotating rakes.
1. Introduction
The performance of the clarifiers in the wastewater treatment plant (WWTP) in Freeport, Texas, United States (US) has been less than satisfactory, which is reflected in the higher than desirable effluent total suspended solids (TSS) in the weir overflow exiting the clarifiers. In some of the clarifiers, surface currents are ‘muddy’, indicating that solid particles do not settle well on the bottom floor and instead are carried away by the water to the overflow weir, which limits the wastewater handling capacity of the WWTP. Use of more water-soluble flocculent and emulsion polymer is required to enhance the settling of solid particles. However, the addition of more flocculants can significantly increase the operational cost as well as operational difficulties. Furthermore, even with increased flocculent, sometimes clarifier performance is still less than satisfactory.
One hypothesis for the root cause of the problem is the unconventional design of the feedwell system in the clarifier. A desirable feedwell design should dissipate the momentum of the feed stream, provide a symmetric and uniformly-distributed feed flow exiting the feedwell into the settling zone, and create a flow pattern in the clarifier that facilitates the separation and settling of the solids. This does not seem to be the case for the clarifier at the Freeport WWTP, as evidenced by the deformed and tilted structure and undesirably high level of solid suspensions near the surface.
The first scientific theory to be extensively used as the main criterion in the design of settling tanks can be traced back to Hazen (Citation1904) who proposed the overflow rate concept which stated that hydraulic retention times should be equal to the particle settling time. However, Hazen's theory neglected turbulence, and assumed uniform horizontal flow. In reality, flows in industrial clarifiers are highly asymmetric and turbulent (Griborio, Citation2004), with Reynolds numbers as high as Re = 105. These flows are also dominated by density effects (Zhou & McCorquodale, Citation1992a). Proper modeling of the effect of density differences in hydrodynamics is necessary for the accurate analysis of the clarifiers. Hazen's theory also assumed that the particle settling velocity is independent of solid concentration. However, it is widely known that in hindered and compression settling, solid concentration influences the particle settling rate (Griborio, Citation2004). Previous research has also shown that the hydrodynamics and solid settling rate in clarifiers are strongly coupled to one another due to density effects (Ekama et al., Citation1997).
One of the earliest clarifier models was published around 70 years ago by Dobbins (Citation1944). The earlier clarifier models (Camp, Citation1946; Dick & Young, Citation1972; Dobbins, Citation1944) were based on analytical solutions of solid flux equations. They assumed plug flow behavior and used ‘correction factors’ to approximate clarifier hydraulic behavior. However, plug flow is an oversimplification in real-world clarifiers (Zhou, McCorquodale, Richardson, & Wilson, Citation2005), especially industrial clarifiers with strong geometric asymmetry. Therefore, the information provided by these earlier models is limited and cannot be used to design efficient clarifiers or troubleshoot problems with existing clarifiers. With advances in computational technology, computational fluid dynamics (CFD) was adopted to develop more realistic clarifier models. Those early CFD models, most of which are 2D, can resolve some of the problems associated with the simplified approximation of the clarifier hydraulic effects.
The first 2D clarifier CFD model was developed by Larsen (Citation1977), who used a vorticity-streamfunction formulation in combination with a Prandtl mixing length theory for turbulent modeling in order to simulate the flow field in a rectangular clarifier. A number of studies (Abdel-Gawad & McCorquodale, Citation1985a, Citation1985b; Adams & Rodi, Citation1990; Celik, Rodi, & Stamou, Citation1985; Imam, McCorquodale, & Bewtra, Citation1983; Schamber & Larock, Citation1981) were published in the years which followed that tried to improve upon the clarifier model developed by Larsen. A finite element analysis on the flow pattern in rectangular clarifiers using a k-ε turbulence model was developed by Schamber and Larock (Citation1981). A clarifier model, based on the vorticity-streamfunction formulation along with a constant eddy viscosity was used to model discrete particle settling in rectangular clarifiers by Imam et al. (Citation1983). A numerical model was developed using a modified Prandtl mixing length to model the flow pattern and particle settling in the primary settling tanks (Abdel-Gawad & McCorquodale, Citation1985a), and it was shown to be computationally more efficient than some of the earlier models (Imam et al., Citation1983; Schamber & Larock, Citation1981). It was also used to study flow distribution and particle transport in primary circular clarifiers (Abdel-Gawad & McCorquodale, Citation1985b). A numerical formulation based on the finite-volume method in conjunction with a k-ε turbulence model was developed by Celik et al. (Citation1985) to understand the flow pattern in rectangular settling tanks. However, the formulation used a hybrid discretization scheme which suffered from numerical diffusion. This was improved upon in a later study by Adams and Rodi (Citation1990), who used a quadratic upstream interpolation for convective kinematics (QUICK) discretization scheme to minimize numerical diffusion, and successfully predicted the dye transport in rectangular clarifiers. However, none of the above studies accounted for the density effects on particle settling. This was rectified by Devantier and Larock (Citation1987), who used a Galerkin finite element method to study sediment-induced density current in two-dimensional circular clarifiers.
Zhou and McCorquodale (Citation1992a, Citation1992c) developed a numerical formulation based on finite difference (Patankar & Spalding, Citation1972) using a k-ε turbulence model for simulating the fluid flow and particle settling in circular center-feed secondary clarifiers. The model was validated by field measurements and was shown to capture some of the important features of secondary clarifiers, including density waterfall and the effect of the waterfall on the bottom density currents, recirculation, and flow entrainment, amongst others. The model was later extended to study rectangular clarifiers (Zhou & McCorquodale, Citation1992b). The model was also used to study the effect of hydraulic and solid loading and tank geometry on clarifier performance (McCorquodale & Zhou, Citation1993).
Over the last two decades, advances in CFD have enabled clarifier design optimization based on numerical simulation. An earlier CFD package, PHOENICS, was extensively used by researchers to improve clarifier design (Brouckaer & Buckley, Citation1999; Dahl, Larsen, & Petersen, Citation1994; Krebs, Citation1991). The PHOENICS code was later coupled with a flocculation sub-model to understand the effect of flocculation in storage sedimentation basins (De Cock, Blom, Vaes, & Berlamont, Citation1999). Since then, another CFD package, Fluent, has been extensively used to model primary and secondary clarifiers (De Clercq, Citation2003; Laine, Phan, Pellarin, & Robert, Citation1999). A Quasi-3D model was developed by Griborio (Citation2004) and McCorquodale, Griborio, and Georgiou (Citation2005) that accounted for axisymmetric hydrodynamics, turbulence, sludge rheology, and flocculation, and was shown to accurately predict effluent TSS in circular clarifiers. Zhou et al. (Citation2005) applied this model to troubleshoot problems with existing center-feed circular secondary clarifiers and to optimize their design. McCorquodale, Griborio, and Georgiou (Citation2006) presented a 2D CFD model using the vorticity-streamfunction approach to improve the performance of rectangular clarifiers. This model was also applied by McCorquodale, Griborio, Li, Horneck, and Biswas (Citation2007) to investigate the solid removal efficiency of a retention treatment basin for combined sewer overflows. A 2D CFD model was also developed by Goula, Kostoglou, Karapantsios, and Zouboulis (Citation2008) to improve the design of sedimentation tanks in potable water treatment. A 3D CFD model was developed by Ramalingam et al. (Citation2007) to improve the design of rectangular final settling tanks. Barnard, Kunetz, and Sobanski (Citation2008) used CFD to investigate the reasons for the superior performance of a 65-year-old clarifier that rivalled the design of modern clarifiers. Al-Jeebory, Kris, and Ghawi (Citation2010) developed a 2D CFD model to optimize the performance of the circular sedimentation tanks at the Al-Gazaer WWTPs in Iraq. This model was later used by Ghawi and Kris (Citation2011) to investigate the effect of inlet baffles in terms of improving the performance of the secondary clarifiers at the Al-Dewanyia WWTP in Iraq. Xanthos et al. (Citation2011) incorporated a flocculation sub-model into a 3D CFD model to improve the Upper East River water pollution control plant in New York City. More recently, Griborio, Martinez, Stanley, Koroshec, and Coates (Citation2012) presented a comprehensive approach including field characterization and CFD modeling for the rehabilitation of three circular center-feed secondary clarifiers at the South Central Regional Wastewater Treatment and Disposal Board located in Delray Beach, Florida. CFD was also used by Lo (Citation2013) to optimize the design of the flocculation center well for the circular final clarifiers at the Tai Po Sewage Treatment Works. Xanthos, Ramalingam, Lipke, McKenna, and Fillos (Citation2013) successfully performed 3D CFD simulations to optimize the design of secondary clarifiers under the Passaic Valley Sewerage Commission.
Unfortunately, most of the above-mentioned studies focus on relatively simple clarifier geometries which allow the use of simplified 2D simulations. Even the few 3D clarifier studies (Griborio, Citation2004; McCorquodale et al., Citation2005; Ramalingam et al., Citation2007; Xanthos et al., Citation2011, Citation2013) focus on simple circular or rectangular geometries with a center-feed design. In comparison, the clarifiers in Freeport, TX have highly asymmetric geometry with a side-feed mechanism which necessitates coupled 3D simulations of fluid flow and solid concentration. Furthermore, none of the published clarifier papers model sludge removal by the use of a rotating rake. Instead, in these studies, the solids are simply removed from an outlet for sludge on the clarifier floor for which steady state CFD simulations can be performed. In contrast, the Freeport clarifiers have a flat floor and the settled sludge can only be removed by a slowly rotating rake. It is therefore necessary to develop a numerical technique to address the removal of solids by the use of rotating rakes, which also necessitates transient CFD simulations. To the knowledge of the authors, this is the first study which attempts to model sludge removal from a clarifier floor using rotating rakes. The strong two-way coupling between the fluid and solid fields limits the allowable time-step in the transient CFD simulations, which dramatically increases the computational cost; thus, the CFD simulations can be very time-consuming. To overcome this, a three-step modeling approach was developed for this study, as described in section 3.1. Finally, most of the published studies focus on municipal clarifiers which handle wastewater with a much higher settling velocity than those encountered in industrial clarifiers. There is a lack of reliable 3D CFD modeling tools for industrial clarifiers in the published literature. This is the first study which models the major geometric details of industrial clarifiers and optimizes the design to improve clarifier performance. The specific objectives of this paper include:
Developing a 3D unsteady CFD modeling tool for industrial clarifiers which includes the effect of using rotating rakes for sludge removal.
Simulating and analyzing the flow patterns and solid settling with the current clarifier configurations to identify the root cause of underperformance.
Improving performance by optimizing the clarifier design:
- Evaluating/simulating various ideas of retrofit/ modifications.
- Identifying effective low-cost and low-risk solutions.
2. Governing equations
Modeling the hydrodynamics and flow pattern in the clarifier is relatively easy if we can ignore the solids in the CFD model (thus turning it into a single-phase flow problem). However, hydrodynamics alone is unable to provide sufficient and conclusive information about clarifier performance. Therefore, it is necessary to develop a numerical formulation to couple fluid dynamics and solids behavior in order to characterize clarifier performance.
2.1. Fluid flow
The governing equations for fluid flow are the continuity and momentum balance equations that factor in the effect of solid concentration on fluid properties:
(1)
(2) where ρ is the density,
is the fluid velocity vector, p is the pressure,
is the stress tensor, and Fg is the body source term, given as:
(3) where SS is the specific density of the dry solids and X is the local sludge concentration.
2.2. Molecular viscosity
Over the years, a number of rheological models have been developed to describe the effect of sludge concentration on the molecular viscosity of fluid. Some of the popular models include the Ostwald pseudoplastic model (Metzner & Reed, Citation1955) shown in Equation (4), the Bingham (Citation1916) plastic model shown in Equation (5), and the Herschel–Bulkley equations for the yieldpseudoplastic model (Huang & Garcia, Citation1998) shown in Equation (6). The plastic and yield pseudoplastic models try to model the effects of initial resistance of sludge to deformation by including a yield stress term:
(4)
(5)
(6) where τ0 is the yield stress, ηp is the plastic viscosity, and n is an empirical exponent < 1. There is a lack of agreement in the research community on which of the above models is best suited to modelling the rheology of wastewater sludge. While Battistoni (Citation1997) concluded that both plastic and pseudoplastic models can be used to model rheology of all types of sludge, Monteiro (Citation1997) has shown that models with yield stress (Bingham and Herschel–Bulkley models) are better suited to modelling the rheology of raw and anaerobically digested sludge. Sozanski, Kempa, Grocholski, and Bien (Citation1997) concluded that the Bingham model is ideal when modeling the rheology of thickened sludge.
Bokil (Citation1972) and Bokil and Bewtra (Citation1972) suggested an experimental exponential function of plastic viscosity:
(7) where ν is the effective molecular kinematic viscosity in m2/s and X is the sludge concentration in g/l. On the other hand, DeClercq (Citation2003) modeled the rheology of activated sludge using a modified Herschel–Bulkley model and showed that true yield stress does not exist:
(8) where γ* is the magnitude of the strain rate, m is the stress growth exponent, and n is the flow behavior index. Furthermore, DeClercq (Citation2003) compared his model to the Bingham and Bokil models and concluded that the Bokil model gave the best prediction of the sludge blanket height. Over the last few years, the Bokil model has also been successfully used to model the rheology of wastewater sludge (Griborio, Citation2004; McCorquodale et al., Citation2006, Citation2007; Ramalingam et al., Citation2012; Xanthos et al., Citation2011; Zhou et al., Citation2005). It is a two-parameter model that is also relatively easy to implement in a numerical framework, and it is therefore chosen for this study.
2.3. Solid concentration
The transport equation for the solids is given as
(9) where νSX, νSY, and νSZ are the eddy diffusivities of the suspended solids in the x, y, and z directions, respectively, and are defined as:
(10)
(11)
(12) where Γx, Γy, and Γz may be thought of as inverse of turbulent Schmidt numbers and VS is the solid settling velocity.
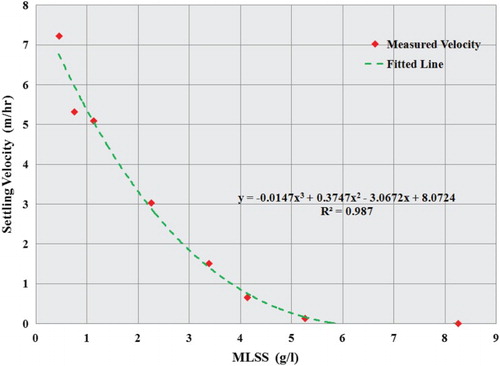
The settling velocities of the suspended solids were measured in the lab, and incorporated in the CFD model. The methodology for settling velocity measurement is described below:
Gather reactor sludge (or clarifier recycle sludge) sample and clarifier effluent.
Settle out the TSS in the effluent sample. Use the supernatant for dilution.
Measure the Mixed Liquor Suspended Solids for the reactor (clarifier Return Activated Sludge) sample.
‘Slowly’ mix the reactor sample; measure and load the volume of sludge into each 2-liter beaker.
Measure the volume of effluent supernatant needed for each cylinder and pour into each beaker.
Slowly mix the content in each beaker and then quickly pour into each graduated cylinder.
Start stopwatch and record the interface position in the graduated cylinder as the sludge interface drops.
At the end of the test, pour the sludge from each graduated cylinder back into its corresponding beaker. Measure and record TSS for each beaker.
The settling velocity of the Freeport WWTP solids is shown in as a function of solid concentration. It was found that the settling velocity at concentrations of over 5 g/l is less than 0.1 m/h, which is over 10 times lower than that typically observed in municipal clarifiers (Griborio, Citation2004). It is therefore more challenging to settle the solids in the industrial clarifiers under investigation. Finally, it is worthwhile to note that the numerical formulation used in this study is fairly general, and that the solid settling velocity from clarifiers at any site or of any type can easily be incorporated into the CFD model.
Figure 1. Settling velocity of Freeport WWTP clarifier solids.
3. Numerical implementation
3.1. A three-stage modeling approach
In the clarifiers, solids settled on the clarifier floor are removed by a rotating rake. Solid settling is strongly influenced by hydrodynamics, because of which a two-way coupled numerical formulation of fluid flow and solid concentration is necessary. However, in the transient 3D simulations, if governing equations for fluid flow and solid settling are solved together from the very beginning, it takes a long time for the flow field to develop and this dramatically increases the computational cost and turnaround time of the simulation. To overcome this problem, a novel three-stage modeling approach is adopted in this study. In the first stage, the steady-state fluid flow equations are solved to build up the flow field in the clarifier. No solids are included in the feed flow. In the second stage, a transient flow simulation is conducted with solids added to the feed flow and loaded into the clarifier. The fluid flow and solid concentration equations are solved together, allowing the solids field to build up. However, the removal of the solids by a rotating rake is not included at this stage. Thus, the solid field gradually develops and the solid concentration in the clarifier increases as the sludge builds up with time in the clarifier. In the third and final stage, the transient flow simulation continues but now with the solid removal mechanism activated. The solid particles are fed into the clarifier by the feed flow and the settled sludge is simultaneously removed from the floor by the rotating rake. Only the third stage represents the actual field operation of the clarifiers. In our simulations, we can also directly simulate the third stage without simulating the first two stages. However, as mentioned earlier, this dramatically increases the time required for the fluid and solid fields to develop. This three-stage modeling approach is developed only for computational efficiency, and makes it possible to perform 3D unsteady simulations of fluid flow and solid settling in complex industrial clarifier geometries within an acceptable time frame.
3.2. Solid removal
The complexity of the rake geometry makes it very difficult, if not impossible, to include in the computational model. In this study, a novel numerical technique was developed to mimic the solid removal by the rotating rake without including the rake geometry. This is considered a reasonable simplification because the rake rotates very slowly (1.2 revolutions per hour) and it is made of steel frames with significant void space and thus the impact of such a simplification on the flow pattern in the clarifier is believed to be insignificant. A rotating sink term is added to the right-hand side of Equation (9) to model the solid removal along the path of the rotating rake, as follows:
(13) where α is a removal coefficient which is chosen to ensure that the solid on the floor is completely removed by the rotating rake so that the solid concentration behind the rake is xcr = 0.01 g/l. To the knowledge of the authors, this is the first published clarifier study that has tried to model solid removal by use of rotating rake.
3.3. Turbulence modeling
Turbulence can be modeled using different approaches, including constant eddy-viscosity model, mixing length model, and k-ε model. The major limitation of the constant eddy viscosity model is the inability to include the heterogeneous effects of eddy viscosity in secondary clarifiers. On the other hand, both the mixing length and k-ε models have been successfully applied to settling tanks in the past (Larsen, Citation1977; White, Sutalo, & Nguyen, Citation2003; Xanthos et al., Citation2011). However, past research (Rodi, Citation1980) has indicated that recirculating flows do not give satisfactory results with mixing length models because of the difficulty in defining a reliable mixing length. The flows in the Freeport clarifiers are expected to have significant swirling effects because of the asymmetry of the clarifier geometry. The standard k-ε turbulence model (Launder & Spalding, Citation1972), which is a two-equation model, is one of the most widely used turbulence models, in which two separate transport equations are solved for the turbulence kinetic energy and its dissipation rate. However, previous studies have shown that standard k-ε turbulence model is insufficient to model flows with strong swirling components (Kobayashi & Yoda, Citation1987; Sloan, Smith, & Smoot, Citation1986). In contrast, the realizable k-ε turbulence model (Shih, Liou, Shabbir, Yang, & Zhu, Citation1995), the RNG k-ε turbulence model (Choudhury, Citation1993), and the Reynolds Stress Model (Launder, Citation1989; Launder, Reece, & Rodi, Citation1975) are known to give more accurate results for such flows. However, the Reynolds Stress Model is computationally expensive and its applicability has not yet been validated for clarifier flows. The realizable k-ε turbulence model involves a different transport equation for the dissipation rate, which has been derived from an exact equation for the transport of the mean-square vorticity fluctuation. A major benefit of the realizable k-ε turbulence model is that it gives a much more accurate prediction of turbulent stresses for flows involving rotation and recirculation. Furthermore, unlike the standard k-ε model or the RNG k-ε model, the realizable k-ε turbulence model satisfies certain mathematical constraints on the Reynolds stresses, which are consistent with the physics of turbulent flows. Because of this reason, the realizable k-ε turbulence model is used for the present study. The turbulence model is coupled with the scalable wall functions (Ansys, Citation2013), an approach which forces the usage of log-law in conjunction with standard wall functions (Launder & Spalding, Citation1974), and which avoids deterioration in the standard wall functions for grid refinement with y* < 11.225. The effective viscosity of the sludge is calculated as:
(14) where νt is the turbulent eddy viscosity calculated by the realizable k-ε turbulence model and ν is the kinematic molecular viscosity given by Equation (7).
3.4. Discretization and solution procedure
The governing equations are solved using the commercial CFD package ANSYS Fluent® 14.5. The settling sub-model is implemented using user-defined functions (UDFs; Ansys, Citation2013). The computational domain is first divided into a number of non-overlapping cells or control volumes. Subsequently, a cell-centered finite volume approach is used to discretize the governing equations for fluid flow and solid concentration. Second-order upwind schemes are used for spatial discretization, whereas first-order implicit schemes are used for temporal discretization. The fluid flow equations are solved using the SIMPLE algorithm (Patankar & Spalding, Citation1972). The finite volume discretization procedure produces a linear system of the form:
(15) where A is a Jacobian matrix, x is the solution vector, and b is the source vector. The system of algebraic equations is solved iteratively with an Algebraic Multigrid solver (Barrett et al., Citation1994).
Simulations are run on 48 processors of an in-house cluster. For the CFD simulations, a 10−3 reduction in residuals is set as the tolerance criterion for the iterations in each time-step. Furthermore, each CFD run takes roughly 40 hours to simulate 6 hours of flow time.
3.5. Freeport clarifier geometry and the computational domain
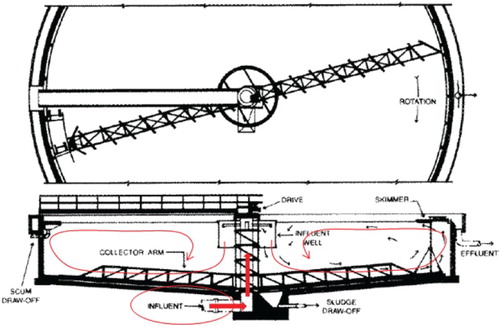
A typical conventional center-feed industrial clarifier with feed from the bottom (Water Pollution Control Federation, Citation1985) is shown in . The center-feed mechanism helps in distributing the feed flow radially in the clarifier. As illustrated in , the feed stream enters the feedwell top radially, and exits below the curtain of the feedwell into the clarifier. The flow circulates in the clarifier, and solid particles disengage from the flow and settle on the bottom of the floor, where a rotating rake removes the settled sludge in its path. Furthermore, the symmetric geometry of these clarifiers ensures that the flow distribution is uniform and symmetric, which is a key requirement for good clarifier performance (Griborio, Citation2004).
Figure 2. Typical conventional clarifier design with bottom central feed and corresponding symmetric flow pattern.
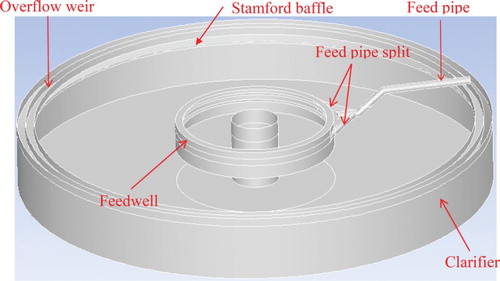
In contrast to conventional industrial clarifiers, the clarifier at the Freeport WWTP has an unconventional top side feed design (). Feed flow enters the clarifier from the side through a feedpipe located beneath the walk bridge but above the water surface. The feedpipe gets submerged under the water surface near the feedwell. It subsequently splits into two pipes, which tangentially feed the wastewater into a feedwell at slightly different elevations, and the two influx streams are separated by three shelves around the feedwell inner circumference. The corresponding tangential feeds result in swirling flows in opposite directions, resulting in a complex flow pattern in the feedwell that is difficult to picture without flow modeling. The feed flow ultimately exits from the bottom of the feedwell into the clarifier where solid particles are expected to disengage from the flow, settle onto the floor, and be removed by a slowly rotating rake. Clear water flows to the overflow weir at the top outer wall of the clarifier. The clarifier walls just below the overflow weir are also fitted with a Stamford baffle (Griborio, Citation2004) to divert the solid particles away from the overflow weir.
Figure 3. Clarifier in Freeport WWTP.
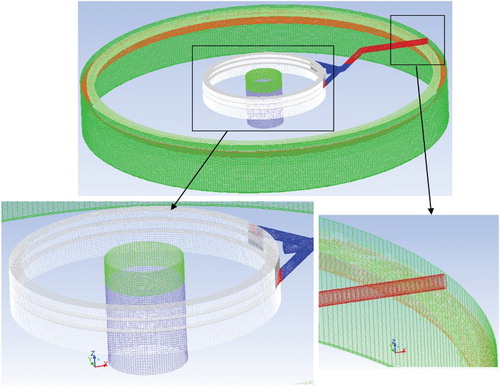
shows the computational domain in the CFD model. The clarifier has an internal diameter of 165 ft, a height of 40 ft, and a typical operating water level of 23 ft from the floor. A number of geometric simplifications have been made to improve the computational efficiency of the simulations. All of the key clarifier features, including the feedpipe, feedwell, shelves, overflow weir, and a simplified sludge well are included in the numerical model. However, for simplicity, supporting frames such as those for the Stamford baffle and the feedwell are not modeled in this study. This is believed to be a reasonable approximation because the dimensions and volume of those supporting frames are negligibly small compared to the large size of the clarifier.
Because of the complex geometry of the Freeport WWTP clarifier and the presence of a wide range of length scales in the domain, mesh generation and CFD simulations become particularly challenging for this problem. Effort has been made to generate high-quality hexahedral dominant meshes for almost the entire computational domain for computational efficiency. Boundary layers are used near wall surfaces in order to accurately capture the flow field in the critical regions. The average y+ value on the wall surfaces ranges from 30 to 60. A sample mesh for the problem containing around 4 million cells is shown in , which also shows the zoomed-in view of the mesh near the Stamford baffle and the feedwell. Additionally, simulations with around 2 million and 6 million cells were performed, where the mesh density was varied in the critical regions. Mesh independence was achieved with the mesh with 4 million cells, which was therefore used in thepresent study.
Figure 4. CFD mesh for the Freeport WWTP clarifiers.
3.6. Simulation conditions
The following simulation condition, representing a typical operating condition for the clarifier, is used in the CFD simulations. The feed flow rate is 10,000 gpm and the return sludge flow rate is 3000 gpm, whereas the effluent flow rate in the overflow weir is 7000 gpm. The solid concentration at the inlet is 5 g/l. In all simulations, the effluent TSS is monitored as a function of time in the overflow weir. A time-step of Δt = 5 s was used in the transient CFD simulations. This time-step size was found to be sufficient to produce time-step-independent results.
4. Results and discussions
4.1. Baseline case
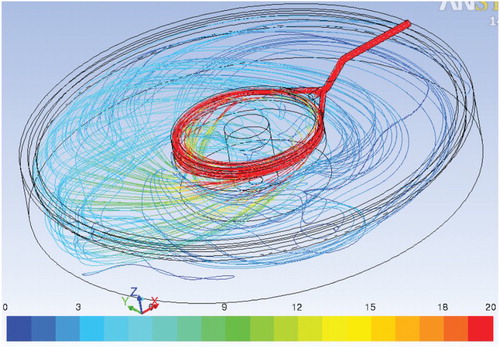
The baseline case corresponds to the current clarifier design. 3D unsteady CFD simulations are performed using the computational tool developed in this study to understand the flow distribution and nature of solid settling in the clarifiers. The flow pattern in the clarifier is first illustrated with 3D flow pathlines, representing the trajectories of tracers released at the inlet of the feedpipe and colored by velocity magnitude in . It can be seen that flow exits the feedwell with high velocity in the region opposite to the feedpipe, and impinges on the floor. Furthermore, the figure clearly reveals the swirling flow pattern in the clarifier, which indicates an asymmetric flow distribution and localized regions of high solid concentration. The presence of swirling flow currents is generally undesirable in clarifiers (Esler, Hartnett, & Haug, Citation2001) and should be avoided to improve clarifierperformance.
Figure 5. Flow pattern in the current clarifier illustrated by pathlines colored by velocity magnitude (ft/min).
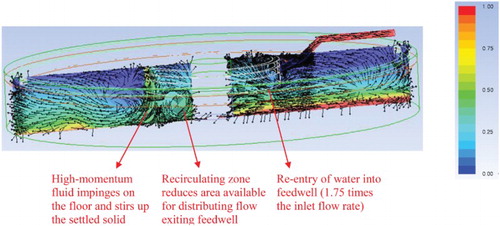
The flow pattern is further elucidated in with velocity vectors on a vertical plane through the center of the clarifier. The vectors are ‘equal-size’ vectors, and thus each vector only represents the local velocity direction and not the velocity magnitude. This helps to illustrate the flow pattern in the clarifier where the velocity magnitude is significantly lower than in the feedpipe and feedwell. The colors in this figure represent the contours of solid concentration, which are normalized with respect to inlet solid concentration. The figure reveals that there is a strong backflow (re-entry) into the feedwell from the feedwell bottom through the region close to the feedpipe. A strong recirculation region is also found just below the feedwell, which compromises the efficient distribution of the flow exiting the feedwell. The entire feed coming from the inlet, combined with the backflow, ultimately flows down through the much smaller area at the feedwell exit (opposite the feedpipe) at a high velocity. This high-momentum flow impinges on the floor, as a result of which the solids which have already settled in that area are stirred up.
Figure 6. Flow pattern and normalized (with respect to inlet concentration) solid concentration in the current clarifier (baseline).
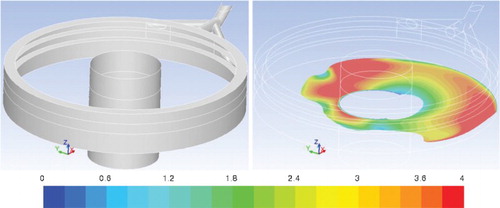
shows the backflow area at the feedwell exit, colored by the upward velocity magnitude. The backflow area is found to be more than 50% of the feedwell exit area. As a result, the area available for the flow in the feedwell to flow down gets reduced. The backflow rate can be quantified and is found to be 1.75 times the inlet feed flow rate, which means that a total of 2.75 times the specified inflow (27,500 gpm) has to leave the feedwell from the reduced available area. This leads to an average downward velocity at the feedwell exit of 4.14 ft/min, which is significantly higher than the design intention. In summary, the CFD simulation results help to identify four major problems with the current clarifier design:
A strong backflow into the feedwell.
A large recirculation zone near the feedwell.
The high velocity of the flow exiting the feedwell.
The lack of flow symmetry.
Figure 7. Feedwell of the clarifier (left) and backflow area at the feedwell exit colored by upward velocity (ft/min) (right).
We seek to make clarifier geometry changes to alleviate these problems. Furthermore, we seek to make design changes closer to the feedwell area to reduce the costs associated with geometry modification.
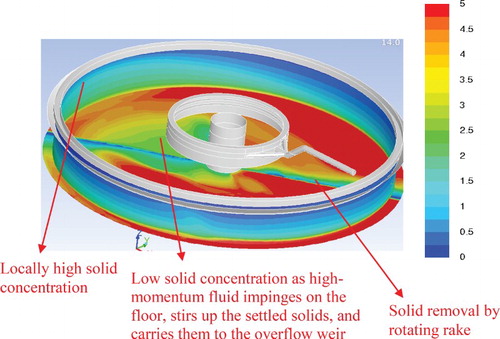
The contours of normalized (with respect to inlet concentration) solid concentration on the floor and on a radial plane through the overflow weir are shown in . The region on the floor opposite to the feedpipe with low solid concentration corresponds to the location where the high momentum flow is impacting the floor after exiting the feedwell. The solids cannot settle at this location since they are stirred up by the impingement and carried away by the high-velocity current to the overflow weir. This is evident from the field observation where locally high solid concentration occurs in the overflow weir directly opposite the feedpipe (). There is also low concentration (illustrated in blue) on the floor along the rake. This corresponds to sludge removal from the floor by the rake rotating along its path, which is mimicked in the CFD model by the rotating sink term in Equation (13).
Figure 8. Contours of normalized solid concentration on the floor and on a radial plane through the overflow weir. The rake rotates and removes settled sludge from the floor.
4.2. Model validation
Because of practical restrictions and safety considerations, it is difficult to take measurements of effluent TSS from the 30′ high, narrow walkbridge of the clarifier. Therefore, only qualitative validation is performed to compare CFD model prediction and the field observations for the clarifiers so far. A swirling slow-moving current can be observed on the clarifier surface which is consistent with the swirling nature of the flow pathlines shown in . Visual field observations at the Freeport WWTP also show ‘muddy’ water near the overflow weir in the region opposite the feedpipe. This is again consistent with the CFD prediction in , which shows a localized region of high effluent TSS in the region directly opposite the feedpipe.
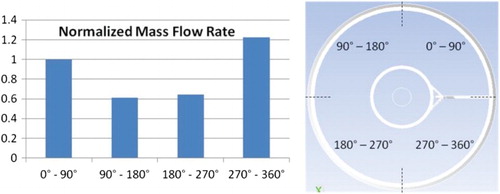
The mass flow rate at different sections of the overflow weir is next quantified. The effluent exiting from the overflow weir is divided into four equal segments (). The corresponding flow rate in each segment (normalized by the flow rate in the 0° to 90° segment) is then obtained from the CFD results. It can be seen that the flow distribution is strongly non-uniform. In fact, there is almost twice as large a flow rate into the overflow weir near the two segments closer to the feedpipe (the 0° to 90° and 270° to 360° segments) as that in the other sections (the 90° to 180° and 180° to 270° segments). The larger flow rates in the segments closer to the feedpipe agree with the field visualizations at the clarifiers, thereby providing additional qualitative validation for the CFD model.
Figure 9. Normalized distribution (w.r.t. flow rate in the 0° to 90° segment) of overflow weir effluent in four segments of the clarifier.
4.3. Ideas for design modifications to improve clarifier performance
A number of clarifier design modification ideas are investigated in this work to improve clarifier performance. The modification ideas are conceptualized with a focus on the feedwell and sludge well region to avoid high-cost modifications.
Three main design modification ideas were analyzed in this study:
Inward Baffle (IB).
Energy-Dissipating Inlet (DPI).
Submerged Skirt (SS).
In the first modification idea, an inward baffle (IB), the width of which is around 10% of the feedwell diameter, is attached to the outlet of the feedwell, angled inward by 45° (). The main motivation for this design is to prevent backflow into the feedwell and to have a more uniform flow distribution. This is a relatively simple geometrical modification and thus the implementation cost is relatively low.
Figure 10. Inward baffle (IB) modification idea for the feedwell.
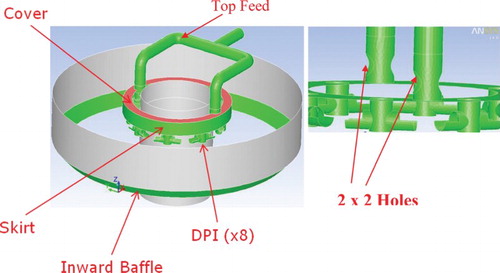
The second design involves a variant of the energy-dissipating inlet (DPI) idea (Esler et al., Citation2001) in which a number of ports are installed below a flow distribution box (). DPIs are attached to the ports and each of them involves a small pipe splitting into two opposite openings. Fluid flows from adjacent pairs of DPIs are directed towards one another and the resulting flow impingement helps to dissipate energy. In this design, the feedpipe is changed to a top feed split to give a more uniform distribution. Furthermore, the design combines with the IB at the bottom of the feedwell for better efficiency. Wastewater enters from the top through the feedpipe. It then splits into two branches of the same size, thereby leading to a 50% reduction in the flow rate in each branch. Finally the flow enters an annular distribution box (skirt) through two horizontal holes near the end of each branch. The outer top surface of the distribution box is covered, whereas eight DPI units are installed beneath the skirt. The feed flow enters those DPI units via the DPI inlets located at the bottom of the distribution box. The feed flow can also enter the feedwell by overflow from the half-opening at the top of the distribution box. This feature helps to further reduce the momentum exiting those DPI outlets. It should also be noted that the shelves in the feedwell are removed in this modification. Furthermore, the inner top half of the distribution box is open in order to force the feed to change direction and dissipate energy. This also helps in partially blocking overflow and forcing more flow to the DPI's.
Figure 11. Energy-dissipating inlet (DPI) + IB modification.
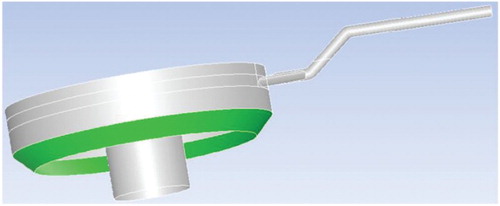
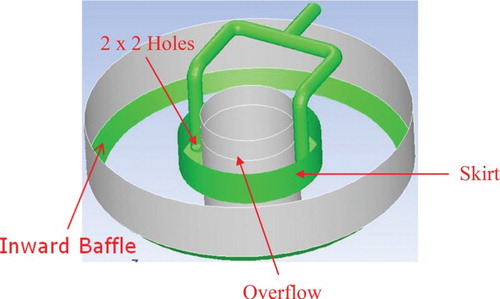
In the third modification (), the feedpipe is again changed to a top feed split to provide a more uniform distribution, just like in the second modification. The main difference is that in this design, the skirt is closed at the bottom surface and is submerged much deeper below the water surface compared to the submergence level of the second modification. The bottom of the skirt is now at the same elevation as the feedwell. In this deep-submerged skirt, the feed flow distributes resulting in energy dissipation, and the flow finally flows over the top of the skirt entering the feedwell. The shelves in the feedwell are also removed in this design, as in the DPI design. The skirt height in this design is around 60% of the depth of the skirt bottom from the water surface. The design also includes an IB at the bottom of the feedwell to prevent backflow into the feedwell.
Figure 12. Submerged skirt (SS) + IB modification.
4.3.1. Design modification simulation results
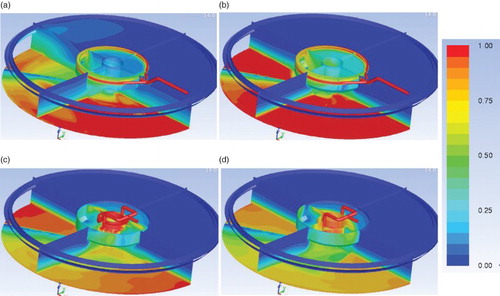
The modified clarifier designs in Figures – are evaluated with 3D unsteady simulations of fluid flow and solid settling. shows the contours of normalized (with respect to inlet concentration) solid concentration on two vertical center planes – the half-floor and half-top surface for the four designs (including the baseline case). The preferred solid concentration contours for a well-designed clarifier should have a low concentration at the top surface and a high solid concentration at the bottom, corresponding to the good settling of solids in the clarifier. The results show that the settling of the solids is much more uniform and symmetric for the three design modifications, which is a key requirement for good clarifier performance. It is seen that the solid concentration near the surface in all three design modifications is significantly less than that in the baseline case. Furthermore, the baseline case shows a localized area of high-effluent TSS in the overflow weir opposite the feedpipe. However, because of the more symmetric flow pattern in all three design modifications, no such localized areas of high-effluent TSS are observed.
Figure 13. Normalized solid concentration contours: (a) Baseline, (b) IB, (c) DPI + IB (inner skirt top open), and (d) SS + IB.
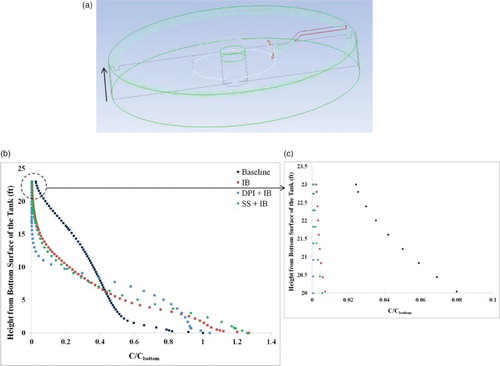
The vertical profile of the solid concentration opposite the feedpipe (normalized by the concentration on the floor) is plotted in for the four designs. Here, the x-axis shows the normalized concentration and the y-axis corresponds to the tank height. Thus, y = 23 corresponds to the tank surface, whereas y = 0 corresponds to the floor. The figure reveals that effluent TSS near the overflow weir (at the top of the clarifier) for the three design modifications are more than 80% less than that in the baseline case, with the best results obtained for the DPI + IB and SS + IB designs. In fact, along the top 3′ of the tank surface, the effluent TSS remains at relatively the same low value for the three design modifications, thereby indicating clear water. On the other hand, the effluent TSS increases rapidly with depth from the tank surface for the baseline case. The best results are obtained in the DPI + IB and SS + IB cases.
Figure 14. Concentration (normalized by concentration on the floor) along the vertical line opposite to the feedpipe: (a) vertical line along which data is plotted, (b) solid concentration along the vertical line, and (c) concentration at the top 3′ of the tank surface.
4.3.2. Benefits of the design modifications
As shown in , the modified designs lead to a more uniform and symmetric flow distribution in the clarifier. Furthermore, they reduce the effluent TSS by over 80% () compared to the baseline case. These designs will therefore also lead to an increase in the wastewater handling capacity of the clarifiers and a reduction in the cost of coagulants and flocculants. Once implemented, the modified designs are thus expected to significantly improve clarifier performance.
5. Conclusions
A 3D unsteady CFD model has been developed in this study to investigate and improve the performance of industrial clarifiers with complex geometries. The numerical model involves the solving of continuity and momentum equations for fluid flow after taking into account the effect of solid concentration on fluid properties. Additionally, a separate transport equation is solved to simulate solid concentration in the clarifier. The settling velocities of the suspended solids are measured in the lab and incorporated into the CFD model. The realizable k-ε model, in conjunction with scalable wall functions, is used to model turbulence. A number of novel contributions have been made in this study. A three-stage modeling approach was developed that allows unsteady coupled simulations of fluid flow and solid concentration in industrial clarifiers in a computationally affordable manner. Furthermore, a numerical technique was developed to model the removal of sludge from a clarifier floor by means of a rotating rake. To the knowledge of the authors, none of the other currently published clarifier papers are able to handle the complexity of rake rotation and sludge removal. This is the first time that a 3D CFD model has been developed for industrial clarifiers with rotating rakes.
The CFD model was first applied to identify the possible root causes for underperformance of the clarifiers in the WWTP in Freeport, TX, and to propose low-cost and low-risk design modifications to improve their performance. The clarifier design was found to create a highly asymmetric flow, resulting in the influent energy not being sufficiently or effectively dissipated in the feedwell. Instead, there is strong backflow (1.75 times the feed flow) into the feedwell. The current geometry also creates high-velocity fluid which exits the feedwell through a reduced area, impinges on the floor, and carries away the settled solid to the overflow weir. All of this leads to poor clarifier performance.
Based on the CFD analysis of the baseline clarifier geometry, various design modification ideas viz. an inward baffle (IB), energy-dissipating inlet and submerged skirt (SS) were evaluated using CFD simulations with aim of improving clarifier performance. These geometry modification ideas (IB, DPI + IB, and SS + IB) have been found to result in a significant improvement in clarifier performance. They create a more uniform distribution and more symmetric flow pattern in the clarifier which helps in the settling of the solid particles. These three designs have been found to reduce the effluent TSS by more than 80% compared to the baseline case. The performance of the IB design is relatively moderate compared to other two design modifications of DPI + IB and SS + IB. However, the implementation cost for the IB is significantly lower and therefore will be implemented in the clarifier in a planned shutdown. The modified designs are also expected to increase the wastewater handling capacity of the clarifiers and reduce the cost of coagulants and flocculants.
It is hoped that the numerical model developed in this study will greatly help researchers to design and optimize complex industrial clarifier geometries with rotating rakes in order to reduce effluent TSS. One limitation of the CFD model is that it does not address the flocculation of solid particles, and thus provides a conservative estimate of clarifier performance. Another limitation of the present CFD model is that it does not include the thermal effects on the settling velocity. Some prior studies (Griborio, Citation2004; Kinnear, Citation2002) indicate that temperature may influence the discrete velocities of solid particles and the compression rate of sludge. Future studies should develop flocculation and thermal sub-models, which can then be incorporated into the present CFD model.
Acknowledgements
The authors would like to thank Christopher Jian, Wu Chen, Karl Jacob, Ray Collins, Leslie Pittser, Ashley Graves, Bobby Hart, and Max Lee for their support and insightful discussions for this study.
Disclosure statement
No potential conflict of interest was reported by the authors.
ORCID
Chunliang Wu http://orcid.org/0000-0002-9697-5560
References
- Abdel-Gawad, S. M., & McCorquodale, J. A. (1985a). Numerical simulation of rectangular settling tanks. Journal of Hydraulic Research, 23, 85–100. doi: 10.1080/00221688509499358
- Abdel-Gawad, S. M., & McCorquodale, J. A. (1985b). Simulation of particle concentration distribution in primary clarifiers. Canadian Journal of Civil Engineering, 12, 454–463. doi: 10.1139/l85-053
- Adams, E. W., & Rodi, W. (1990). Modelling flow and mixing in sedimentation tanks. Journal of Hydraulic Engineering, 116, 895–913. doi: 10.1061/(ASCE)0733-9429(1990)116:7(895)
- Al-Jeebory, A. A., Kris, J., & Ghawi, J. H. (2010). Performance improvement of water treatment plants in Iraq by CFD model. Al-Qadisiya Journal For Engineering Sciences, 3(1), 1–13.
- ANSYS. (2013). FLUENT 14.5 User's Manual.
- Barnard, J., Kunetz, T., & Sobanski, J. (2008). Sixty-five-year old final clarifier performance rivals that of modern designs. Water Science & Technology, 57(8), 1235–1240. doi: 10.2166/wst.2008.224
- Barrett, R., Berry, M. W., Chan, T. F., Demmel, J., Donato, J., Dongarra, J., … Van der Vorst, H. (1994). Templates for the solution of linear systems: Building blocks for iterative methods. Philadelphia, PA: SIAM.
- Battistoni, P. (1997). Pre-treatment, measurement execution procedure and waste characteristics in the rheology of sewage sludges and the digested organic fraction of municipal solid wastes. Water Science and Technology, 36(11), 33–41. doi: 10.1016/S0273-1223(97)00666-5
- Bingham, E. C. (1916). An investigation of the laws of plastic flow. U.S. Bureau of Standards Bulletin, 13, 309–353. doi: 10.6028/bulletin.304
- Bokil, S. D. (1972). Effect of mechanical blending on the aerobic digestion of the waste activated sludge. (PhD Dissertation). Department of Civil and Engineering, University of Windsor, Ontario, Canada.
- Bokil, S. D., & Bewtra, J. K. (1972). Influence of mechanical blending on aerobic digestion of waste activated sludge. Proc. 6th Int. Assoc. on Water Pollution Research and Control 421–438.
- Brouckaer, C. J., & Buckley, C. A. (1999). The use of computational fluid dynamics for improving the design and operation of water and wastewater treatment plants. Water Science and Technology, 40, 81–89. doi: 10.1016/S0273-1223(99)00488-6
- Camp, T. R. (1946). Sedimentation and the design of settling tanks. Transactions of the American Society of Civil Engineers, 111, 895–936.
- Celik, I., Rodi, W., & Stamou, A. (1985). Prediction of hydrodynamic characteristics of rectangular settling tanks. Proceedings of the International Symposium on Refined Flow Modelling and Turbulence Measurements. Iowa City, Iowa, 641–651.
- Choudhury, D. (1993). Introduction to the renormalization group method and turbulence modeling. Fluent Inc. Technical Memorandum TM-107.
- Dahl, C., Larsen, T., & Petersen, O. (1994). Numerical modelling and measurement in a test secondary settling tank. Water Science and Technology, 30, 219–228.
- DeClercq, B. (2003). Computational fluid dynamics of settling tanks: Development of experiments and rheological, settling and scraper submodels. (Dissertation). University of Ghent, Belgium.
- De Cock, W., Blom, P., Vaes, G., & Berlamont, J. (1999). The feasibility of flocculation in a storage sedimentation basin. Water Science and Technology, 39, 75–83. doi: 10.1016/S0273-1223(99)00010-4
- DeVantier, B. A., & Larock, B. E. (1987). Modelling sediment-induced density currents in sedimentation basins. Journal of Hydraulic Engineering, 113, 80–94. doi: 10.1061/(ASCE)0733-9429(1987)113:1(80)
- Dick, R. I., & Young, K. W. (1972). Analysis of thickening performance of final settling tanks. Proeedings of the 27th Industrial Waste Conference. Purdue University, Lafayette, Indiana, 33–54.
- Dobbins, W. E. (1944). Effect of turbulence on sedimentation. Transactions of the American Society of Civil Engineers, 109, 629–656.
- Ekama, G. A., Barnard, J., Gunthert, F., Krebs, P., McCorquodale, J. A., Parker, D. S., & Wahlberg, E. J. (1997). Secondary settling tanks: Theory, modelling, design and operation, International Association on Water Quality, STR No. 6, Richmond, UK.
- Esler, J. K., Hartnett, W. J., & Haug, R. A. (2001). Enhanced flocculation and energy dissipation feedwell assembly for water and wastewater treatment clarifiers. US Patent 6,276,537 B1.
- Ghawi, A. G., & Kriš, J. (2011). Improvement performance of secondary clarifiers by a computational fluid dynamics model. Slovak Journal of Civil Engineering, XIX(4), 1–11. doi: 10.2478/v10189-011-0017-9
- Goula, A. M., Kostoglou, M., Karapantsios, T. D., & Zouboulis, A. I. (2008). A CFD methodology for the design of sedimentation tanks in potable water treatment: Case study: The influence of a feed flow control baffle. Chemical Engineering Journal, 140(1), 110–121. doi: 10.1016/j.cej.2007.09.022
- Griborio, A. (2004). Secondary clarifier modeling: A multi-process approach. (PhD Dissertation). University of New Orleans, USA.
- Griborio, A., Martinez, F., Stanley, E., Koroshec, J., & Coates, D. (2012). Successful clarifier rehabilitation: From CFD modeling, to performance specifications, to compliance-while saving money. Proceedings of the Water Environment Federation 16: 761–768.
- Hazen, A. (1904). On sedimentation. Transactions of the American Society of Civil Engineers, 53, 45–88.
- Huang, X., & Garcia, M. H. (1998). A Herschel–Bulkley model for mud flow down a slope. Journal of Fluid Mechanics, 374, 305–333. doi: 10.1017/S0022112098002845
- Imam, E., McCorquodale, J. A., & Bewtra, J. K. (1983). Numerical modelling of sedimentation tanks. Journal of Hydraulic Engineering, 109, 1740–1754. doi: 10.1061/(ASCE)0733-9429(1983)109:12(1740)
- Kinnear, D. J. (2002). Biological solids sedimentation: A model incorporating fundamental settling and compression properties. (PhD Dissertation). University of Utah, USA.
- Kobayashi, T., & Yoda, M. (1987). Modified k-ε model for turbulent swirling flow in a straight pipe. JSME international journal, 30(259), 66–71. doi: 10.1299/jsme1987.30.66
- Krebs, P. (1991). The hydraulics of final settling tanks. Water Science and Technology, 23, 1037–1046.
- Laine, S., Phan, L., Pellarin, P., & Robert, P. (1999). Operating diagnostics on a flocculator-settling tank using FLUENT CFD software. Water Science and Technology, 39, 155–162. doi: 10.1016/S0273-1223(99)00071-2
- Larsen, P. (1977). On the hydraulics of rectangular settling basins, experimental and theoretical studies. Report no. 1001, Dept of Water Resour Engrg, Lund Inst of Tech, Lund Univ, Lund, Sweden.
- Launder, B. E. (1989). Second-moment closure: Present … and future? International Journal of Heat and Fluid Flow, 10(4), 282–300. doi: 10.1016/0142-727X(89)90017-9
- Launder, B. E., Reece, G. J., & Rodi, W. (1975). Progress in the development of a Reynolds-stress turbulence closure. Journal of Fluid Mechanics, 68(3), 537–566. doi: 10.1017/S0022112075001814
- Launder, B. E., & Spalding, D. B. (1972). Lectures in mathematical models of turbulence. London, England: Academic Press.
- Launder, B. E., & Spalding, D. B. (1974). The numerical computation of turbulent flows. Computer methods in applied mechanics and engineering, 3(2), 269–289. doi: 10.1016/0045-7825(74)90029-2
- Lo, D. (2013). New flocculation centre well design for circular final clarifiers at the Tai Po Sewage Treatment Works. HKIE Transactions, 20(4), 221–229. doi: 10.1080/1023697X.2013.861187
- McCorquodale, J. A., Griborio, A., & Georgiou, I. (2005). A public domain settling tank model. Proceedings of the Water Environment Federation 2546–2561.
- McCorquodale, J. A., Griborio, A., & Georgiou, I. (2006). Application of a CFD model to improve the performance of rectangular clarifiers. Proceedings of the 79th Annual Water Environment Federation Technical Exposition and Conference 310–320.
- McCorquodale, J. A., Griborio, A., Li, J., Horneck, H., & Biswas, N. (2007). Modeling a retention treatment basin for CSO. Journal of Environmental Engineering, 133(3), 263–270. doi: 10.1061/(ASCE)0733-9372(2007)133:3(263)
- McCorquodale, J. A., & Zhou, S. P. (1993). Effect of hydraulic and solids loading on clarifier performance. Journal of Hydraulic Research, 31, 461–478. doi: 10.1080/00221689309498870
- Metzner, A. B., & Reed, J. C. (1955). Flow of non-newtonian fluids—correlation of the laminar, transition, and turbulent-flow regions. AIChE Journal, 1, 434–440. doi: 10.1002/aic.690010409
- Monteiro, P. S. (1997). The influence of the anaerobic digestion process on the sewage sludges rheological behaviour. Water Science and Technology, 36(11), 61–67. doi: 10.1016/S0273-1223(97)00670-7
- Patankar, S. V., & Spalding, D. B. (1972). A calculation procedure for heat, mass and momentum transfer in three-dimensional parabolic flows. International Journal of Heat and Mass Transfer, 15, 1787–1806. doi: 10.1016/0017-9310(72)90054-3
- Ramalingam, K., Gong, M., Xanthos, S., Fillos, J., Beckmann, K., & Deur, A. (2007). Development and validation of a 3-D CFD model for rectangular settling tanks in NYC water pollution control plants. Proceedings of design, operation and economics of large wastewater treatment plants. Vienna, Austria.
- Ramalingam, K., Xanthos, S., Gong, M., Fillos, J., Beckmann, K., Deur, A., & McCorquodale, J. A. (2012). Critical modeling parameters identified for 3D CFD modeling of rectangular final settling tanks for New York city wastewater treatment plants. Water Science & Technology, 65(6), 1087–1094. doi: 10.2166/wst.2012.944
- Rodi, W. (1980). Turbulence models and their application in hydraulics, A state-of-the-art review. Delft, The Netherlands: IAHR.
- Schamber, D. R., & Larock, B. E. (1981). Numerical analysis of flow in sedimentation basins. Journal of the Hydraulic Division, 107, 575–591.
- Shih, T. H., Liou, W. W., Shabbir, A., Yang, Z., & Zhu, J. (1995). A new k-ϵ eddy viscosity model for high reynolds number turbulent flows. Computers & Fluids, 24(3), 227–238. doi: 10.1016/0045-7930(94)00032-T
- Sloan, D. G., Smith, P. J., & Smoot, L. D. (1986). Modeling of swirl in turbulent flow systems. Progress in Energy and Combustion Science, 12(3), 163–250. doi: 10.1016/0360-1285(86)90016-X
- Sozanski, M., Kempa, E., Grocholski, K., & Bien, J. (1997). The rheology experiment in sludge properties research. Water Science and Technology, 36(11), 69–78. doi: 10.1016/S0273-1223(97)00671-9
- Water Pollution Control Federation. (1985). Sludge stabilization, Manual of Practice FD-9 Washington DC.
- White, R. B., Sutalo, I. D., & Nguyen, T. (2003). Fluid flow in thickener feedwell models. Minerals Engineering, 16, 145–150. doi: 10.1016/S0892-6875(02)00252-2
- Xanthos, S., Gong, M., Ramalingam, K., Fillos, J., Deur, A., Beckmann, K., & McCorquodale, J. A. (2011). Performance assessment of secondary settling tanks using CFD modeling. Water Resources Management, 25, 1169–1182. doi: 10.1007/s11269-010-9620-1
- Xanthos, S., Ramalingam, K., Lipke, S., McKenna, B., & Fillos, J. (2013). Implementation of CFD modeling in the performance assessment and optimization of secondary clarifiers: The PVSC case study. Water Science & Technology, 68(9), 1901–1913. doi: 10.2166/wst.2013.280
- Zhou, S., & McCorquodale, J. A. (1992a). Influence of skirt radius on performance of circular clarifier with density stratification. International Journal for Numerical Methods in Fluids, 14, 919–934. doi: 10.1002/fld.1650140804
- Zhou, S., & McCorquodale, J. A. (1992b). Mathematical modelling of a circular clarifier. Canadian Journal of Civil Engineering, 19, 365–374. doi: 10.1139/l92-044
- Zhou, S., & McCorquodale, J. A. (1992c). Modelling of rectangular settling tanks. Journal of Hydraulic Engineering, 118, 1391–1405. doi: 10.1061/(ASCE)0733-9429(1992)118:10(1391)
- Zhou, S., McCorquodale, J. A., Richardson, J., & Wilson, T. (2005). State of the art clarifier modeling technology – Part II. WEFTEC, Washington DC.