
ABSTRACT
This paper presents the simulated and experimental results of propeller-rudder systems with propeller boss cap fins (PBCFs) and analyzes the hydrodynamic performance of PBCFs in propeller-rudder systems. The purpose is to study the impact of PBCFs on the hydrodynamic performance of rudders. Hydrodynamic experiments were carried out on propeller-rudder systems with PBCFs in a cavitation tunnel. The experimental energy-saving effect of the PBCF without a rudder was 1.47% at the design advance coefficient J = 0.8. The numerical simulation was based on the Navier–Stokes equations solved with a sliding mesh and the SST (Shear Stress Transfer) k-ω turbulence model. After the grid independence analysis, the flow fields of an open-water propeller with and without a PBCF were compared, then the efficiencies of the propulsion systems including different rudders and the thrust coefficient Kr of rudders were analyzed. The results indicate that the installation of a PBCF increases the resistance of the rudder, which results in a reduction in the energy-saving effect of the PBCF. At the design advance coefficient, the energy-saving effect of the PBCF with an ordinary rudder and a twisted rudder decreases from 1.47% to 1.08% and 1.16%, respectively; thus, it is important to factor in the rudder of a propulsion system when evaluating the energy-saving effects of PBCFs .
1. Introduction
The International Maritime Organization (IMO) proposed the Energy Efficiency Design Index (EEDI) due to the need for improved fuel efficiency, low emissions and optimized operation. Enhancement of propulsion performance is one of the easiest and most efficient methods of attaining the required EEDI standards. Thus, interest in energy-saving devices (ESDs) has steadily increased.
Propeller boss cap fins (PBCFs), developed in 1987 by Mitsui O.S.K. Lines, Ltd., are ESDs installed onto the hub cap. PBCFs have plenty of advantages, including their simple structure, low probability of failure and cost saving, as well as being suitable for applying to existing vessels (Li, Zhou, & Dong, Citation2014). A series of PBCF experiments were conducted by the Shanghai branch of the CSIC Institute. The energy-saving effect of the experimental PBCFs was more than 2%, and could reach 3% to 4% when the PBCFs were applied to real ships. A laser Doppler velocimeter (LDV) was used to observe the wake field, and the velocity field distributions were obtained before and after the installation of the PBCFs. Model experiments with ducted propellers with PBCFs were conducted by Tamura (Citation2010), and the key parameters of the PBCFs were optimized. The results showed that the optimized PBCFs were able to increase the hydrodynamic performance of a ducted propeller by 1.5% or more, on top of the energy-saving effect due to the optimization of the duct. The results of more systematic experiments were published by Nojiri, Ishii, and Kai (Citation2011) for four-, five- and six-bladed propellers. The measured increase of the propeller efficiency was from 1% to 1.5%. The Joint Industry Project (JIP; Dang et al., Citation2011) started by MARIN (Maritime Research Institute Netherlands) conducted a research on the flow field distribution and energy-saving mechanisms of PBCFs, and particle image velocimetry (PIV) was used in the experiment. The results showed that the velocity around the hub vortex decreases. Accordingly, the propeller efficiency and cavitation performance were improved. Ma, Cai, and Qian (Citation2014) optimized the design method of PBCFs and an integrative design method of a propeller with a PBCF was adopted to improve propulsion efficiency. The results proved that their method was effective, reliable and practical. The PBCFs designed by the integrative method had a higher efficiency. Lim, Kim, Lee, Kang, and Kim (Citation2014) studied the parameters of hub with PBCF. The propeller open-water test results show that the hub radius has a great impact on the energy-saving effect of PBCF. A mismatching hub can decrease the propulsive efficiency and cavitation performance significantly.
In recent years, computational fluid dynamics (CFD) techniques have been employed more and more extensively for analyzing the performance of hydrodynamic systems (Carlton, Radosavljevic, & Whitworth, Citation2009; Carrica, Fu, & Stern, Citation2011; Dubbioso, Muscari, & Mascio, Citation2014; Lam, Hamill, & Robinson, Citation2013; Lam, Robinson, Hamill, & Johnston, Citation2012; Shamsi, Ghassemi, Molyneux, & Liu, Citation2014), designing propeller ESDs (Çelik, Citation2007; Lee, Bae, Kim, & Hoshino, Citation2014; Park, Jung, & Kim, Citation2005) and simulating the cavitation (Rafael et al., Citation2015; Singhal, Athavale, Li, & Jiang, Citation2002; Watanabe, Kawamura, Yoshihisa, Maeda, & Rhee, Citation2003; Zhu & Fang, Citation2012). The International Towing Tank Conference (ITTC) discussed applications of the CFD method to calculating the hydrodynamic performance of propellers and believed that it could be used to obtain the open-water performance and pressure distribution of a propeller accurately (Salvatore, Streckwal, & Terwisga, Citation2009).
Xiong, Wang, and Qi (Citation2013) calculated the influence of PBCFs on controllable pitch propellers using CFD, determining the optimal parameters and analyzing its energy-saving mechanism by observing the path lines around the hub. Kawamura, Ouchi, and Nojiri (Citation2012) conducted model experiments on different scales and found out that the impact of PBCFs is different at different Reynolds numbers. By contrast with the results from a ship model, the propeller efficiency of the real ship was improved more significantly and the influencing factors included scale effect, interference of ship hull and rudder, the surface roughness of the propeller and the cavitation of the hub vortex.
In previous studies, the energy-saving effects of PBCFs were investigated, while the influence of PBCFs on rudders were ignored. In the present study, a cavitation tunnel experiment was conducted to obtain the hydrodynamic performance coefficients of a propeller with a PBCF. In order to determine the impact of PBCFs on the hydrodynamic performance and flow field distributions of propulsion systems with rudders, an ordinary rudder and a twisted rudder were introduced into the cavitation tunnel experiment and numerical simulation. The pressure distribution and vortex distribution were then compared in detail, and the energy-saving mechanism of the PBCF was analyzed and discussed.
2. Experimental models and test conditions
2.1. Major parameters of the models
A propeller with its matching PBCF, an ordinary rudder, a twisted rudder and some other accessories were used in the cavitation tunnel experiment.
2.1.1. The propeller model and its matching PBCF
In the experiments, a model of the 3500TEU container ship propeller shown in was used. It is made of aluminum and its major parameters are reported in . The PBCF model is shown in and its main characteristics are also listed in .
Figure 1. Experimental propeller model: (a) suction side, and (b) pressure side.
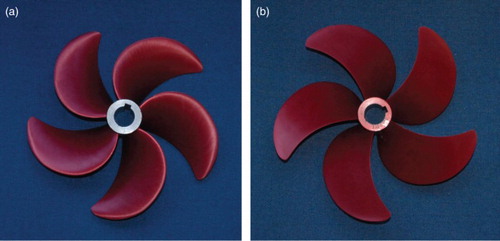
Figure 2. PBCF model and hub cap.
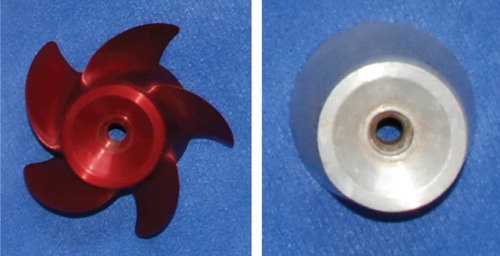
Table 1. Major parameters of the propeller and PBCF.
2.1.2. Rudder models
shows a picture of the rudder models. The twisted rudder was created by twisting the rudder sections of the former 40% chord length. The distance between the end surface of the hub cap and the rudder shaft is 140 mm. The remaining parameters of the rudder models are given in , where the projection shape is the rudder outline projected onto the symmetry plane.
Figure 3. Experimental rudder models: (a) twisted rudder, and (b) ordinary rudder.
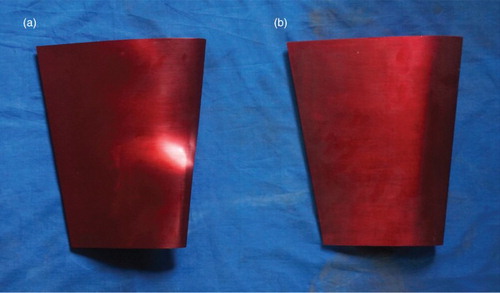
Table 2. Major parameters of rudder models.
2.2. Test conditions in the cavitation tunnel experiment
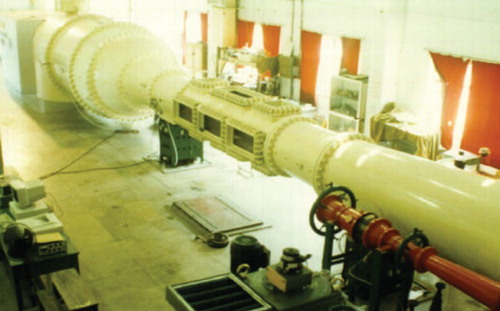
The experiment was carried out in the cavitation tunnel shown in . The working section of the cavitation tunnel is a cylinder that is 3.2 m in length, and the propeller is located at 2 m in the axial direction. At the front and back of the working section there are transition sections, the radius of which increases gradually. The diameter of the tunnel section is 0.8 m and the maximum width of the experimental model is 0.4 m. Therefore, the blockage effect is not taken into account. In addition, the adjustment ranges of the flow velocity and pressure in the tunnel are 3 m/s to 20 m/s and 8 kpa to 400 kpa, respectively.
Figure 4. Cavitation tunnel.
2.2.1. Hydrodynamic performance measurement of the propeller with and without a PBCF
The propeller and hub cap were installed in the tunnel without a rudder, and the thrust and torque of the propeller were measured. At atmospheric pressure, the advance coefficient J of tests ranged from 0.45 to 1.00 and increased by 0.05 for each measurement. The fluid velocity VA in the cavitation tunnel was 4 m/s. The velocity of the propeller along the rotation axis was 0 m/s, and the advance coefficient J was changed by varying the propeller's rotational speed. After the data acquisition was finished, the PBCF was installed and the above operations were repeated again.
2.2.2. Hydrodynamic performance measurement of the propeller-rudder interactions
The distance between the rudder shaft and the end surface of the hub cap was 140 mm, and the force on ordinary/twisted rudder was obtained by the self-made force balance beside the thrust and torque of the propeller. This step had the same advance coefficients as those in the previous step.
2.2.3. Hydrodynamic performance measurement of the propeller-PBCF-rudder interactions
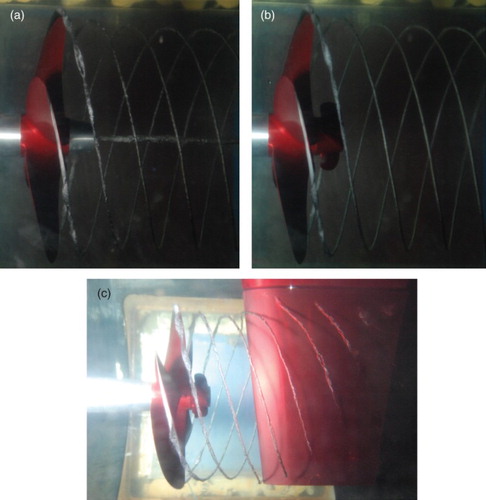
The hub cap from the previous step was replaced with the PBCF. After all data acquisition was finished, the entire experiment was completed. Photographs of experiment are shown in .
Figure 5. Cavitation tunnel experiment, (a) with propeller, (b) with propeller and PBCF, and (c) with propeller, PBCF and rudder.
3. Numerical method
The flow simulation of this paper was carried out by using the solution technique implemented in Fluent (v.6.3.26) (Lam, Robinson, Hamill, & Johnston, Citation2012). The details are as follows.
3.1. Governing equations and turbulence model
Motion-compliant continuity and the momentum conservation equations for incompressible Newtonian fluid motion are as follows:
(1)
(2) where ui and uj are the time-averaged values (i, j = 1,2,3) of the velocity component, p is the time-averaged pressure, ρ is the fluid density, μ is the dynamic viscosity coefficient,
is the Reynolds stress term, and Si is the source item.
This study applied the SST k-ω model (Liang & Xue, Citation2014; Travin, Shur, Strelets, & Spalart, Citation2002) to the task of analyzing the hydrodynamic performance of the PBCF. In all simulations which were run by using the pressure-based solver, the SIMPLEC algorithm was applied for pressure-velocity coupling, with PRESTO used for pressure discretization and second-order upwind discretization for momentum, turbulent kinetic energy and the specific dissipation rate. A sliding mesh technique was applied to simulating the unsteady rotation motion of the propeller, and 180 iterations were completed during every single revolution. The time step ranged from 1.5 × 10⁻⁴ s to 3.8 × 10⁻⁴ s with different propeller rotational speeds.
By simulating the unsteady interference between the propeller and rudder under the same test conditions, the thrust T and torque Q as a function of the advance coefficient were obtained. The hydrodynamic performance coefficients of the propulsion system were calculated according to the following formulas:
(3) where Kt and Kr are the thrust coefficients of the propeller with or without a PBCF and a rudder, Ka is the thrust coefficient of the entire propulsion system, Kq is the torque coefficient of propeller, η and ηa are the efficiencies of the propulsion system without and with a rudder, respectively, TP represents the thrust generated by the propeller including PBCF, TR represents the thrust generated by the rudder, Q is the torque of propeller, ρ is the fluid density, n is the propeller rotational speed, D is the diameter of the propeller disk, and J is the advance coefficient.
3.2. Meshing of the computational domain
The entire computational domain is divided into three coaxial cylinder domains. The diameters of the three domains are different, and the division of domains is shown in a. The origin of the coordinate is located at the center of the propeller disk, and the coordinate systems in the following figures only stand for the directions of the axes. Domain 1 involves the entire flow field area. It is made up of structured hexahedral grids, and its diameter is 3.2 times the propeller diameter D. The flow in the working section before the propeller is uniform, so the distance between the inlet and the propeller disk was shortened to 3.2D in order to reduce the dimensions of the numerical model. Due to the transition section behind the end of the working section, the actual outlet is far behind the working section. Therefore, the distance between the propeller disk and the outlet is set to 8D to ensure the full development of the flow field. Domains 2 and 3 are where the rudder and propeller are located. Unstructured tetrahedral grids are used in the two domains and the grids of the rudder edges and propeller blades are refined. When the hydrodynamic performance of the propeller with no rudder is calculated, Domain 2 includes no rudder model. The solid boundaries of the propulsion system follow the non-slip boundary conditions, and the parameters of the solid boundary are the default values. The fluid velocity VA in the domains is 4 m/s along the X-axis positive, and the advance coefficient J is changed by varying the propeller rotational speed. In the experiments and numerical simulations, the same parameters were applied and the Reynolds numbers is about 3 × 10⁶.
Figure 6. Mesh for the calculation model (medium grids): (a) volume mesh of the entire area, (b) surface mesh of the propulsion system, and (c) prism layer mesh.
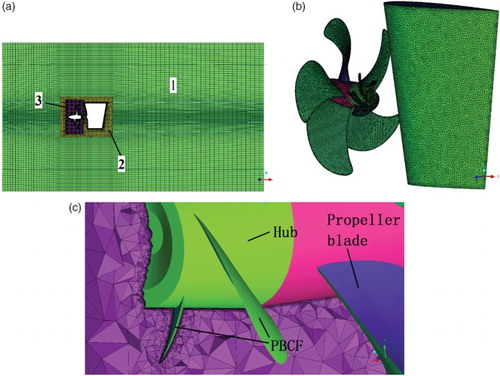
The surface meshes of the propeller-rudder system with a PBCF are shown in b. Three meshes of varying resolution were generated for grid-independent validation. The medium and fine grids were generated by reducing the global cell size of the mesh by 25% and 50%, respectively. In the scheme of the medium grid, the maximum mesh sizes of the blade surfaces, blade edges, fins, hub end and hub surface are 2 mm, 1 mm, 1 mm, 1 mm and 4 mm. The maximum mesh size in Domain 3 is 10 mm. The height ratio of the mesh sizes is 1.4 in Domain 3. Layer meshes are required for simulating turbulence, especially at high Reynolds numbers (Wang, Su, Wang, Zhu, & Liu, Citation2014). To keep y+ values on the model surface from 30 to 60 (Ji, Luo, Peng, Wu, & Xu, Citation2012; Zhu & Fang, Citation2012), the thickness of the first prismatic layer mesh shown in c is set to 0.0001D with a stretching factor of 1.10. There are 10 prismatic layers, and the total thickness of prismatic layers is 0.4 mm. A summary of the key mesh parameters is presented in .
Table 3. Details of mesh parameters (Propulsion system with PBCF).
3.3. Grid independence analysis
The efficiencies of the propeller made of ordinary rudder computed with the coarse, medium and fine grids were compared with each other. The efficiency results of the three grid schemes shown in coincide reasonably well, so the increased mesh density had little impact on the efficiency calculations for the propulsion systems.
Table 4. Efficiency results of the three grid schemes.
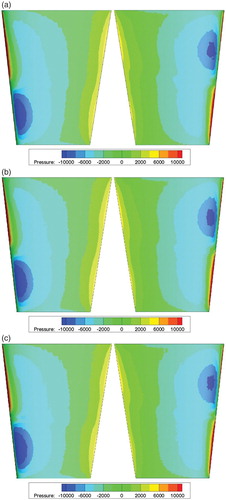
As a further support of the reliability of the medium grid results in capturing the main features of the propulsion flow field, the pressure distribution on faces of the blades and rudders is depicted in Figures and . It can be appreciated that the pressure distribution is very similar, so the increased mesh density has little impact on capturing the flow field distribution of the propulsion system. Therefore, the scheme of the medium grid was applied to the calculations reported in this paper.
Figure 7. Pressure distribution of the propeller blade (J = 0.8) for (a) suction side (coarse grids), (b) pressure side (coarse grids), (c) suction side (medium grids), (d) pressure side (medium grids), (e) suction side (fine grids), and (f) pressure side (fine grids).
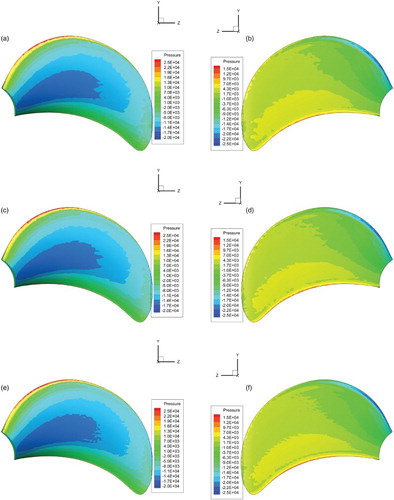
Figure 8. Pressure distribution of rudder (J = 0.8) for (a) coarse grids, (b) medium grids, and (c) fine grids.
4. Hydrodynamic performance analysis of PBCF
4.1. Comparison of experimental and calculated results
The calculated and experimental values were plotted and compared (Figures and ).
Figure 9. Contrast of hydrodynamic performance coefficients for (a) propeller without PBCF, and (b) propeller with PBCF.
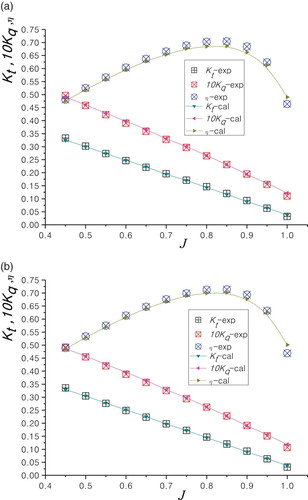
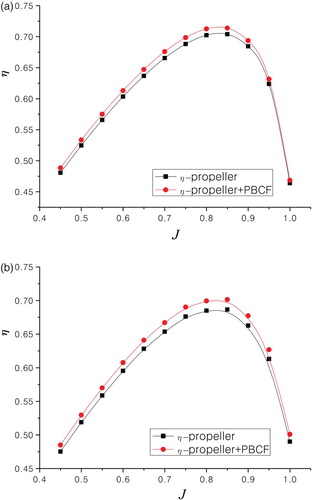
Figure 10. Efficiency contrast of propulsion for (a) experimental values, and (b) calculated values.
In Figures and , there are certain differences between the experimental and calculated values of the thrust coefficient, torque coefficient and propulsive efficiency. In the range of the calculated advance coefficients, the curves of Kt and 10Kq are in good agreement. When J = 0.8, errors of Ka and 10Kq obtained by the two methods are both less than 2.5%. Therefore, the reliability of the numerical method to forecast the hydrodynamic performance of a propeller with a PBCF is verified.
The efficiencies of the two propulsion systems indicate that the hydrodynamic performance of a propeller with a PBCF is better. The torque coefficient decreases and the efficiency increases due to the installation of the PBCF. The variation ranges of Kt, 10Kq and η are −1.89%∼0.75%, −2.88%∼−0.88% and 1.02%∼1.65%, and the energy-saving effect of the PBCF is 1.47% at the design advance coefficient J = 0.8.
4.2. Comparison of the velocity distribution after the propeller
The simulated results were introduced into TECPLOT, and the plane at X = 0.32D behind the propeller was intercepted. The velocity distribution in this plane is shown in . The contours represent the axial velocity magnitude, and the vectors represent the velocity magnitude and the direction of the plane.
Figure 11. Velocity distribution at X = 3.2D (J = 0.8) for (a) propeller without PBCF, and (b) propeller with PBCF.
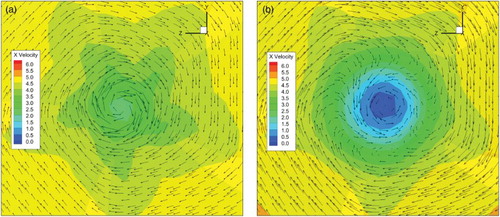
shows that the velocity distribution changes significantly at the plane center, and the result is similar to the result obtained by PIV (Dang et al., Citation2011). Due to the installation of the PBCF, the axial and rotational velocity magnitude at the plane center reduces, and there is even a small amount of reverse rotation.
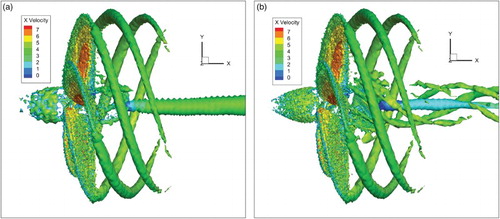
4.3. Comparison of vortical structures
The vortical structures at 0.15 s (3 times the propeller rotation period) are shown in . The tip vortex generated by the rotation of the blades with and without the PBCF is almost the same, while the structures of the hub vortex shrink a lot. In addition, a small amount of PBCF tip vortex is generated, and with the gradual steadying of the flow field, the tip vortex disappears rapidly. After the introduction of the rudder model, the tip vortex of the fins has an impact on its hydrodynamic performance and results in an efficiency reduction in the propulsion system.
Figure 12. Isosurfaces of Q = 5000 colored with axial velocity (J = 0.8) for (a) propeller without PBCF, and (b) propeller with PBCF.
5. Impact analysis of the PBCF on propeller-rudder systems
In order to analyze the energy-saving mechanism of PBCFs with rudders, four kinds of propulsion system were studied in the cavitation tunnel experiments and numerical models.
5.1. Comparison of experimental and calculated values
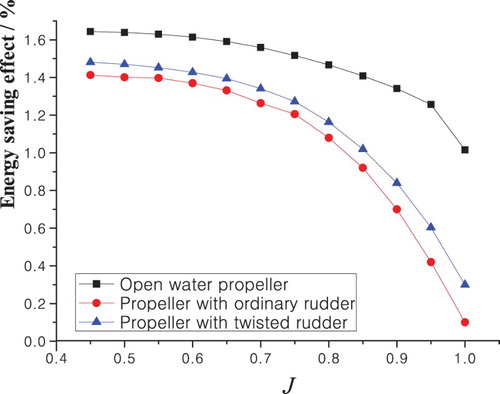
shows the hydrodynamic performance coefficients of the four propulsion systems. When J = 0.8, all the errors of system efficiency are less than 4.0%. Therefore, the reliability of the numerical simulation can be proved. The efficiencies of the propeller, the propeller with an ordinary rudder and the propeller with a twisted rudder increase as a result of installing the PBCF and the energy-saving effect is shown in . The energy-saving effect reduces with the increase of the advance coefficient J, but after the installation of a rudder, the effect decreases. When J = 0.8, the efficiency of the propeller, the propeller with an ordinary rudder and the propeller with a twisted rudder increases by 1.47%, 1.08% and 1.16%, respectively. The energy-saving effect of the PBCF is better with the twisted rudder, which shows that the rudder influences the effect of the PBCF significantly. Therefore, an appropriate rudder can improve the energy-saving effect of a PBCF being added to a propulsion system.
Figure 13. Contrast of hydrodynamic performance coefficients for (a) propeller and ordinary rudder, (b) propeller, PBCF and ordinary rudder, (c) propeller and twisted rudder, and (d) propeller, PBCF and twisted rudder.
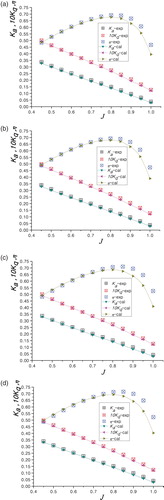
Figure 14. Energy-saving effect of the PBCF.
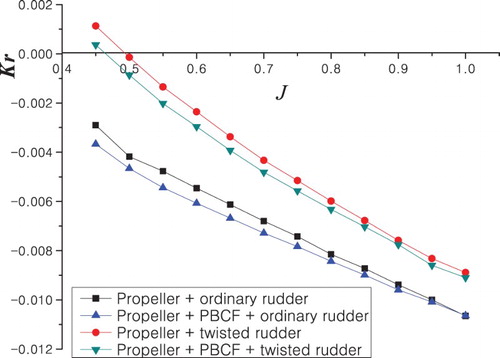
A negative thrust is generated by the rudder which decreases the total thrust of the propulsion system. In order to improve the propulsion performance, Kr values should be increased. Due to the interference of the PBCF, the Kr values decrease gradually () which results in a decrease in the energy-saving effect. The hydrodynamic performance of the rudder should be considered when the energy-saving effect is calculated. In addition, it is shown that whether or not there is a PBCF, the thrust coefficients of he twisted rudder are higher, and the twisted rudder can produce a positive thrust when J is less than 0.5. Therefore, with the twisted rudder, the propulsion system has a greater thrust and the PBCF has a better energy-saving effect. The results indicate that the hydrodynamic performance of the twisted rudder is better.
Figure 15. Kr curves of rudders in four propulsion systems.
5.2. Comparison of the pressure distribution at Z = 0
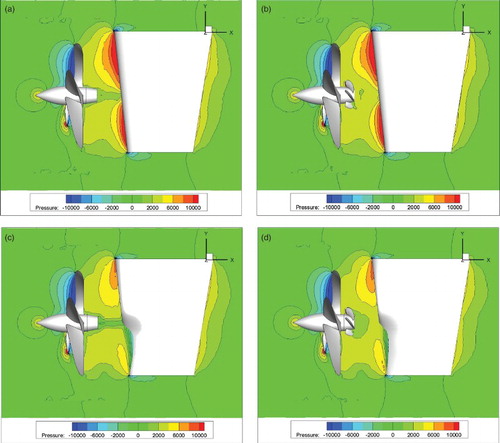
Pressure distributions of the four propulsion systems at Z = 0 are shown in . Obviously, after the PBCF is installed, the pressure behind the hub end changes, which results in an increase in the rudder resistance and a decrease in the energy-saving effect. In addition, after the ordinary rudder was replaced with the twisted rudder, the pressure before the leading edge reduced significantly, but the pressure in the other locations changed very little. Therefore, the resistance of the twisted rudder is less.
Figure 16. Pressure distribution at Z = 0 (J = 0.8) for (a) propeller and ordinary rudder, (b) propeller, PBCF and ordinary rudder, (c) propeller and twisted rudder, and (d) propeller, PBCF and twisted rudder .
5.3. Comparison of the vortex intensity behind the propeller
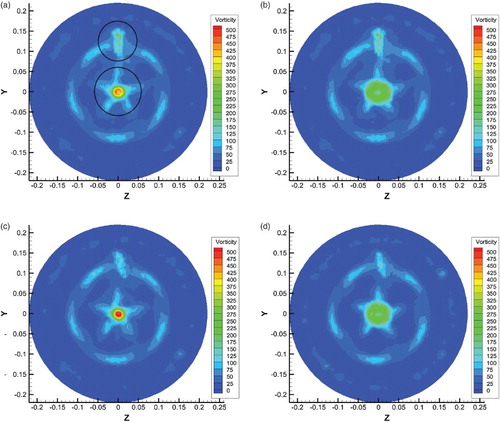
To analyze the flow field of propulsion systems, vortex intensities of Plane A (X = 0.3D) and Plane B (X = 1.2D) were compared. The locations of the two planes are shown in .
Figure 17. Planes for comparison of vortex intensity distribution.
The vortex intensity distribution of Plane A is shown in , and significant changes in the vortex are highlighted. After the ordinary rudder was replaced with the twisted rudder, the vortex intensity around the leading edge reduced. The vortex intensity of the propeller with a PBCF behind the hub decreases compared to the propeller, while with the high-speed rotation of the PBCF, the tip vortex intensity produced by the fins increases.
Figure 18. Vortex intensity distribution of Plane A (J = 0.8) for (a) propeller and ordinary rudder, (b) propeller, PBCF and ordinary rudder, (c) propeller and twisted rudder, and (d) propeller, PBCF and twisted rudder.
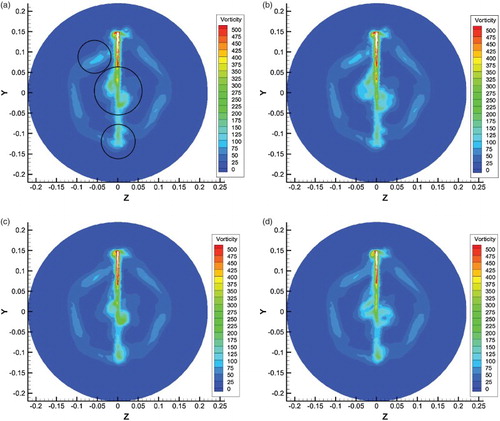
The vortex intensity distribution of Plane B is shown in . The tip vortex intensity of the propeller blades reduces after the propeller wake passes by the twisted rudder, and the vortex intensity near the lower end of the twisted rudder is smaller. After the PBCF installed, the hub vortex contours expand outward. Considering the above changes, the PBCF can improve the flow field of a propulsion system, and if the flow field behind the fins can be optimized, the system efficiency will be further improved.
Figure 19. Vortex intensity distribution of Plane B (J = 0.8) for (a) propeller and ordinary rudder, (b) propeller, PBCF and ordinary rudder, (c) propeller and twisted rudder, and (d) propeller, PBCF and twisted rudder.
6. Conclusion
In order to analyze the influence of PBCFs on the hydrodynamic performance of propeller-rudder systems, a numerical simulation and a cavitation tunnel experiment were conducted, and the results were compared. The conclusions are as follows:
There are some differences between the experimental and calculated values of the thrust coefficient Kt, the torque coefficient Kq and the propulsive efficiency η. In the range of the calculated advance coefficients, the curves of Kt and 10Kq are all in good agreement. Therefore, the simulation's reliability in forecasting the hydrodynamic performance of a propeller-rudder system is verified. The hydrodynamic performance becomes better with a PBCF, and the energy-saving effect of a PBCF is 1.47% at the design advance coefficient J = 0.8.
The energy-saving effect reduces with increases in the advance coefficient J. After the installation of a rudder, the effect also decreases. When J = 0.8, the energy-saving effect of the PBCF with an ordinary rudder and a twisted rudder decreases to 1.08% and 1.16%, respectively.
The PBCF reduces the axial and rotational velocity magnitude behind the fins and hub. A small amount of PBCF tip vortex is generated, and with the gradual steadying of the flow field, the tip vortex disappears rapidly. After the introduction of rudder models, the reduced velocity causes a pressure increase before the leading edge of rudders, which decreases their energy-saving effect.
After an ordinary rudder is replaced with a twisted rudder, the vortex intensity before the leading edge and the tip vortex intensity of the propeller blades reduces after the propeller wake passing by the twisted rudder. This is why the PBCF has a better energy-saving effect in a propulsion system that uses a twisted rudder.
An appropriate rudder type can improve the energy-saving effect of installing a PBCF. It is important to factor in the rudder of a propulsion system when evaluating the energy-saving effects of PBCFs.
The energy-saving effect of the PBCF decreases in front of a rudder, but it can be increased further by using a twisted rudder, in addition to the effects of replacing an ordinary rudder with a twisted one. Therefore, an investigation into propeller-PBCF-rudder interactions is essential, and the research on ESDs to reduce the influence of the PBCF tip vortex on rudders will be continued in future work.
ACKNOWLEDGEMENTS
The work presented here was supported financially by the National Natural Science Foundation of China [Grant No. 551009038] and the China Postdoctoral Science Foundation [Grant No. 2013M540271].
Disclosure statement
No potential conflict of interest was reported by the authors.
References
- Carlton, J., Radosavljevic, D., & Whitworth, S. (2009 June). Rudder-propeller-hull interaction: The results of some recent research, in-service problems and their solutions. First International Symposium on Marine Propulsors, Trondheim, Norway.
- Carrica, P. M., Fu, H. P., & Stern, F. (2011). Computations of self-propulsion free to sink and trim and of motions in head waves of the KRISO Container Ship (KCS) model. Applied Ocean Research, 33(4), 309–320. doi:10.1016/j.apor.2011.07.003
- Çelik, F. (2007). A numerical study for effectiveness of a wake equalizing duct. Ocean Engineering, 34(16), 2138–2145. doi:10.1016/j.oceaneng.2007.04.006
- Dang, J., Chen, H., Dong, G., Ploeg, A. V., Hallmann, R., & Mauro, F. (2011 October). An exploratory study on the working principles of Energy Saving Devices (ESDs). Symposium on Green Ship Technology, Wuxi, China.
- Dubbioso, G., Muscari, R., & Mascio, A. D. (2014). Analysis of a marine propeller operating in oblique flow. Part 2: Very high incidence angles. Computers & Fluids, 92, 56–81. doi:10.1016/j.compfluid.2013.11.032
- Ji B., Luo, X. W., Peng, X. X., Wu, Y. L., & Xu, H. Y. (2012). Numerical analysis of cavitation evolution and excited pressure fluctuation around a propeller in non-uniform wake. International Journal of Multiphase Flow, 43, 13–21. doi:10.1016/j.ijmultiphaseflow.2012.02.006
- Kawamura, T., Ouchi, K., & Nojiri, T. (2012). Model and full scale CFD analysis of propeller boss cap fins (PBCF). Journal of Marine Science and Technology, 17(4), 469–480. doi:10.1007/s00773-012-0181-2
- Lam, W. H., Hamill, G. A., & Robinson, D. J. (2013). Initial wash profiles from a ship propeller using CFD method. Ocean Engineering, 72, 257–266. 10.1016/j.oceaneng.2013.07.010 doi: 10.1016/j.oceaneng.2013.07.010
- Lam, W. H., Robinson, D. J., Hamill, G. A., & Johnston, H. T. (2012). An effective method for comparing the turbulence intensity from LDA measurements and CFD predictions within a ship propeller jet. Ocean Engineering, 52, 105–124. doi:10.1016/j.oceaneng.2012.06.016
- Lee, K. J., Bae, J. H., Kim, H. T., & Hoshino, T. (2014). A performance study on the energy recovering turbine behind a marine propeller. Ocean Engineering, 91, 152–158. doi:10.1016/j.oceaneng.2014.09.004
- Liang, Z. C., & Xue, L. P. (2014). Detached-eddy simulation of wing-tip vortex in the near field of NACA 0015 airfoil. Journal of Hydrodynamics, Ser. B, 26(2), 199–206. doi:10.1016/S1001-6058(14)60022-6
- Lim, S. S., Kim, T. W., Lee, D. M., Kang, C. G., & Kim, S. Y. (2014). Parametric study of propeller boss cap fins for container ships. International Journal of Naval Architecture and Ocean Engineering, 6(2), 187–205. doi:10.2478/ijnaoe-2013-0172
- Li, P. C., Zhou, W. X., & Dong, S. T. (2014). A design method of Propeller Boss Cap Fins (PBCF). ShipBuilding of China, 55(1), 19–27. doi:10.1016/S1001-6058(14)60066-4
- Ma, C., Cai, H. P., & Qian, Z. F. (2014). The design of propeller and propeller boss cap fins (PBCF) by an integrative method. Journal of Hydrodynamics, 26(4), 586–593. doi:10.1016/S1001-6058(14)60066-4
- Nojiri, T., Ishii, N., & Kai, H. (2011). Energy saving technology of PBCF (propeller boss cap fins) and its evolution. Journal of The Japan Institute of Marine Engineering, 46(3), 350–358. doi:10.5988/jime.46.350
- Park, W. G., Jung, Y. R., & Kim, C. K. (2005). Numerical flow analysis of single-stage ducted marine propulsor. Ocean Engineering, 32(10), 1260–1277. 10.1016/j.oceaneng.2004.10.022 doi: 10.1016/j.oceaneng.2004.10.022
- Rafael, C. A., Farid, B., Alfonso, C. A., Sofiane, K., Manuel, P. G., & Robert, R. (2015). Numerical analysis of unsteady cavitating flow in an axial inducer. Applied Thermal Engineering, 75, 1302–1310. doi:10.1016/j.applthermaleng.2014.07.063
- Salvatore, F., Streckwall, H., & Terwisga, T.V. (2009 June). Propeller Cavitation Modelling by CFD - Results from the VIRTUE 2008 ROME Workshop. First International Symposium on Marine Propulsors, Trondheim, Norway.
- Shamsi, R., Ghassemi, H., Molyneux, D., & Liu, P. F. (2014). Numerical hydrodynamic evaluation of propeller (with hub taper) and podded drive in azimuthing conditions. Ocean Engineering, 76, 121–135. 10.1016/j.oceaneng.2013.10.009 doi: 10.1016/j.oceaneng.2013.10.009
- Singhal, A. K., Athavale, M. M., Li, H., & Jiang, Y. (2002). Mathematical basis and validation of the full cavitation model. Journal of Fluids Engineering, 124(3), 617–624. doi:10.1115/1.1486223
- Tamura, Y. (2010 June). Development of a high performance ducted propeller. Tenth International Conference on Intelligent Tutoring Systems, Pittsburgh, United States, 1–8.
- Travin, A., Shur, M., Strelets, M., & Spalart, P. R. (2002). Physical and numerical upgrades in the detached-eddy simulation of complex turbulent flows. Fluid Mechanics and Its Applications, 65, 239–254. doi:10.1007/0-306-48383-1_16
- Wang, S., Su, Y. M., Wang, Z. L., Zhu, X. G., & Liu, H. X. (2014). Numerical and experimental analyses of transverse static stability loss of planning craft sailing at high forward speed. Engineering Applications of Computational Fluid Mechanics, 8(1), 44–54. doi:10.1080/19942060.2014.11015496
- Watanabe, T., Kawamura, T., Yoshihisa, T., Maeda, M., & Rhee, S. H. (2003 November). Simulation of steady and unsteady cavitation on a marine propeller using a RANS CFD code. Fifth International Symposium on Cavitation, Osaka, Japan, 1–8.
- Xiong, Y., Wang, Z. Z., & Qi, W. J. (2013). Numerical study on the influence of boss cap fins on efficiency of controllable-pitch propeller. Journal of Marine Science and Technology, 12(1), 13–20. doi:10.1007/s11804-013-1166-9
- Zhu, Z. F., & Fang, S. L. (2012). Numerical investigation of cavitation performance of ship propellers. Journal of Hydrodynamics, Ser. B, 24(3), 347–353. 10.1016/S1001-6058(11)60254-0 doi: 10.1016/S1001-6058(11)60254-0