
ABSTRACT
A new split and recombine (SAR) passive micromixer, namely the H-C mixer, is presented. The performance of the micromixer is analyzed numerically at Reynolds numbers up to 100, varying the inlet flow-rate ratio. In order to validate the numerical model, tests for an inlet flow-rate ratio of 1 were carried out on the new H-C micromixer along with the established Tear-drop and Chain micromixers for comparison, and good correspondence was found between the differently obtained data. Contrary to the Tear-drop and Chain micromixers, the H-C micromixer exhibited a mixing efficiency greater than 90% independent of Reynolds numbers. In particular, no noticeable dependence on inlet flow-rate ratio was observed. Furthermore, the pressure drop along the H-C mixer was found to be lower than those along the already known mixers.
Nomenclature
| CFD | = | computational fluid dynamics |
| PSM | = | plate symmetrical module |
| Re | = | Reynolds number |
| SAR | = | split and recombine |
| C | = | species mass concentration |
| Ci | = | mass fraction of a sample cell i |
| Cm | = | mean mass fraction |
| d | = | length of micromixer, m |
| D | = | diffusion constant of water, m2/s |
| i | = | cell number |
| N | = | total number of cells |
| V | = | velocity of fluid, m/s |
Greek letters
| η | = | mixing efficiency |
| Ρ | = | density, kg/m3 |
| σ | = | standard deviation |
| σmax | = | maximum standard deviation |
| µ | = | viscosity, kg/m s |
1. Introduction
Developing efficient micromixers and understanding the mechanism of the mixing of fluids are the main focuses of research in the microfluidic field (Ansari, Kim, & Kim, Citation2010). The use of microfluidic devices permit a reduction in the size and cost of laboratory equipment, diminishing the consumption of specimens and increasing the speed and reliability of analysis (Solehati, Bae, & Sasmito, Citation2014). Micromixers are broadly applied in various industrial processes such as polymer mixing, chemical reaction and food processing, in cosmetics and pharmaceutics, and also in waste-water treatment (Alam, Afzal, & Kim, Citation2014; Hossain, Husain, & Kim, Citation2011; Meijer, Singh, & Patrick, Citation2012).
Convection and diffusion are the basic mechanisms which permit fluid mixing in mixers (Liu, Deng, Zhang, Liu, & Wu, Citation2013). Nevertheless, at the micro scale, molecular diffusion prevails while convection is limited; consequently, in the case of a simple mixer at low Reynolds numbers, mixing by diffusion would require a very long channel and too much time (Zhang, Hu, & Wu, Citation2012). Therefore, in order to speed up the process, the contact area between the fluids to be mixed has to be increased (Bothe, Stemich, & Warnecke, Citation2006, Citation2008) and the fluids have to be repeatedly stretched, compressed, split and recombined, so as to obtain a multi-lamellae arrangement.
High mixing efficiency and low energy requirements are two important characteristics of a mixer. Reducing the pressure drop in the device would reduce the production cost; moreover, a high mixing efficiency is crucial for fast chemical reactions (Solehati et al., Citation2014). Recently, in order to satisfy these requirements, computational numerical methods have been employed to design effective new micromixers. Since numerical diffusion is one of the problems of such computations, a high-quality discretization of the fluid domain is needed to achieve accurate results.
Micromixers are generally divided into two categories, active and passive, according to their operating mechanism (Capretto, Cheng, Hill, & Zhang, Citation2011; Hessel, Löwe, & Schönfeld, Citation2005). Active micromixers require external actuation elements. Research undertaken on mixers using a pulsing inlet flow, electro-kinetically or magneto-hydrodynamically induced pressure flow and vibrating piezoelectric actuators have been reported in the literature (Alam & Kim, Citation2013; Asgar, Bhagat, & Papautsky, Citation2008). Even if they require a short amount of time to complete the mixing process, their fabrication is complex and expensive (Parsa, Hormozi, & Jafari, Citation2014). Conversely, passive mixers are designed to generate many fluid streams so as to increase their contact area; this way, mixing by diffusion is promoted (Falk & Commenge, Citation2010). Passive mixers are more popular than active mixers for chemical and biological applications, since the active mixing mechanism can damage biological fluids.
The split and recombine (SAR) principle is a typical mechanism used in static mixers. At low Reynolds numbers, mixing is ensured by generating multiple fluid lamellae. As the Reynolds number increases, vortexes begin to form within the flow until chaotic mixing is obtained. Most of the studies in the recent past have focused on the numerical simulations and experimental measurements of pressure drop, heat transfer, mass transfer and the mixing of identical or different fluid samples. One of the SAR mixers, namely the Caterpillar, has been successfully employed for many industrial applications at high Reynolds numbers; nevertheless, its mixing ability is of minor quality in the case of Reynolds numbers below about 500 (Schönfeld, Hessel, & Hofmann, Citation2004). In fact, according to the literature, most of the micromixers have satisfying operation at either high or low Reynolds numbers – and SAR micromixers in particular have high energy requirements because of their complex structure (Viktorov, Mahmud, & Visconte, Citation2015). Therefore, the development of high-performance devices that can work over a wide range of Reynolds numbers with an acceptable pressure drop is currently a major focus of research.
In the present study, a new SAR ‘H-C’ micromixer, combining the working principles of the existing H mixer and Chain mixer to improve mixing performance, is presented. The aim of this work is to investigate the dependence of mixing efficiency on mid- and high-range Reynolds numbers by varying the inlet flow-rate ratio. The influence of the inlet flow-rate ratio on mixing efficiency, even if rarely examined in the literature (Grundemann, Fischer, & Scholl, Citation2009), could be of interest with regard to many chemical and biomedical applications which require the mixing of different amount of reactants. In order to have a point of reference, the H-C micromixer was compared to the already established Tear-drop and the Chain micromixers.
First, in order to validate the numerical model, numerical and experimental results were obtained for all three mixers at an inlet flow-rate ratio of 1. Afterward, simulations were carried out for inlet flow-rate ratios of 1 to 3 and the distribution of path lines of fluids and the dependency of mixing efficiency and pressure drop on Reynolds numbers were investigated. Inlet flow-rate ratios were calculated considering the velocity rate of input 1 and input 2 of the micromixer. For example, in the case of an inlet flow-rate ratio of 3, the ratio between the flow rate at inlet 1 and the flow rate at inlet 2 was set to 3 (q1/q2 = 3). Finally, a comparative analysis of the mixing efficiency and pressure drop of all the examined micromixers was performed in order to determine which is the most promising prototype for chemical and industrial applications.
2. Micromixer design
In the present study, three SAR micromixers of different geometrical configuration were designed and analyzed to compute mixing performance. The concepts of the Chain and Tear-drop micromixers are presented in Viktorov and Nimafar (Citation2013) and Chen et al. (Citation2009), respectively. The detailed geometrical configuration of a slightly modified version of the Chain and Tear-drop micromixers (Nimafar, Viktorov, & Martinelli, Citation2012b) is shown in .
Figure 1. Design of (a) Chain micromixer and (b) Tear-drop micromixer (all dimensions in mm).
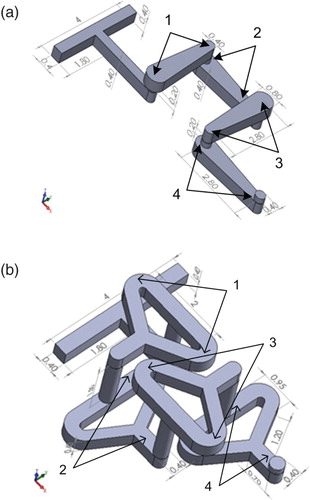
Figure 2. Design of the H-C micromixer (all dimensions in mm).
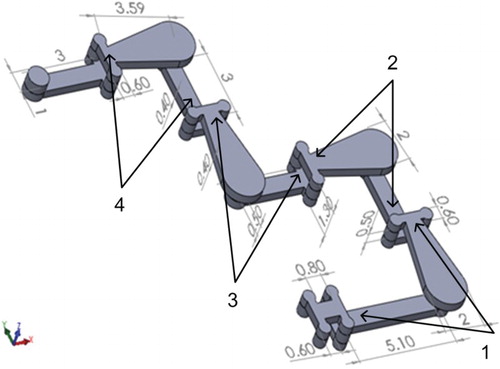
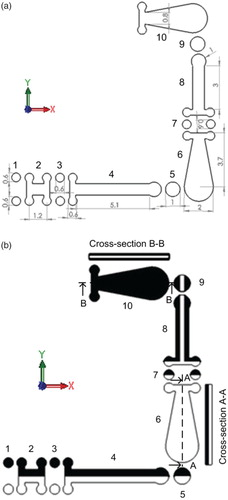
Figure 3. Design of the H-C micromixer: (a) 2D view with dimension in mm; (b) flow pattern inside the channel.
A new SAR micromixer, which combines the working principles of the H and Chain mixers (Nimafar, Viktorov, & Martinelli, Citation2012a) was designed (). The purpose of the H-shaped module is to move the fluid particles, initially at the center of the upstream channel, towards the wall of the downstream channel and vice versa, while the Chain module causes a 90° rotation of the flow, folds the stream and splits and recombines it to improve mixing. Thus, both the H and Chain modules contribute to improving mixing efficiency. Despite its complex 3D structure, the H-C mixer can be obtained by micromilling a simple geometry on one sheet of polycarbonate foil and providing connecting holes on two other sheets of foil. Since there are no obstacles or grooves inside the channel, the manufacturing procedure is simple and low cost. All three micromixers are made up by four identical elements connected in series, denoted as 1 to 4 in Figures and .
As shown in (a), the mixer starts with two circular inputs (segment 1) of 0.6 mm diameter connected to two vertical cylinders of 0.5 mm length along the −Z direction. The input is connected with the first element which starts with an H-shaped module (segments 2 and 3), after which the two species flow through a rectangular channel of 5.10 mm length and 0.8 mm width, linked to a semicircle of 1 mm diameter and then coupled with a circular cylinder of 1 mm diameter, extended by 0.5 mm along the +Z direction. The circular connector passes the flow to the first Chain module, which is 0.4 mm in breadth (segment 6) and has starting and end dimensions of 2 mm and 0.8 mm, respectively. This characteristic structure enables the flow to split at the starting part of the Chain; moving downstream, recombination of the fluid takes place. The second H-shaped module starts with two new circular sections (segment 7) of 0.6 mm diameter, each one extended by 0.4 mm along the −Z direction. Two cylindrical channels of 0.5 mm length along the −Z direction connect these two circular tubes with a horizontal channel of 5 mm length (segment 8). When fluid enters into the H-shaped module from the Chain module, it splits into two streams, one flowing along the +Y direction and the other flowing along the −Y direction; flows then move to the −Z direction. After this, one stream flows along the −Y direction and the other one flows along the +Y direction until they reconnect again. Lastly, the output of the H-shaped module is connected with a circular connector of 1 mm radius (segment 9), which conveys the flow to the next element and the process starts again.
(b) describes the SAR mechanism inside the H-C mixer. The two fluids (black and white) meet at the rectangular channel of segment 2, flow side by side along segment 4 and enter the first Chain module through a vertical cylindrical channel (segment 5, +Z direction). Because of the double 90° change of direction, the black and white fluids flow inside the Chain module (segment 6) as layers stratified along the Z direction (see cross-section A-A); at the end of the Chain module, the black fluid impinges on the upper wall of the splitting channel and then flows along the upper wall, while the white fluid occupies the lower half of the same splitting channel. Thus, a two-layer flow enters the H-shaped module through the circular connecting channels of segment 7. At the exit of the H-shaped module, a three-layer flow is obtained (segment 8), with the white fluid at the center of the rectangular channel and the black fluid in contact with the walls. Finally, the flow enters the second Chain module through the vertical cylindrical channel 9 and the process is repeated. Many different layers are created in vertical and horizontal directions inside the H-C mixer due to the splitting, rotation and recombination of fluid. As the number of layers increases, the thickness of the layers decreases and as a result mixing is improved significantly.
3. Experimental setup and method
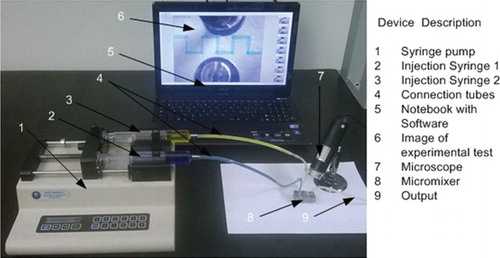
The experimental setup used to test the micromixers () consisted of: a Veho VMS-004D USB microscope with up to 400× magnification and measurement software (Veho UK, Hampshire, United Kingdom); a KDS 210 series syringe pump with a flow rate ranging from 0.1 μl h−1 (10 μl syringe) to 506 ml h−1 (60 ml syringe) with errors less than 1% (KD Scientific Inc., Holliston, USA); and Tomopal glass syringes (Tomopal, Inc., Sacramento, USA). Blue- and yellow-colored food-grade liquids (Rebecchi Fratelli Valtrebbia, Rivergaro, Italy) were used as the two inlet fluids in order to be able to see as well as analyze the mixing efficiency; the food dye can be assumed to have the same density and dynamic viscosity as water. Prototypes of all three mixers were fabricated in polycarbonate at ITD Sas (Turin, Italy) using a P20 S CNC Milling and Engraving Machine (Kuhlmann, Germany).
Figure 4 Experimental setup.
The mass flow rate of the syringe pump was carefully controlled to avoid unnecessary errors. The syringe pump was started always at least 1 minute before each trail, to ensure the steady flow of fluids. During each test, carried out at an ambient temperature (25°C), several pictures of the whole microchannel were taken to minimize the post-processing error. presents the Chain mixer after filling with fluids. An image-based technique was used to obtain the mixing efficiency of the prototypes. After having converted the color images into gray-scale images, the standard deviation of concentration and mixing efficiency of all three mixers was computed following the steps described in Nimafar et al. (Citation2012b). A digital differential manometer (Digibar, HBM Germany, measuring range = 0–500 mbar, sensitivity = 0.5 mbar) was employed to measure the pressure difference between input and exit ports of each micromixer.
Figure 5 Chain micromixer after filling with fluids at Re=1 (left) and Re=10 (right).
4. Numerical method
ANSYS Fluent 15 was used to estimate properties such as flow pattern, pressure drop and mixing efficiency for the examined micromixers. Liquid A and liquid B enter through inputs 1 and 2, mix inside the channel and at the end exit from the output of the micromixer. In the present calculation, the same properties of water, i.e., a dynamic viscosity of 10−3 Ns/m2 and density of 103 kg/m3 were specified for the fluids. A diffusion coefficient of 10−9 m2/s was specified. The value of Reynolds numbers was used as one of the primary parameters for this study and is calculated as
(1)
where ρ and µ are the fluid density and dynamic viscosity, respectively, v is the fluid velocity evaluated at the rectangular channel, and d is the characteristic length and equals 0.4 mm, which is the minimum dimension of all three mixers.
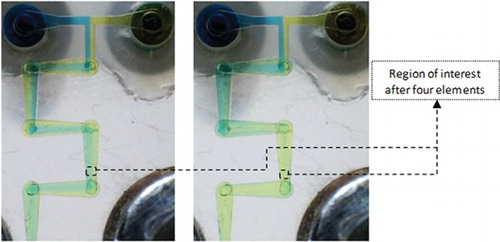
A cut-cell Cartesian method was used to generate hexahedral cells suitable for the complex geometry used in computational fluid dynamics (CFD) simulations. A high-quality mesh was necessary to avoid errors due to numerical diffusion. Therefore, mesh-independent solutions were checked for three mixers for different grids; simulations were carried out using a number of elements of approximately 5×10⁵, 4×10⁵ and 3×10⁵. For example, the deviation of mixing efficiency of the Chain mixer after four elements was less than 3% (), so a grid number of about 3×10⁵ was chosen for the Chain mixer to minimize computational time. Similarly, grids of around 4×10⁵ and 5×10⁵ were used to perform simulations on the Tear-drop and H-C mixers, respectively.
Figure 6 Grid dependency of the Chain mixer: efficiency after four elements.
In the present numerical calculation, the Navier–Stokes equation and convection-diffusion equation were solved for Newtonian and incompressible fluids, ignoring the body force and gravity. These governing equations can be described as follows (Nimafar et al., Citation2012b; Parsa et al., Citation2014):
(2)
(3)
(4)
where V is the fluid velocity vector, ρ and µ are the density and dynamic viscosity of the fluid, respectively, P is the pressure, C is the mass concentration of the species, and D is the coefficient of diffusion.
Firstly, pressure-based and time-steady laminar flow was selected in the Fluent solver to compute the overall distribution of fluid particles, initially with the same inlet flow-rate ratio and then with different ratios for the three mixers, providing a general qualitative idea of the fluid blending.
Secondly, pressure-based and time-steady laminar flow was chosen with the species transport model on, in which the fluid concentration of the two inlets was set as 1 and 0. In the boundary conditions, inlets were set as velocity inlets, the static gauge pressure of the outlet was set as zero, and the wall was set as a stationary wall with no slip condition. A SIMPLEC scheme was assigned as the solution method used to calculate pressure velocity coupling (Mansur, Wang, & Dai, Citation2008). The second-order upwind schemes of momentum and pressure were used to achieve a more accurate solution (Viktorov et al., Citation2015).
To evaluate the mixing efficiency, the standard deviation of species concentration was calculated at a cross-section of the mixing channel using the following equations (Engler, Kockmann, Kiefer, & Woias, Citation2004; Hossain et al., Citation2011):
(5)
(6)
where σ is the standard deviation of mass fraction at a cross-section, N is the number of sample cells in that cross section, Ci is the mass fraction of a sample cell i, Cm is the mean mass fraction, and σmax is the maximum standard deviation of mass fraction which depends on the inlet flow-rate ratio. If there are equal amounts of the two fluids in the micromixer (an inlet flow-rate ratio of 1) then σmax is 0.50. The value of the maximum standard deviation for different inlet flow-rate ratios is shown in . The mixing efficiency η is 1 (100%) when the two species are fully mixed; an efficiency of more than 80% is generally acceptable for mixing-process applications.
Table 1. Simulation parameters.
5. Results and discussion
The aim of this study was to examine the performance of Tear-drop, Chain and H-C micromixers using different inlet flow-rate ratios for Reynolds numbers from 1 to 100.
Firstly, the experimental mixing efficiency was compared to the numerical ones in order to validate the numerical approach. compares the mixing efficiency obtained experimentally and numerically for an inlet flow-rate ratio of 1 after four elements; a good match was found between the experimental and numerical data, with a maximum disparity of less than 10%.
Figure 7. Experimental and numerical mixing efficiency of the Chain, Tear-drop and H-C micromixers for an inlet flow-rate ratio of 1.
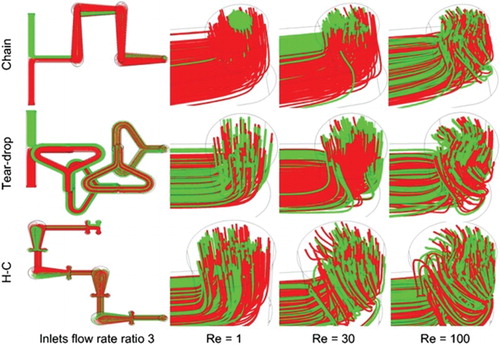
Secondly, the flow pattern inside the channel was examined in terms of path lines for the overall distribution of fluid particles. In fact, the analysis of path-line distribution provides an overall qualitative idea of the device effectiveness. At the lower extreme of the examined range of Reynolds numbers, mixing was only due to molecular diffusion. shows the path-line distribution for an inlet flow-rate ratio of 1; both streams (red and green) flow side by side inside all three mixing channels. In the case of the Chain mixer, there are several distinct layers of path lines at the output when Re = 1, which indicates the non-homogeneity of mixing; the layers of path lines decrease at Re = 30, and finally more than 5 layers of path lines can be found at Re = 100. On the other hand, the Tear-drop mixer shows more than 5 layers of fluid except at a Reynolds number of 30. On the contrary, the H-C mixer always presents more than 5 layers of path lines regardless of the Reynolds number. Hence, it is highly likely that the Tear-drop and H-C mixers offer a better mixing efficiency than the Chain mixer at low- and mid-range Reynolds numbers. shows the path-line distribution for the three mixers with an inlet flow-rate ratio of 3; in this case, the same scenario obtained with an inlet flow-rate ratio of 1 is displayed, with some minor differences.
Figure 8. Path lines throughout and at the output of the micromixers for an inlet flow-rate ratio of 1.
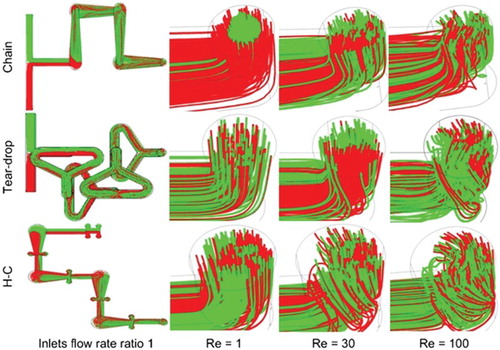
Figure 9. Path lines throughout and at the output of the micromixers for an inlet flow-rate ratio of 3.
Thirdly, the mixing efficiency of all mixers was evaluated at Reynolds numbers from 1 to 100 for inlet flow-rate ratios of 1 to 3.
compares the numerical results obtained for the Chain mixer varying the inlet flow-rate ratio from 1 to 3. In case of an inlet flow-rate ratio of 1, the mixing efficiency is about 70% at low Reynolds numbers, relatively poor for mid-range Reynolds numbers and exceeds 80% at values of 50 or greater. It is also clear that mixing efficiency depends strongly on the inlet flow-rate ratio up to Re = 60; in particular, efficiency increases with the increase of inlet flow-rate ratio.
Figure 10. The numerical mixing efficiency of the Chain micromixer for different inlet flow-rate ratios and varying Reynolds numbers (1 ≤ Re ≤ 100).
The mixing efficiency of the Tear-drop mixer for inlet flow-rate ratios of 1 to 3 is plotted in and the three efficiency curves show the same progression as with the Chain mixer. The mixing efficiency of the Tear-drop mixer depends strongly on the inlet flow-rate ratio, which interestingly increases for higher inlet flow-rate ratios, especially for mid-range Reynolds numbers. In the case of an inlet flow-rate ratio of 1, the efficiency is less than 90% when Reynolds numbers vary from 20 to 60. The range of Reynolds numbers at which a reduction of efficiency is detected decreases in the case of an inlet flow-rate ratio of 2. Moreover, the efficiency is greater than 90% for all Reynolds numbers in the case of an inlet flow-rate ratio of 3.
Figure 11. The numerical mixing efficiency of the Tear-drop micromixer for different inlet flow-rate ratios and varying Reynolds numbers (1 ≤ Re ≤ 100).
The mixing efficiency of the H-C mixer for different inlet flow-rate ratios is presented in . The efficiency curves show the same trend for different inlet flow-rate ratios and the efficiency slightly increases for higher inlet flow-rate ratios, especially at 30 ≤ Re ≤ 100. In the case of the Chain and Tear-drop mixers, the efficiency is relatively low at 10 ≤ Re ≤ 40, whereas the H-C mixer shows considerably higher efficiency. The overall mixing efficiency is more than 93% at all Reynolds numbers, regardless of the inlet flow-rate ratio.
Figure 12. The numerical mixing efficiency of the H-C micromixer for different inlet flow-rate ratios and varying Reynolds numbers (1 ≤ Re ≤ 100).
highlights the influence of the number of elements provided in a mixer on the mixing efficiency at Re = 30. All efficiency curves have same trend: the higher the number of elements, the better the mixing efficiency for inlet flow-rate ratios of 1 and 3. The efficiency of the Chain mixer is about 40% at the exit of the first element and increases with increasing elements, finally reaching a value of about 70% after the fourth element. The H-C mixer also exhibits the same pattern; the efficiency starts from a value of about 70% and after two elements is equal to 80%, irrespective of the inlet flow-rate ratio. The Tear-drop mixer shows a noticeable dependence on the efficiency of the inlet flow-rate ratio. After one element, the efficiency is around 60% and 68% for inlet flow-rate ratios of 1 and 3, respectively; after four elements, the efficiency increases up to 80% and 88%, respectively.
Figure 13. The numerical mixing efficiency of the Chain, Tear-drop and H-C micromixers at inlet flow-rate ratios of 1 and 3 for Re = 30.
Comparing Figures , and , it is evident that at Reynolds numbers of about 1, all three mixers provide a good mixing efficiency for inlet flow-rate ratios from 1 to 3. It is also clear that for mid-range Reynolds numbers (20 ≤ Re ≤ 40), the Chain mixer shows a low mixing efficiency (η ≤ 80%) regardless of the inlet flow-rate ratio and the Tear-drop mixer also presents a relatively low efficiency – but this efficiency increases as the inlet flow-rate ratio increases. All three mixers show an efficiency of greater than 90% at high Re numbers (Re ≥ 50) for inlet flow-rate ratios from 1 to 3. Moreover, the inlet flow-rate ratio has a notable influence on the Chain mixer at low Reynolds numbers and a slight influence on the H-C mixer at high Reynolds numbers. On the contrary, the Tear-drop mixer has a significant dependence on the inlet flow-rate ratio, especially for mid-range Reynolds numbers (10 ≤ Re ≤ 70).
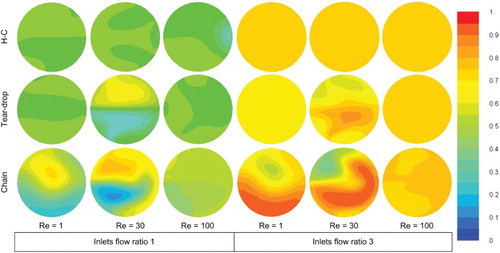
shows a comparative blending of fluids for inlet flow-rate ratios of 1 and 3 at the output of the three micromixers in terms of mass fraction contours. The maximum contour values in case of perfect mixing are 0.5 and 0.75 for inlet flow-rate ratios of 1 and 3, respectively. At Reynolds numbers equal to 1, the Tear-drop and H-C mixers show a contour value near to the maximum, but the Chain mixer displays a wide range of contour values, resembling the mixing efficiency displayed in . The H-C mixer again exhibits contour values near to the maximum both at Reynolds numbers equal to 30 and 100, which yields an efficiency of more than 93%. In case of the Tear-drop mixer, efficiency at Reynolds numbers 30 and 100 is equal to 80% and 98%, respectively (), a result which can be predicted from the corresponding contour values.
Figure 14. Mass fraction contours of water at the output of the Chain, Tear-drop and H-C micromixers.
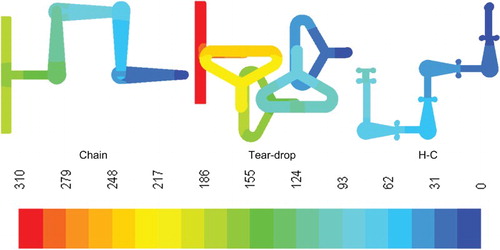
The pressure drop was computed numerically and gives a comparison of the three micromixers at a flow rate of 1.07×10⁻⁸ m3/s.
Figure 15. Numerical pressure drop (Pa) of the Tear-drop, Chain and H-C micromixers at a flow rate of 1.07×10⁻⁸ m3/s.
summarizes the numerical and experimental pressure drops of all three micromixers depending on the corresponding flow rate, and both the experimental and numerical results show satisfactory agreement. It is evident that the pressure drop increases linearly on the flow rate up to 1.5×10⁻⁸ m3/s due to the multi-laminated flow of fluid. As the flow rate increases, vortexes are introduced in the fluid stream and, consequently, the pressure drop increases more rapidly than before. It is also clear from the graph that the pressure drop of the H-C mixer is significantly lower than that of the other two mixers.
Figure 16. Numerical and experimental pressure drop of the Tear-drop, Chain and H-C micromixers.
6. Conclusion
A new design of a passive mixer, which uses fluid folding, rotation, expansion and construction along with splitting and recombination to improve mixing, is presented. The performance of the new H-C mixer was compared to those of two other existing SAR mixers, the Tear-drop and the Chain mixers. A numerical analysis was performed to analyze mixing efficiency and pressure loss. In order to validate the numerical model, experimental tests were also performed on all three mixers at an inlet flow-rate ratio of 1 for Reynolds numbers varying from 1 to 100. The prototype of the H-C mixer was obtained by micromilling one sheet of polycarbonate foil and providing connecting holes on two other sheets; since there are no obstacles or grooves inside the channel, the manufacturing procedure is simple and of a low cost. Since a good agreement exists between the differently gathered data, the numerical model was further used to analyze the effect of different inlet flow-rate ratios at 1 ≤ Re ≤ 100. The results showed that mixing efficiency depends on the Reynolds number; efficiency is generally good for low and high Reynolds numbers for all three mixers, but it is poor for mid-range Reynolds numbers, except for the H-C mixer. The dependency of the efficiency on the inlet flow-rate ratio varies from one mixer to another. The Chain mixer showed notable dependency on the inlet flow-rate ratio at low Reynolds numbers but the Tear-drop mixer has a significant dependency generally for mid-range Reynolds numbers. Conversely, the H-C mixer has a slight dependency on the inlet flow-rate ratio at Re > 40. The mixing efficiency of the H-C mixer is very good (greater than 93%) over the entire examined range of Reynolds numbers and also causes the lowest pressure drop among the three presented micromixers. Therefore, this proposed micromixer can be considered appropriate for industrial applications due to its high mixing efficiency, the low number of elements required and its low pressure drop. Thanks to its negligible dependence on the inlet flow-rate ratio, the H-C mixer could also be of interest for applications requiring the mixing of a different amount of reactants.
However, some limitations are worth noting. Although the experimental efficiency of the three mixers was studied for inlet flow-rate ratios of 1 to 3, more work needs to be done for different inlet flow-rate ratios. The experimental tests for different miscible liquids will be investigated in future. It will be also interesting to investigate residence time distribution (RTD) for identical and different inlet flow-rate ratios.
Disclosure statement
No potential conflict of interest was reported by the authors.
References
- Alam, A., Afzal, A., & Kim, K. Y. (2014). Mixing performance of a planar micromixer with circular obstructions in a curved microchannel. Chemical Engineering Research and Design, 92(3), 423–434.
- Alam, A., & Kim, K. Y. (2013). Mixing performance of a planar micromixer with circular chambers and crossing constriction channels. Sensors and Actuators B: Chemical, 176, 639–652.
- Ansari, M. A., Kim, K. Y., & Kim, S. M. (2010). Numerical study of the effect on mixing of the position of fluid stream interface in a rectangular microchannel. Microsystem Technologies, 16, 1757–1763.
- Asgar, A., Bhagat, S., & Papautsky, I. (2008). Enhancing particle dispersion in a passive planar micromixer using rectangular obstacles. Journal of Micromechanics and Microengineering, 8(8), 1–9.
- Bothe, D., Stemich, C., & Warnecke, H. J. (2006). Fluid mixing in a T-shaped micro-mixer. Chemical Engineering Science, 61(9), 2950–2958.
- Bothe, D., Stemich, C., & Warnecke, H. J. (2008). Computation of scales and quality of mixing in a T-shaped microreactor. Computers and Chemical Engineering, 32, 108–114.
- Capretto, L., Cheng, W., Hill, M., & Zhang, X. (2011). Micromixing within microfluidic devices. Topics in Current Chemistry, 304, 27–68.
- Chen, Z., Bown, M. R., O'Sullivan, B., MacInnes, J. M., Allen, R. W. K., Mulder, M., & Oever, V. R. (2009). Performance analysis of a folding flow micromixer. Microfluidics and Nanofluidics, 6, 763–774.
- Engler, M., Kockmann, N., Kiefer, T., & Woias, P. (2004). Numerical and experimental investigations on liquid mixing in static micromixers. Chemical Engineering Journal, 101, 315–322.
- Falk, L., & Commenge, J. M. (2010). Performance comparison of micromixers. Chemical Engineering Science, 65(1), 405–411.
- Grundemann, L., Fischer, N., & Scholl, S. (2009). From macro batch to micro-conti manufacturing: A new eco-friendly production process for writing ink employing micro-process engineering. Chemical Engineering & Technology, 32(11), 1748–1756.
- Hessel, V., Löwe, H., & Schönfeld, F. (2005). Micromixers—A review on passive and active mixing principles. Chemical Engineering Science, 60(8–9), 2479–2501.
- Hossain, S., Husain, A., & Kim, K. (2011). Optimization of micromixer with staggered herringbone grooves on top and bottom walls. Engineering Applications of Computational Fluid Mechanics, 5(4), 506–516.
- Liu, Y., Deng, Y., Zhang, P., Liu, Z., & Wu, Y. (2013). Experimental investigation of passive micromixers conceptual design using the layout optimization method. Journal of Micromechanics and Micro Engineering, 23, 075002–12.
- Mansur, E. A., Wang, Y., & Dai, Y. (2008). Computational fluid dynamics simulation of liquid-liquid mixing in a static double-T-shaped micromixer. The Chinese Journal of Process Engineering, 8(6), 1081–1084.
- Meijer, H. E. H., Singh, M. K., & Patrick, D. A. (2012). On the performance of static mixers: A quantitative comparison. Progress in Polymer Science, 37(10), 1333–1349.
- Nimafar, M., Viktorov, V., & Martinelli, M. (2012a). Experimental comparative mixing performance of passive micromixers with H-shaped sub-channels. Chemical Engineering Science, 76, 37–44.
- Nimafar, M., Viktorov, V., & Martinelli, M. (2012b). Experimental investigation of split and recombination micromixer in confront with basic T- and O-type micromixers. International Journal of Mechanics and Applications, 2(5), 61–69.
- Parsa, M. K., Hormozi, F., & Jafari, D (2014). Mixing enhancement in a passive micromixer with convergent–divergent sinusoidal microchannels and different ratio of amplitude to wave length. Computers & Fluids, 105, 82–90.
- Schönfeld, F., Hessel, V., & Hofmann, C. (2004). An optimised split-and-recombine micro-mixer with uniform chaotic mixing. Lab on a Chip, 4(1), 65–69.
- Solehati, N., Bae, J., & Sasmito, A. P. (2014). Numerical investigation of mixing performance in microchannel T-junction with wavy structure. Computers & Fluids, 96(13), 10–19.
- Viktorov, V., Mahmud, M. R., & Visconte, C. (2015). Comparative analysis of passive micromixers at a wide range of Reynolds numbers. Micromachines, 6(8), 1166–1179.
- Viktorov, V., & Nimafar, M. (2013). A novel generation of 3D SAR-based passive micromixer: Efficient mixing and low pressure drop at a low Reynolds number. Journal of Micromechanics and Microengineering, 23, 1–13.
- Zhang, Y., Hu, Y., & Wu, H. (2012). Design and simulation of passive micromixers based on capillary. Microfluidics and Nanofluidics, 13, 809–818.