
ABSTRACT
In order to analyze the effect on the dynamic characteristics of the submunitions when subject to different separation conditions during cluster munitions separation, the separation processes are simulated by combining compressible unsteady Arbitrary Lagrange-Euler equations with a six degree-of-freedom parallel calculation program. The separation dynamic characteristics are calculated for six sets of separation conditions: with initial separation velocities of 8 m/s and 16 m/s, and separation angles of 3°, 5° and 7°. The aerodynamic interaction processes of the shock wave and the nonlinear aerodynamic characteristics are also analyzed. To verify the accuracy of the simulation, supersonic wind tunnel experiments were also carried out, the results of which agreed well with the numerical results. The results reveal that the projectile shock wave acting on the submunition serves to provide the pitching moment for the separation motion and causes a sharp change in the dynamic characteristics. The nonlinear dynamic features are characterized by the shock wave interference process in the different separation options.
1. Introduction
The cluster munitions weapon system is widely used in modern warfare due to its severe explosive damage and destruction capability in scattering submunitions over a wide area. However, the safety of this weapon during the process of separation from the projectile is an important matter, especially in high-speed air-delivered systems. In recent years, this field of study has been researched by many eminent scholars (Demir, Citation2005; Meakin, Citation2005; Robert, David, & Edward, Citation2014), and experimental work has also been completed in wind tunnels (Panagiotopoulos & Kyparissis, Citation2010; Taro & Takuro, Citation2009; Zhao, Long, & Yu, Citation2004). Cavallo and Dash (Citation2000) applied adaptive unstructured grids to simulate the shroud covers separated from the missile, and the transient complex flow feature was analyzed. L. P. Zhang, Yang, and Zhang (Citation2004) simulated the separation process of submunitions based on the non-oscillation difference finite-volume method to solve the Euler equations. Magdi and Bruce (Citation2006) used a computational fluid dynamics (CFD) overset grid method to investigate the flow characteristics between the moving bodies.
With the development of CFD, considerable progress has been achieved in numerical simulation and wind tunnel experiments in the area of multiple-body separation questions such as internal ballistics processes (Guo, Ji, & Wang, Citation2010; H. Wang, Citation2001; S. Wang, Tao, & Wang, Citation2009; Xu, Zhang, & Qi, Citation2006), aerodynamic separation processes (Deryl, Evangelos, & John, Citation2003; Robert & Peter, Citation2012; Y. D. Zhang & Ji, Citation2006) and distribution processes (Tao, Tan, & Wang, Citation2012; Woodson & Bruner, Citation1999). These processes are subjected to complex flow environments characterized by strong moving shock waves and a large amount of interference pressure between the bodies. Lei, Miao, and Ju (Citation2004) investigated the multi-body flow field on the separation of a tactical rocket based on the Navier–Stokes equations. They found that the action of the rocket head shock wave was the main cause of acute variations in the aerodynamic characteristics of the submunition. Tao, Zhang, and Zhao (Citation2010) used numerical and experimental methods to analyze the interference flow field on the separation of supersonic cluster munitions. The shear-stress transport (SST) k-omega model and advection upstream splitting method were used to close the Navier–Stokes equations in their paper. The structures of the shock wave between the bodies were analyzed and the surface pressure characteristics of the submunition were revealed in their results. Tian and Lu (Citation2013) analyzed the jet flows in shock wave thrust vector nozzles by different turbulence models, the change of shock structure in different nozzle pressure ratios was discussed.
In these papers, there are a lot of studies on the interference structures of the shock wave, but there is no detailed discussion on the dynamic characteristics of the separation of cluster munitions, especially in the different launching parameters. However, during the engineering tests it was found that the separation of cluster munitions involves a complex dynamic process. The initial separation velocities, angles and projectile flow during separation all have a significant effect on the dynamic characteristics of the submunitions. The collision of submunitions with the projectile can result in large-scale reversal of the lower initial launching angles and velocities. Therefore, analysis of the influential factors involved and provision of suitable launching parameters is of significant importance in the multiple-body separation process.
In this paper, in order to analyze the dynamic characteristics of different initial launching parameters during supersonic separation, the three-dimensional flow field of cluster munitions under the influence of aerodynamic force and gravity was simulated. Moreover, to update the motion of submunitions, as the separation process involves a large displacement, the Arbitrary Lagrange-Euler (ALE) equations of fluid dynamics and six degree-of-freedom (6DOF) rigid body motion equations are coupled and solved. The 6DOF equation programs were compiled and added to the Fluent solver based on user-defined functions (UDFs). The DEFINE _ CG _ MOTION macros were used to control the motion of the rigid body. The characteristics of the flow field – namely the flow interference characteristics, motion characteristics and separation trajectories – were subsequently analyzed. The trajectories and aerodynamic characteristics are also shown in this paper for different sets of launching parameters. The results can be used as a basis for the selection of the launching parameters for the cluster munitions.
2. Computational method
2.1. Governing equations
The compressible unsteady ALE equations are discretized based on the finite-volume method (FVM), the equations are used as follows:
where
is the volume of the cell,
is the surface boundary,
is the unit vector of the boundary, and the conservation variables
and convection terms are
the viscous flux on the surface of the cell is
, where
ρ, p and e are the density, pressure and specific internal energy of the cell, respectively, nx, ny and nz are the three components of the unit vectors along the axes, u, v and w are the velocities along the direction of the three axes, qx, qy and qz are the infinitesimal heat fluxes, xt, yt and zt are the velocities of the grid along the axis,
,
,
,
, and
.
In this paper, the equations of the flow are discretized spatially using the finite volume method and temporally using the implicit temporal scheme. The implicit second-order Advection-upstream-splitting method scheme is used for the convection terms, which is widely used due to its high precision, and the realizable k-ε turbulence model is utilized to calculate the turbulence characteristics. The air is assumed to be an ideal gas and the viscosity varies with temperature in accordance with Sutherland’s three coefficient formulas. A second-order upwind scheme is used on convection and turbulent viscosity terms. The turbulence viscosity coefficient is solved by the turbulent kinetic energy and turbulence dissipation rate
. The equations about
and
in the turbulence model of realizable k-ε are shown as follows:
where
,
,
and
.
2.2. Trajectory calculation
The rigid body motion in the coordinate system is given as
where
is the mass of the submunition,
are the velocity vectors,
are the moments of momentum with the center of the submunition,
are the external forces and
are the moments over the body. For the equations, the Runge–Kutta method is used so the acceleration and velocity in the inertial coordinate system can be solved based on the aerodynamic force over the body. The displacements of the center of gravity (CG) can be calculated in the inertial coordinate system:
.
The equations of the angular motion in the body coordinate system are given as
where
is the tensor of inertia of the submunition,
and
are the moments suffered from the body coordinate and the inertial coordinate system, respectively,
is the rotation angular velocity in the body coordinate system and
is the rotation matrix. The displacements of the rigid body motion are described in the inertial coordinate system and the angular motions are described in the body coordinate system:
2.3. Verification of the 6DOF program
To test the 6DOF parallel calculation program and its ability to capture the submunition trajectories, the supersonic store separation process was calculated. Table shows the parameters of the store, the shape and sizes of the store, and the airfoil are shown in the literature by Deryl et al. (Citation2003).
Table 1. Computational parameters.
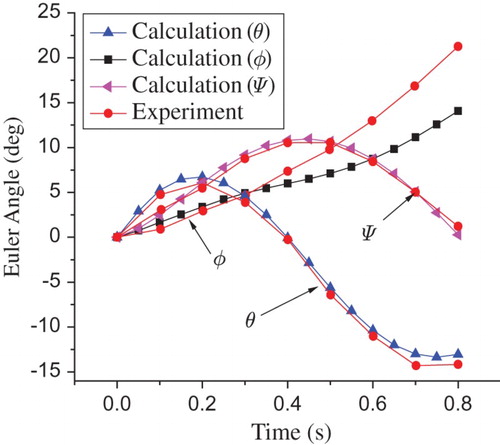
The computational Mach number Ma = 1.2 and the angle of attack α = 0°. Figure shows the surface pressure contours of the store and airfoil at the initial position, the surface pressure and the shock-wave interference are captured. Figure shows the trajectory of the store at intervals of 0.2 s. Figure shows the store CG location in the global coordinate system against time, which is in good agreement with the experimental results. The angular orientation of the store at timed intervals is also shown in Figure .
Figure 1. Pressure contours in the initial position.
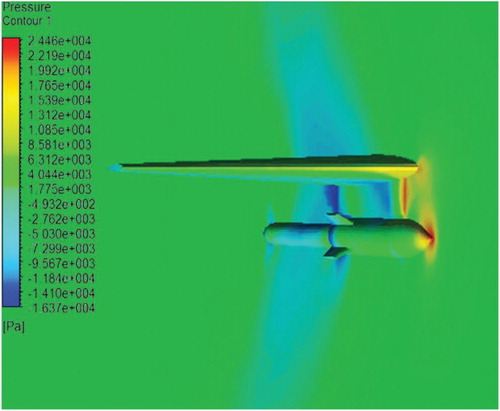
Figure 2. Separation trajectory of the store.
Figure 3. Comparison of the center of gravity over time for the simulated and experimental results.
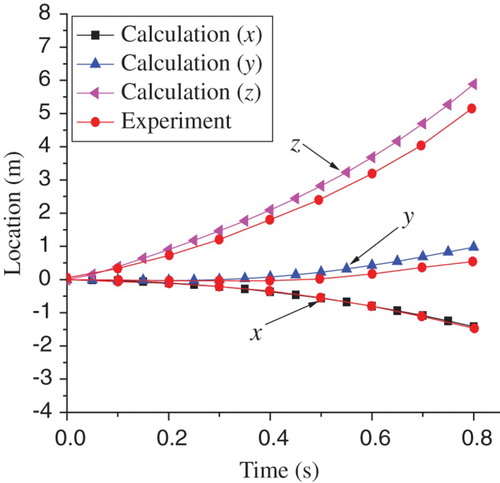
Figure 4. Comparison of the angular orientation over time for the simulated and experimental results.
3. Computational model and boundary conditions
3.1. Physical model
Figure shows the model of the cluster munitions; the submunitions are distributed around the projectile. With the separation of the submunitions we can observe the cavity forming on the projectile surface which makes the computational shape become complex. To reduce the cost of computing time, we select the top submunition over the projectile to calculate, which may collide with the projectile under the influence of gravity. The submunition is ejected by the external combustion gasbag separation system so, at the initial moment, the submunition is a certain distance from the projectile. This distance is determined by the gasbag expansion height, L = 100 mm.
Figure 5. Model of cluster munitions.
Due to the direction of the resultant forces on the submunitions varying under the effect of gravity and aerodynamic forces, the trajectories of the different submunitions around the projectile will exhibit some difference between the entire domain and one quarter of it. However, the separation time is so short that the effect of gravity on the trajectories of the submunitions can be neglected. To reduce the simulation time, a one-quarter simplified computational model is used in this paper. Figure shows the one-quarter simplified computational model of the entire domain. Figure shows the original mesh between the bodies. The surface meshes of the projectile and submunition are encrypted and the prismatic prism cells are generated to ensure the quality of the grid near the submunition surface. The first layer mesh height h = 7.5 × 10⁻⁶ m and the height ratio k = 1.2. The remainder of the domain is filled with unstructured cells and the outer domain one-quarter cylinder has a radius of 2 m and extends 3 m upstream (Figure ). Moreover, the adaptive mesh method based on the pressure gradient is used to improve accuracy and convergence during simulation. Through the adaptive mesh method, the final computing volume grid contains 2,000,000 cells.
Figure 6. Computational model of the submunition.
Figure 7. Local mesh for the submunition.
Figure 8. Volume mesh for the calculation area.
3.2. Boundary conditions
The boundary conditions involved in the numerical simulations in this paper are the inlet and outlet boundary conditions and the wall boundary conditions. Here, the projectile is the static wall boundary condition and the submunition is the moving wall boundary condition. The wall boundary is set to a no-slip condition and an adiabatic boundary condition. The projectile velocity is zero in the normal direction. The submunition initial velocity is the separation velocity in the normal direction (Table ). The inlet boundary is the far-field free stream condition and the outlet boundary is set as the far-field boundary condition. The computational separation parameters are shown in Table . The processes of the separation are calculated separately in six options at the different separation velocities and angles.
Table 2. Computational conditions.
4. Wind tunnel experiments
4.1. Experimental model
To analyze the structure of the flow field and verify the accuracy of the numerical method, the steady simulation was carried out and compared with the experiment results. The tests were conducted in a supersonic wind tunnel and the submunition was installed in two different positions using angles of 3°, 5° and 7°. The test cross-section was 0.3 × 0.3 m, the length of the section was 0.6 m, and the Mach number Ma = 3.
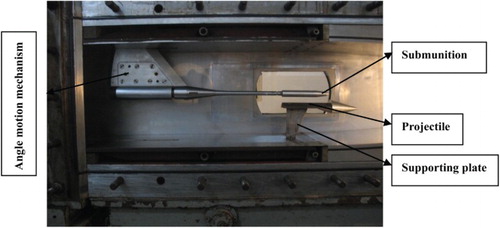
Figure shows a photograph of the experimental model in the wind tunnel; the model is scaled by 1:7.727. The length of the submunition was 158 mm and the diameter was 22 mm. The projectile length was 260 mm with a diameter of 57 mm. The submunition model was installed in two different positions from the projectile: and
, where
is the distance between the center of the submunition and the axis of the projectile and
is the diameter of the projectile. The angle of the submunition is changed by the angle motion mechanism and the distance between the bodies is adjusted to the height of the supporting plate.
Figure 9. Photograph of the experimental model.
4.2. Steady flow-field analysis
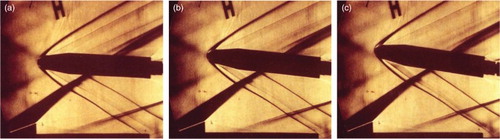
Figures and show the comparison of the flow field in the different positions at α = 3°, α = 5° and α = 7°. From the Schlieren photograph of the submunitions, the submunition shock wave, projectile shock wave and reflected shock wave between the bodies are visible. These phenomena cause local pressure rises and make the flow-field structure become complex. With increasing displacement, the nose of the submunition breaks away from the influence of the projectile shock wave, whilst the shock wave acting on the lower surface of the submunition provides extra momentum for the pitching motion of the submunition (Figure ).
Figure 10. Schlieren photograph of the experimental model in position 1, for Ma = 3 and y1 = l/dc = 0.8333, for (a) α = 3°, (b) α = 5°, and (c) α = 7°.

Figure 11. Schlieren photograph of the experimental model in position 2, for Ma = 3 and y2 = l/dc = 1.5201, for (a) α = 3°, (b) α = 5°, and (c) α = 7°.
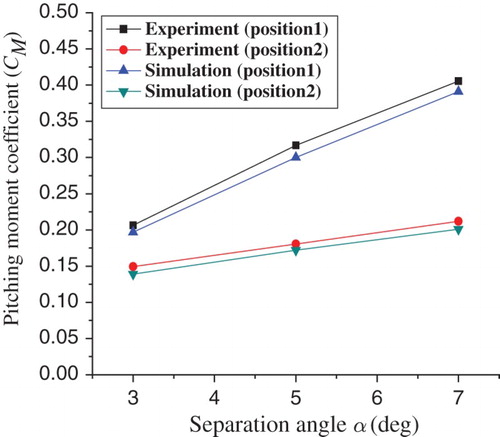
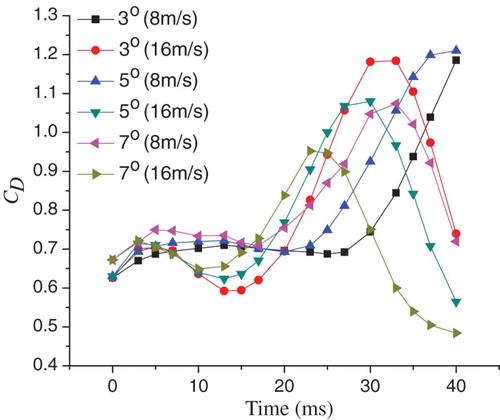
Figures to show the aerodynamic coefficients of the submunition between the experiment and simulation results in two positions with different angles. Through comparison of the simulation with the experimental results, the effectiveness and accuracy of the simulation is verified. From the results, it is surmised that the lift coefficient increases with the increasing submunition separation angle, which improves the separation efficiency. Compared with the aerodynamic coefficients in the different positions, it can be seen that the projectile shock wave acts on the submunition lower surface as the distance increases, and the shock wave provides extra lift force for the motion of separation. The pitching moment decreases because the projectile shock wave acting point moves from the nose to the tail (Figures , and ).
Figure 12. Comparison of the drag coefficient for the simulated and experimental results under different conditions.
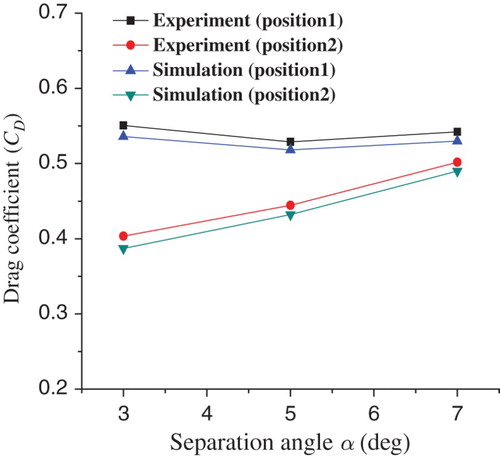
Figure 13. Comparison of the lift coefficient for the simulated and experimental results under different conditions.
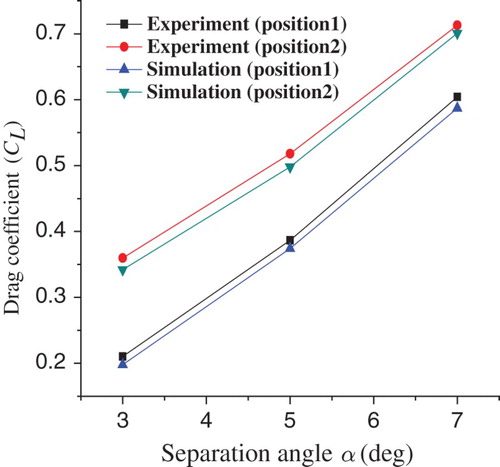
Figure 14. Comparison of the pitching moment coefficient for the simulated and experimental results under different conditions.
5. Numerical results and discussion
5.1. Unsteady flow-field structure
The flow-field interference is mainly caused by the shock wave between the projectile and submunitions during supersonic separation. To study the unsteady flow-field structure and its dynamic characteristics, two different separation options are chosen.
Figure shows the separation processes when α = 3° and v0 = 8 m/s. At the initial point the shock wave acting on the nose forms a high-pressure region. With the movement of the submunition, the flow enters the cavity and forms a reflective wave between the bodies. Under the effect of the projectile shock wave acting on the nose, the angle of the submunition sharply increases, which could cause large-scale reversal. Moreover, although the submunition separates from the projectile, it is unable to break away from the influence of the shock wave and as a result the separation efficiency is lower. The submunition and the projectile are unable to establish an effective separation distance at the lower separation speed.
Figure 15. Pressure contours of the separation for α = 3° and v0 = 8 m/s at (a) t = 0 ms, (b) t = 10 ms, (c) t = 30 ms, and (d) t = 40 ms.
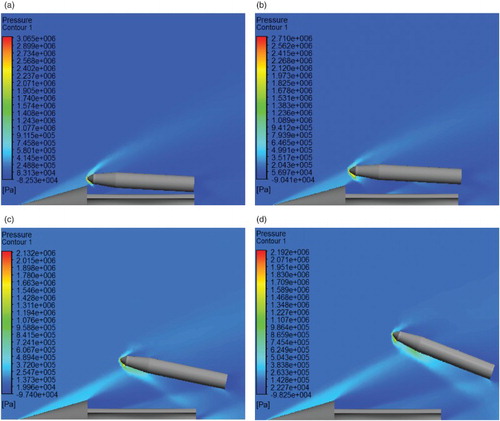
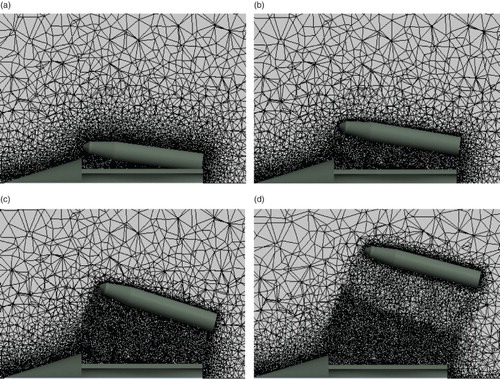
Figure shows the separation processes when α = 7° and v0 = 16 m/s. Compared to Figure , it can be seen that with the increase in the separation velocity and angle, the shock wave acting point on the submunition moves to the tail and the separation efficiency quickly accelerates. At 40 ms the submunition breaks away from the influence of the shock wave completely and an effective separation distance is established with a fine separation stance. Figure shows the process of mesh reconstruction at the different moments.
Figure 16. Pressure contours of the separation for α = 7° and v0 = 16 m/s at (a) t = 0 ms, (b) t = 10 ms, (c) t = 30 ms, and (d) t = 40 ms.
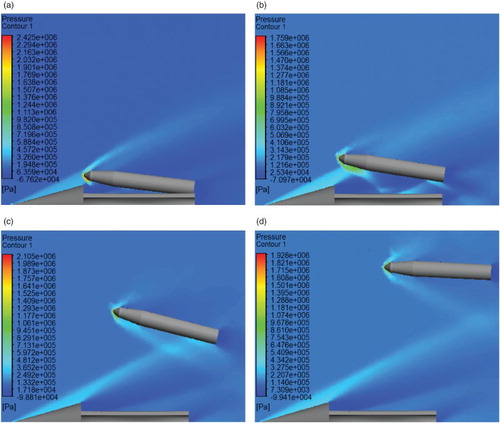
Figure 17. The process of mesh reconstruction for α = 7° and v0 = 16 m/s at (a) t = 0 ms, (b) t = 10 ms, (c) t = 20 ms, and (d) t = 30 ms.
Figures and show the surface pressure contours of the submunition when α = 3° and v0 = 8 m/s and α = 7° and v0 = 16 m/s, respectively. With the lower separation efficiency, the shock wave acts on the nose of the submunition continuously and the surface pressure sharply increases (Figure ). However, with the increase in the separation angle and velocity, the submunition breaks away from the shock wave and the shock wave acting point sweeps over the surface of the submunition (Figure ). This phenomenon causes the dynamic characteristics of the submunition to vary acutely.
Figure 18. The surface pressure contours of the submunition for α = 3° and v0 = 8 m/s at (a) t = 0 ms, (b) t = 10 ms, (c) t = 20 ms, and (d) t = 30 ms.
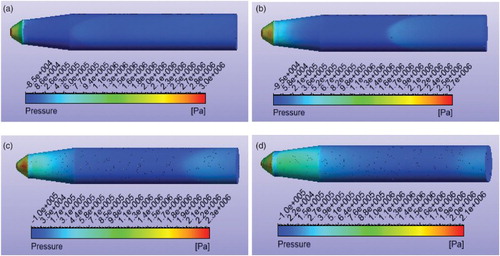
Figure 19. The surface pressure contours of the submunition for α = 7° and v0 = 16 m/s at (a) t = 0 ms, (b) t = 10 ms, (c) t = 20 ms, and (d) t = 30 ms.
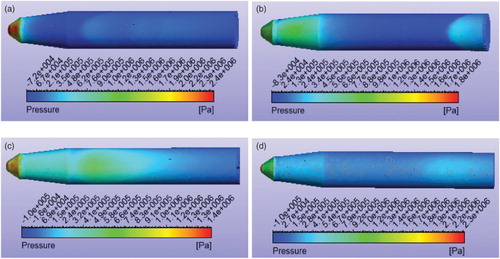
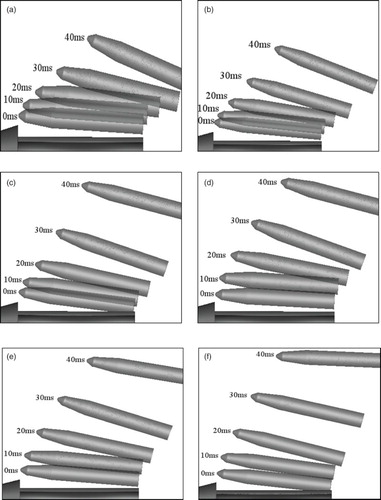
Figure shows the trajectories of the separation for the different options. It is clear that an effective separation distance cannot be established between the bodies with the lower separation angles, as demonstrated when α = 3° and v0 = 8 m/s and α = 5° and v0 = 8 m/s. The submunition separation angle quickly increases when subjected to the action of the shock wave, which may cause large-scale reversal. However, with an increase in the velocity and separation angle, the submunitions break away from the influence of the shock wave with a fine stance, and the separation efficiency quickly accelerates.
Figure 20. Separation trajectories for (a) α = 3° and v0 = 8 m/s, (b) α = 5° and v0 = 8 m/s, (c) α = 7° and v0 = 8 m/s, (d) α = 3° and v0 = 16 m/s, (e) α = 5° and v0 = 16 m/s, and (f) α = 7° and v0 = 16 m/s.
5.2. Aerodynamic characteristics
Figures and show the relative separation velocity histories in the x and y directions. With the effect of the drag and lift force on the submunition surface, the relative separation velocities gradually increase. At the same separation speed, the velocities are increase faster in the radial direction as the initial separation angle increases (Figure ). When α = 7° and v0 = 16 m/s, due to the submunition departing from the influence of the shock wave, the velocity rate decreases gradually due to the effect of gravity. The value of the velocity peaks at 40 ms.
Figure 21. Relative velocity in the x direction for the six conditions.
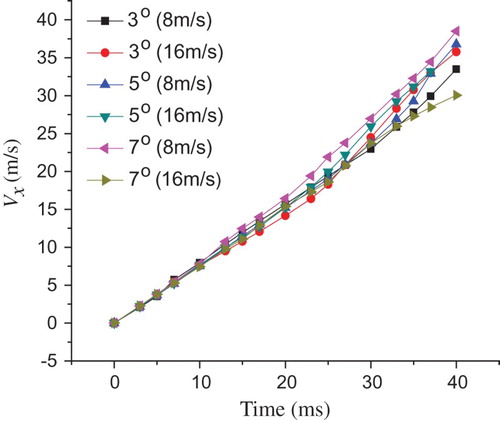
Figure 22. Relative velocity in the y direction for the six conditions.
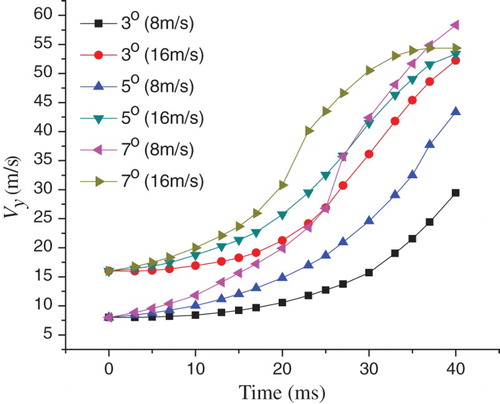
Figure shows the center of gravity displacement of the submunition under the different separation conditions. The distance between the projectile and the submunition improves as the submunition separation angle and velocity increase.
Figure 23. Center of gravity displacement for the six conditions.
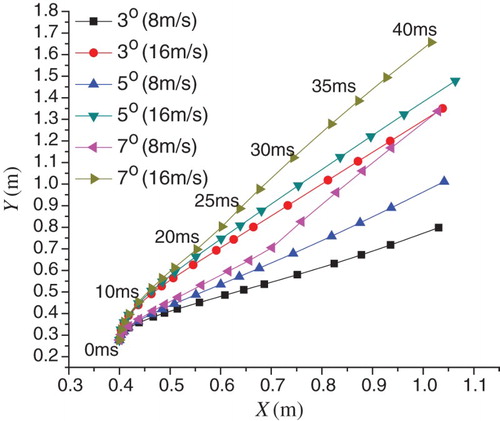
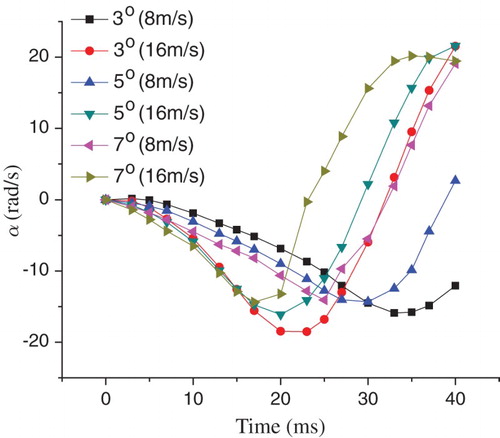
Figure shows the time history of the angular velocity. With the initial separation angle, the projectile shock wave acts on the lower nose surface of the submunition and reduces the angular velocity of the submunition in the negative z direction. With the movement of the submunition, the acting point of the shock wave on the submunition surface moves to the tail. The submunition begins to rotate in the positive z direction and the angular velocity gradually increases. The entire dynamic separation process includes the journey of the submunition through the projectile shock wave and the change of the separation trajectories in different options can be characterized by the time history of the angular velocity.
Figure 24. Angular velocity with time for the six conditions.
Figures and show the lift and drag coefficient characteristics of the submunition, respectively. With the action of the shock wave between the bodies, the lift and drag coefficients of the submunition continuously increase in the initial separation stage until the submunition leaves the influence of the projectile shock wave. It can be seen from the results that when α = 7° and v0 = 16 m/s, the submunitions break away from the projectile shock wave causing the lift and drag coefficient characteristics to quickly reduce. However, when the initial separation velocities and angles are lower, such as when α = 3° and v0 = 8 m/s and α = 5° and v0 = 8 m/s, the submunitions are not freed from the influence of the shock wave immediately. The angle increases greatly due to the effect of the projectile shock wave, which causes the lift and drag coefficients to gradually increase.
Figure 25. Lift coefficients for the six conditions.
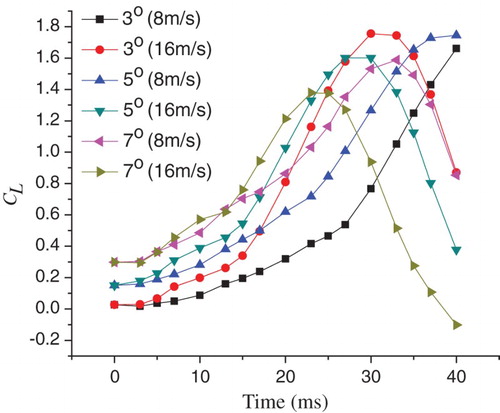
Figure 26. Drag coefficients for the six conditions.
6. Conclusions
Based on the FVM, the simulation results of six combinations of separation characteristics are presented in this paper. The aerodynamic separation characteristics and the trajectories during the separation are captured by coupling compressible unsteady ALE equations and a 6DOF parallel calculation program. The accuracy of the numerical method was demonstrated by comparisons with the results of wind tunnel experiments, which are in good agreement with the numerical results.
The results show that the flow-field structure is complex due to the influence of the projectile shock wave, the submunition shock wave and the reflective wave between the bodies. The projectile shock wave acting on the submunition provides the pitching moment for the separation motion. During separation, the projectile shock wave acting point moves from the nose to the tail. This phenomenon causes the submunition dynamic characteristics to undergo dramatic changes, taking on the characteristics of nonlinear features through the shock-wave interference process. Especially when the separation angles and velocities lower, such as when such as α = 3° and v0 = 8 m/s and α = 5° and v0 = 8 m/s, the projectile shock wave motion continuously acts upon the submunition nose, which may result in a large-scale reversal. The submunition is unable to break free of the influence of these projectile shock waves at these lower values (Figures and ). However, when the initial separation angle and velocity are increased, effective separation distances are established between the bodies.
In the present work, the separation velocities, trajectories and dynamic characteristics of the submunition were captured for different launching parameters. These results can be taken as a basis for the selection of launching parameters for cluster munitions. However, the present study is limited to the wind tunnel free-flight experiments, and the multi-body collision situation will be considered in future work, along with the dynamic structured overset mesh method.
Acknowledgements
Special thanks are due to Professor H. Wang for providing suggestions and directions for the numerical methods used in this paper.
Disclosure statement
No potential conflict of interest was reported by the authors.
ORCID
Jinlong Wang http://orcid.org/0000-0002-4274-5401
References
- Cavallo, P. A., & Dash, S. M. (2000). Aerodynamics of multi-body separation using adaptive unstructured grids. 18th Applied Aerodynamics Conference, Denver, 1–14.
- Demir, H. O. (2005). Trajectory calculation of a store released from a fighter aircraft. 43th Aerospace Sciences Meeting and Exhibit, Reno, 1–12.
- Deryl, O., Evangelos, K., & John, S. (2003). Transonic store separation using unstructured CFD with dynamic meshing. 33th Fluid Dynamic Conference and Exhibit, Orlando, 1–8.
- Guo, J. Y., Ji, X. S., & Wang, H. (2010). Numerical simulation of Interior ballistics for dispersing of cluster munition using centralizing blast tube. Journal of Ballistics, 22(2), 62–66.
- Lei, J. M., Miao, R. S., & Ju, X. M. (2004). Numerical investigation of multi-body flow fields in the separation of tactical rocket’s submunitions. Transactions of Beijing Institute of Technology, 24(9), 766–769.
- Magdi, R., & Bruce, J. (2006). Aerodynamic simulation of bodies with moving components using CFD overset grid methods. 44th Aerospace Sciences Meeting and Exhibit, Reno, 1–20.
- Meakin, R. L. (2005). Multiple-body proximate fight simulation methods. 43th Aerospace Sciences Meeting and Exhibit, Ontario, 1–25.
- Panagiotopoulos, E. E., & Kyparissis, S. (2010). CFD transonic store separation trajectory predictions with comparison to wind tunnel investigations. International Journal of Engineering, 3(6), 528–553.
- Robert, E. H., David, S. T., & Edward, A. L. (2014). Solution-Adaptive method for prediction of aerodynamic interaction in multiple-body high-speed air-delivered systems. 52th Aerospace Sciences Meeting and Exhibit, Maryland, 1–26.
- Robert, E. H., & Peter, A. L. (2012). Towards a predictive capability for multiple body proximate fight in high speed air delivered systems. 42th Fluid Dynamic Conference and Exhibit, New Orleans, 1–7.
- Tao, R. Y., Tan, J. J., & Wang, H. (2012). Sequential dispersing distribution effect of aerial cluster bomb. Transactions of Nanjing University of Aeronautics and Astronautics, 29(4), 354–359.
- Tao, R. Y., Zhang, D. S., & Zhao, R. X. (2010). Numerical and experimental study of interference flow field on separation of supersonic cluster munition. Acta Aerodynamic Sinica, 28(3), 310–315.
- Taro, U., & Takuro, I. (2009). Reduction of aerodynamic interference for separation of two-Stage reusable launch vehicles. 47th Aerospace Sciences Meeting and Exhibit, Florida, 1–10.
- Tian, C., & Lu, Y. J. (2013). Turbulence models of separated flow in shock wave thrust vector nozzle. Engineering Applications of Computational Fluid Mechanics, 7(2), 182–192. doi: 10.1080/19942060.2013.11015463
- Wang, H. (2001). A model for the firing process of the internal-combustion gasbag submunition and its simulation. Acta Armamentarii, 34(2), 178–18.
- Wang, S., Tao, R. Y., & Wang, H. (2009). Interior ballistic modeling and numerical simulation for the Internal combustion gasbag of cluster munition. Journal of Ballistics, 21(3), 57–60.
- Woodson, S. H., & Bruner, C. W. S. (1999). Analysis of unstructured CFD codes for the accurate prediction of aircraft store trajectories. 37th Aerospace Sciences Meeting and Exhibit, Reno, 1–8.
- Xu, W. X., Zhang, J., & Qi, Z. Y. (2006). The modeling and simulation of interior trajectory for cluster munition dispersing. Acta Armamentarii, 27(5), 797–801.
- Zhang, L. P., Yang, Y. J., & Zhang, H. X. (2004). The numerical simulation of cluster munition. The 12th Computational Fluid Dynamics Conference, xian, CN, 383–385.
- Zhang, Y. D., & Ji, C. Q. (2006). The numerical simulation of unsteady multi-body separation flows. Acta Aerodynamica Sinica, 24(1), 1–4. doi: 10.1007/s10409-005-0084-0
- Zhao, Z. L., Long, Y. S., & Yu, L. (2004). Hypersonic wind tunnel interference force test of submunition reentry separation. Experiments and Measurements in Fluid Mechanics, 21(3), 32–35.