
ABSTRACT
The design of intake-outlet structures for pumped-storage hydroelectric power plants requires site-specific location and geometry studies in order to ensure their satisfactory hydraulic performance. This article presents the numerical and physical model studies conducted on the lower intake-outlet of Belesar III power station in Northwest Spain. The proposed location of this structure in a narrow reservoir and at a shallow depth is particularly challenging and required the analysis of both the near-field and far-field flow dynamics in the reservoir. First, the hydrodynamics of the reservoir were studied with a 2D shallow water model. The location of the intake was found to be suitable, with adequate flow conditions in the reservoir even for the lower operating water levels. The intake could be fed with the maximum pumping discharge without being limited by the reservoir’s hydraulics. Second, the flow in the near-field was investigated by complementary use of 3-dimensional numerical simulations and reduced-scale physical modeling. The results allowed the verification of the submergence requirements and the comparison of geometry alternatives. In comparison with the initial design, the final proposed design shows a more symmetrical approach flow into the structure during pumping mode, resulting in a more homogenous flow distribution between the openings and reduced head loss. This study can provide guidance in the application of hydraulic modeling procedures to locate and design intake-outlet structures in existing lakes or reservoirs and to evaluate potential limitations on water levels, inflows and outflows. It can be useful during planning stages of power plants to aim for the shortest possible waterways between the reservoirs while ensuring adequate flow conditions.
1. Introduction
The increased number of intermittent renewable energy sources, whose power output cannot be adjusted to follow load fluctuations, has resulted in a renewed interest in energy storage in recent years. Pumped-hydro energy storage is currently the only commercially proven large-scale energy storage technology, and prevails in the electricity market with between 300 and 500 large-scale pumped storage plants (>100 MW) operating worldwide (Punys et al., Citation2013). In these installations, pump turbines transfer water from a low to a higher-elevated reservoir during off-peak hours, transforming electricity into potential energy. The stored water can then be used for hydroelectric power generation to cover temporary peaks in demand.
The water transmission system of these facilities comprises several structures, among which the water intake structures are worthy of special attention. Intakes are designed to deliver the required flow over the desired range of headwater elevations with maximum hydraulic efficiency. Thus, they should minimize the head loss caused by acceleration of the water and eddy losses at the trash racks and gate guide recesses. Similarly, their design should inhibit the formation of vortices that could draw air into the water conducting system. Site-specific constraints should also be considered in the evaluation of the design (American Society of Civil Engineers [ASCE], Citation1995; Bogenrieder, Citation2006; U.S. Army Corps of Engineers [USACE], Citation2003).
In the particular case of pumped-storage schemes, these structures are designed to act both as inlet and outlet, depending on the operation mode of the machine units. As an outlet structure, they should likewise guarantee an appropriate flow release, with a uniform distribution of velocity in each flow passage and reduced head loss. This implies a compromise between the two modes of operation, which further complicates the design. Moreover, pumped-storage schemes are frequently built on existing reservoirs to improve the cost-efficiency of the project and mitigate its environmental impacts (Bormann & Andersen Martinez, Citation2014; Kucukali, Citation2014). The shortest possible waterways between the reservoirs might correspond to intake-outlet locations which raise concerns regarding flow dynamics. Given this complexity, design guidelines or generally accepted criteria may prove insufficient to provide adequate solutions. Site-specific location and design studies are needed to evaluate alternative designs and discard configurations in which adverse hydraulic phenomena may be present. In these studies, the structure performance and the flow behavior in its vicinity are analyzed by means of numerical or physical models, or a combination of the two.
In general, model tests are desirable in deciding on the location and alignment of any major intake structure (Novak, Moffat, Nalluri, & Narayanan, Citation2007). Nevertheless, robust hydrodynamic models can effectively supplement experimental studies in understanding complex flow fields (Andersson, Andreasson, & Staffan Lundström, Citation2013; Balairón, López, Morán, Ramos, & Toledo, Citation2014; Baranya, Olsen, Stoesser, & Sturm, Citation2012; Erduran, Seckin, Kocaman, & Atabay, Citation2012; Hager & Boes, Citation2014; Liu & Yang, Citation2014; López, Marivela, & Garrote, Citation2010; Pu, Shao, Huang, & Hussain, Citation2013; Salaheldin, Imran, & Chaudhry, Citation2004). In the case of hydropower structures, this approach has been found to provide a very cost-effective means to optimize their design (Sydor & Waterman, Citation2010; Teklemariam, Korbaylo, Groeneveld, & Fuchs, Citation2002). In particular, several works have successfully combined laboratory or field measurements with numerical simulations for providing detailed flow characteristics of intake structures (Khan, Wicklein, Rashid, Ebner, & Richards, Citation2004, Citation2008; Lin, Pigg, & Schohl, Citation2010; Muste, Meselhe, Weber, & Bradley, Citation2001; Ruether, Singh, Olsen, & Atkinson, Citation2005; Vosnjak & Mlacnik, Citation2009) or outlet structures (Dargahi, Citation2010; Khan, Wicklein, & Rashid, Citation2005) under different operation scenarios. The use of computational fluid dynamics (CFD) models allowed the evaluation of complex hydraulic design issues associated with hydropower structures early in the design phase, reducing the need for physical models at this stage. They provided a time- and cost-saving analysis of the flow field, which allowed the identification of adverse flow conditions, the improvement of design concepts or the verification of existing designs.
However, very few studies addressed the particularities of intake-outlets of pumped-storage schemes. In some cases, emphasis is placed on the potential impact of plant operation on the hydrodynamics of the reservoir (Anderson, Citation2010; Bonalumi, Anselmetti, Kaegi, & Wuest, Citation2011), being the spatial or temporal scales used not suitable for predicting flow conditions near the intake-outlet. Other studies refer to the enlargement of an existing pumped-storage scheme, which means that the location of the intake-outlet was defined a priori and only minor geometry changes could be proposed (De Cesare et al., Citation2014; Terrier, Bieri, De Cesare, & Schleiss, Citation2014). Other works correspond to facilities in operation and employed field measurements in combination with numerical modeling to characterize the near-field flow patterns induced by pumped-storage operation (Müller, De Cesare, & Schleiss, Citation2016). Thus, none of the above studies investigated both the hydraulic performance of the intake-outlet and the flow behavior in the reservoir at the planning stage of a pumped-storage facility.
This article examines the results of a comprehensive hydraulic modeling effort that was carried out as part of the design of a new pumped-storage hydropower plant project in Northwest Spain (Belesar III power station). The study sought to ensure satisfactory hydraulic performance of the facility’s lower intake-outlet structure, which is influenced by its location in a narrow and shallow reservoir. This constraint requires the analysis of both the near-field and far-field flow dynamics in the reservoir. The proposed methodology considers both aspects in a time- and cost-efficient way, by complementary use of physical and numerical modeling techniques. The model tests were undertaken in two stages. In the first stage tests, the hydrodynamics of the reservoir were studied with the 2D shallow water model Iber (Bladé et al., Citation2014). The aim at this stage was to establish whether:
The overall hydraulic behavior of the reservoir during pumping mode with low water levels was satisfactory
The intake could be fed with the maximum pumping discharge at the selected location without being limited by the reservoir’s hydraulics
In the second stage, the flow in the near-field of the structure was investigated by means of 3-dimensional numerical simulations and reduced-scale physical modeling. The tests were intended to establish whether:
The submergence of the intake was sufficient
The hydraulic performance of the structure regarding head losses and flow patterns was satisfactory for both modes of operation
Refinements could be made to the structure geometry to improve the aforementioned performance.
2. Study site and structure design
The Belesar III power station is planned as a pumped-storage hydroelectric power plant between the reservoirs of Belesar and Os Peares (), which are located in the river Miño (Galicia, Spain). The reservoirs of Belesar and Os Peares have a storage volume of 655 hm3 and 182 hm3, and occupy an area of 1910 ha and 535 ha, respectively. The maximum and minimum operating water levels for the power plant were established at 342.2 m and 315.75 m for Belesar reservoir and 208.1 m and 202.5 m for Os Peares reservoir. In the initial project, the maximum discharge in turbine mode was set to 178.4 m3/s and the maximum pumping discharge to 134.4 m3/s. The environmental flow release from the upper to the lower reservoir was 10 m3/s throughout the year.
Figure 1. Location of the two reservoirs and scheme of the pumped storage plant.
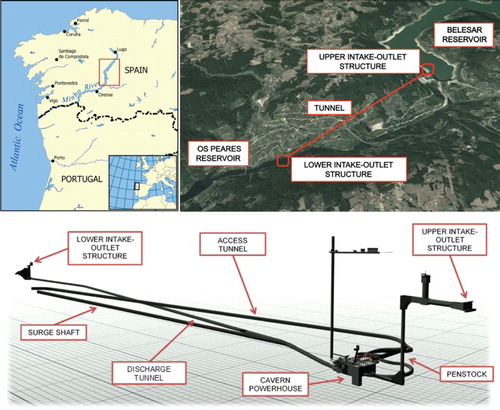
The power plant consists of an underground powerhouse equipped with two independent pump-turbine units with 200 MW of total installed capacity. Therefore, it can be classified as a large-scale pumped-storage plant (>100 MW). Spain as a whole has a total of 15 plants of this type, with sizes ranging from 110 MW to 840 MW. From Belesar reservoir, a 85 m long diversion tunnel with an internal diameter of 6 m and a 1.3% slope connects to the penstock, 157 m in height and 6 m diameter. Downstream from the powerhouse, a 1950 m discharge tunnel with a slope of 1.9% and diameter of 7.4 m carries the water towards the lower intake-outlet structure. The tunnel is connected to a surge shaft with a diameter of 7.4 m, 12.9% slope and a total length of 683 m.
The lower intake-outlet structure for the new pumped-storage plant is to be located on the right bank of the river Miño at the tail end of Os Peares reservoir (). The main advantage of this location is that the pressure conduits system of the plant is shortened to 2100 m. This should lead to a cost reduction during construction phase, as well as to shorter switching times between the two operating modes of the machine units once the plant is in operation. However, the narrow shape of the reservoir and the low depth in this area () complicate the design of the structure. At the minimum operating water level, the width of the reservoir at this location is around 35 m and the water depth at the entrance of the structure is only 4.1 m. Given these constraints, the structure was oriented approximately along the longitudinal axis of the reservoir, so that the flow entered or exited from both the front and one side (). Besides, a conventional horizontal intake or a tower-type intake was discarded based on submergence criteria. Alternatively, the structure bottom followed a convex curve which increases the submergence (). In the vicinity of this location, approximately 1 km downstream of the structure, the river Asma joins the reservoir. Most of this river discharge is diverted to a conventional hydroelectric power plan (Tarrío HPP) and is released through an outlet structure at its confluence with the reservoir.
Figure 2. Bathymetry used in the numerical model of the reservoir and detail of the structure and open boundary location.
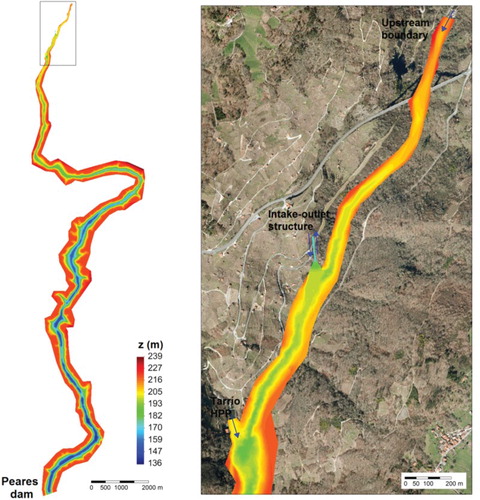
Figure 3. Sectional view of the lower intake-outlet structure. Dimensions and elevations in meters.
Regarding the geometry of the intake-outlet structure, two alternative designs were studied (), the first one corresponding to the original proposed design. This first structure consisted essentially of 6 openings, 5.2 m wide and 14 m height, followed by a square section of 7.4 m and a 14 m length transition to reach the tunnel. The second design was the result of eliminating one of the outer openings, as shown in . This reduces the size of the structure and implies a reduction of construction costs. The sidewalls diverged in plan at an angle of 51.7° in the first design and 43.7° in the second one. In both cases, trashracks are to be installed at the openings to prevent floating debris from entering the tunnel.
Figure 4. Perspective view of the computational domain considered in the near-field model for designs 1 (left) and 2 (right). The transition between the concrete bottom of the intake and the natural ground is clearly observed as a discontinuity in the bed topography.
3. Methodology
Three different hydraulic models were used to evaluate the performance of the structure under several scenarios. First, a 2D numerical model of the reservoir was used to verify that the intake can be fed with sufficient water at low water levels, and that the fluid circulation conditions in the reservoir remain appropriate. Two-dimensional numerical models are a well established choice for characterizing flow dynamics in shallow non-stratified reservoirs, and are computationally less expensive than three-dimensional models (Ji, Citation2008). Second, a 3D near field numerical model was used to assess the adequacy of the structure design for passing the discharge in both operation modes without the generation of large recirculation vortices. A gradual expansion of the outflow from the tunnel during the generating cycle and a smooth flow into the tunnel for pumping flow were sought. The use of a numerical model at this stage allows the testing of different designs at a reduced time and cost. A more limited number of designs can subsequently be evaluated in the physical model. Finally, a reduced-scale physical model was used to verify that the submergence of the intake is enough and that only small surface waves are formed during transient operation, and to validate the numerical results of the 3D model. The main features of the models are briefly described below.
3.1. Numerical model of the reservoir
The overall hydraulic behavior of the reservoir during pumping mode was studied by means of the software Iber, which solves the 2D shallow water equations with an unstructured finite volume solver. For a detailed description of the model, the reader is referred to Bladé et al. (Citation2014), Cea et al. (Citation2016) and the references therein. Iber is a free software which is available for download at www.iberaula.es.
The model domain extended up to 20 km upstream the Peares dam (), covering the entire reservoir. It was discretized with 80,000 triangular elements, with sizes ranging from 25 m at the downstream end to 1 m at the intake-outlet structure. Within a distance of 1 km upstream and downstream of the structure, mesh size was below 4 m, based on the resolution of the available bathymetric data. Inflows and outflows to the reservoir were prescribed at three open boundaries: the maximum pumping discharge at the intake boundary (134.4 m3/s), the environmental flow release from Belesar dam at the upstream boundary (10 m3/s) and the outflow from Tarrío HPP at the confluence with the river Asma (2 m3/s). The bottom roughness was specified over the whole area with a constant Manning coefficient of 0.04 s/m1/3 based on literature values (Chow, Citation1959). The water level in the reservoir was set initially to 205 m and 30 hours of continuous operation were simulated.
3.2. Near-field numerical model
The CFD-code used for the near-field calculations was the software ANSYS CFX 13.0 (ANSYS, Citation2010). ANSYS CFX uses the finite volume method for solving the three-dimensional Reynolds-averaged Navier-Stokes equations. Turbulence was modeled with the two equation k-ε model. Wall functions were used at all solid boundaries. The free surface was treated as a free slip wall, using the rigid-lid approximation and thus considering single-phase flow. The effects of water surface variation are thus represented by non-zero pressure values at the surface plane. This approximation is known to be valid if the deformation of the water surface is less than 10% of the depth of the flow (Andersson et al., Citation2013). It requires less computational resources, and is justified because the water surface is expected to be practically horizontal in the vicinity of the structure after the operation startup period of the turbine-pump units, assumption that was verified in the laboratory physical model described in the experimental setup section. The model is used to evaluate the hydraulic performance of the intake-outlet structure once a steady state is achieved and a constant pumping or generation flow rate is established.
The unstructured meshes consisted of approximately 6 million tetrahedral elements. A higher mesh density was used near the intake-outlet structure, being the grid size approximately 0.55 m in this region and 0.75 m in the outer zone of the domain. The choice of mesh size was based on previous experience modeling similar structures (Bermúdez, Puertas, Cea, Martín, & Baztán, Citation2012). The calculation domain comprised, in addition to the structure, the surrounding terrain and a portion of the pressure conduits, as can be seen in .
Simulations were made for the worst-case scenario, that is, the maximum flow rate either in generating or pumping mode (178.4 m3/s and 134.4 m3/s, respectively) coincident with the minimum operating water level in the reservoir (202.5 m). Boundary conditions were imposed accordingly at the open boundaries. At the end of the pressure pipe, the mass flow rate was fixed, while on the remaining open boundaries an opening condition (able to simulate both an inflow and an outflow of fluid) was applied. The roughness height ks was set to 5 mm for concrete bottom and walls according to literature values for this material (Chanson, Citation2004). Elsewhere, a value of 150 mm was imposed, based on the sediment characteristic diameter D50 in the structure emplacement (D50 = 0.06 m) and assuming ks≈2.5xD50.
3.3. Experimental setup
A geometrically undistorted physical model of the intake and its surrounding topography was constructed and tested in the laboratory (). A 1:40 scale (λ = 40) was selected as a compromise between the required space in the laboratory and scale effects considerations. In total, a 400 m reach of the reservoir with closed land boundaries was represented in the model. The maximum height and width of the model corresponded to 35 m and 115 m in prototype, respectively ( and ).
Figure 5. Physical model and instrumentation: ADV probe mounted on a trolley (left) and set of wave gauges (right).
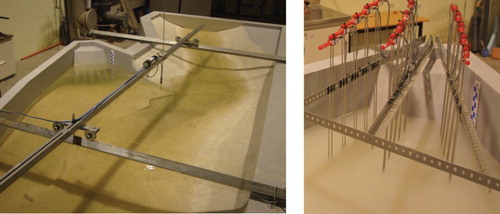
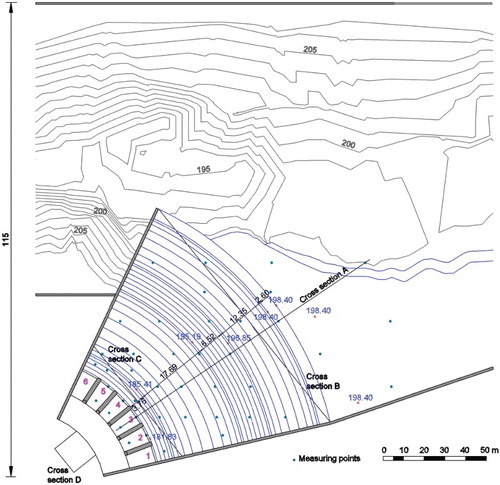
Figure 6. Location of the velocity measuring points in the physical model and location of cross section A, B, C and D (plan view). The structure openings are labeled in magenta. Dimensions and elevations in meters.
Froude similarity was adopted and the relevant parameters in the model were scaled accordingly. The Reynolds number in prototype was 250 times larger than in the model, being 3.07 × 10⁷ and 1.22 × 10⁵, respectively, at the intake entrance () and for generating mode. Based on Froude similarity, maximum flow rates of 13.2 × 10⁻³ m3/s in pumping mode and 17.8 × 10⁻³ m3/s in generating mode were tested (scale factor of λ5/2). The maximum flow rates were reached almost instantaneously in the physical model (less than 1 second, equivalent to approximately 5 seconds in prototype with a scale factor of λ1/2). This is therefore considered to be on the conservative side based on the expected startup time of the pumps in this facility. Experiments were conducted for different levels in the reservoir, including the minimum operating level of 202.5 m, and for both structure geometries.
The objective of the experimental model was to verify and supplement the hydraulic information provided by the numerical model. On the one hand, water depths during the operation startup in pumping mode were measured by 14 DHI Type 202 wave gauges located in the vicinity of the structure (). At each location, water levels were recorded during 30 s with a 1000 Hz frequency of acquisition. On the other hand, the velocity field during the steady state reached after the operation startup was measured with a SonTek acoustic Doppler velocimeter at 40 different horizontal locations and at several elevations ranging from 184 m to 200 m in prototype ( and ) for both modes of operation. At each location, the instantaneous velocity was recorded during 50 s with a 25 Hz frequency of acquisition. Measured velocities were scaled to prototype according to Froude’s similarity law (scale factor of λ1/2).
4. Results and discussion
4.1. Reservoir flow behavior
Operation in pumping mode with low water levels in the reservoir is a concern, since the narrow shape and the low depth at the structure location might limit the maximum operation discharge. This may require raising the minimum operating water level in the reservoir, increasing the dead storage.
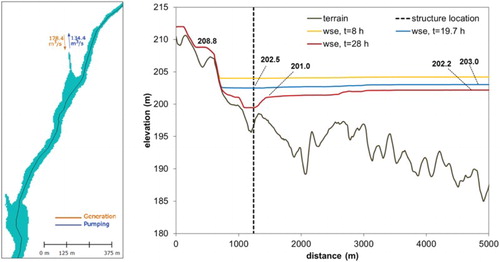
Due to the geometry of the reservoir, differences in water elevation between its head and the structure location were generated during pumping operation. The water surface elevation profile along 5 km of the reservoir thalweg at different instants of the simulation is shown in . Beyond this distance, a practically constant water elevation, with differences below 1 mm per km of thalweg were predicted by the model. For the minimum operating water level of 202.5 m at the structure location, the water elevation at the head of the reservoir reached 203.0 m. For these water levels, the intake can be fed with the maximum pumping discharge without being limited by the reservoirs hydraulics. According to the numerical model, the water surface elevation threshold was set at 201.0 m at the vicinity of the structure and 202.2 m at the head of the reservoir. Below these levels, the inflow started to fall below pumping capacity. This highlights the importance of simulating the flow behavior in the reservoir as a whole.
Figure 7. Water surface elevation profiles along the thalweg of the reservoir at three different instants in pumping mode. The total length of the thalweg is 23 km, only 5 km are plotted.
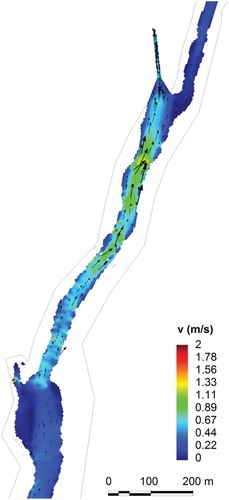
During pumping mode, the water stored in the reservoir moved upstream toward the intake. This is a consequence of the negligible volume stored in the tail of the reservoir and the small environmental flow release from the upper reservoir. The highest velocities were obtained downstream the structure, in a 700 m long reach (). For the worst conditions, when the minimum water levels were reached, velocity can slightly exceed 1 m/s. Nevertheless, velocity remained below 0.8 m/s in the 100 m immediately downstream the structure. Overall, the model results suggested that the structure location is adequate and fluid circulation conditions in the reservoir will remain appropriate for the range of operation water levels.
Figure 8. Velocity field obtained with the 2D model near the structure after 19.7 h of continuous operation in pumping mode, when the minimum operating level is reached.
4.2. Water level evolution during operation startup of pump units
It is important to analyze the surge waves associated to the characteristic start situations of pumps to ensure the safe operation of the power plant. One of the concerns is the potential for air-entraining vortex formation, given the low depths at the structure location and the lateral flow approach. The analysis sought to verify that the minimum operating level provides enough submergence to prevent the aforementioned formation of vortices. Water levels during operation startup in pumping mode were analyzed by the physical model only. Besides, it was necessary to verify that the local water surface remained horizontal after the operation startup period, and that the rigid-lid assumption made in the near-field numerical model was thus valid. This exemplifies the complementarity of numerical and physical modeling.
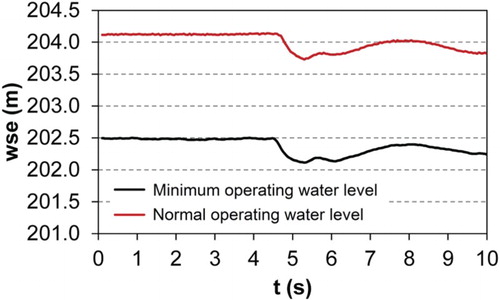
The measured drop in water level during operation startup was of approximately 0.01 m (0.40 m in prototype) for both structure geometries () for the minimum operating water level, followed by a lower water level rise of 0.008 m (0.30 m in prototype). Similar results were obtained in all gauges, with differences in water surface elevations below 5·10−4 m (0.02 m in prototype) among them. Moreover, the measured drop remained practically constant with water levels up to the normal operating level of 204.1 m (). The water level in the reservoir appeared to have little influence on the generated wave. This could be explained by the relative low water level variation (1.6 m between the minimum and normal operating water levels), when compared to the water depths at the close vicinity of the structure (higher than 15 m, as shown in ). Based on the physical model results, a minimum water depth of 3.7 m can be expected at the entrance of the structure, where the lowest water depths are found.
Figure 9. Measured water level fluctuations during operation startup in pumping mode for different water levels, structure design 1. Data filtered using a moving average window of 0.1 s.
The minimum recommended intake submergence values that can be found in the literature (Gordon, Citation1970; Knauss, Citation1987) would be met at all times. Model observations indicated that no air-entraining vortices should form during normal operation. The Reynolds number (Re) and Weber number (We) values in the present work were Re = 9.1 × 10⁴ and We = 615 for pumping mode, which are above the minimum recommended values (Re = 3 × 10⁴ and We = 120) to avoid scale effects relative to viscosity and surface tension (Hecker, Citation1981; Jain, Ranga Raju, & Garde, Citation1978). However, these results should be taken with caution, given that the observations of vortex intensity in models do not always translate directly to the intensity of vortex observed in prototypes (Hecker, Citation1981). After the startup period, water surface remained horizontal.
4.3. Near-field velocity distribution and flow pattern
In addition to the overall reservoir behavior, the adequacy of the structure design for passing the discharge was examined. This was done by means of the 3-D near-field numerical model and the physical model, described in the methodology section, for both operation modes.
The operation of the pumped-storage hydroelectric power plant increased the flow velocity in the vicinity of the intake-outlet structure, particularly for the lower reservoir water levels. During pumping flow at the minimum water level, a non-uniform velocity distribution was observed in both the numerical and physical model (a) for the original structure design (design 1). Higher velocities were found in one side of the structure, whereas a recirculation region characterized by low velocities was developed on the opposite side. This pattern was observed in horizontal planes and at different depths, from 200 m to 192 m. This results in an uneven flow distribution between the openings of the intake (), with the highest flow (25% of the total flow) entering through opening number 6 (). Velocity in the free surface region did not exceed 1.5 m/s, according to the numerical model.
Figure 10. Numerical and experimental horizontal velocity distributions at Z = 200 m (2.5 m depth) for the two modes of operation, design 1. Physical model velocities have been scaled to prototype.
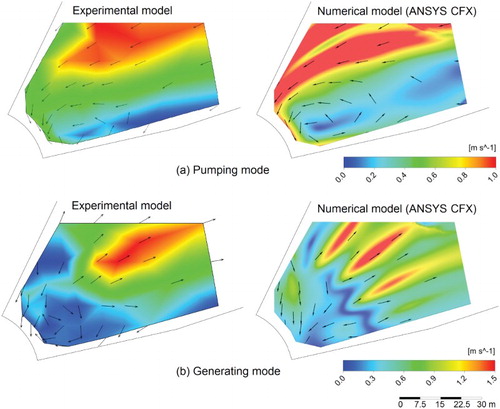
Table 1. Performance of the two designs studied in pumping mode: head loss (ΔH) between cross sections B, C and D (), flow (Q) distribution between the structure openings (1 to 6 as labeled in ), maximum velocity at the free surface (Vs) and size of recirculation region developed at one side of the structure, measured at the free surface (A). Results from the near-field numerical model.
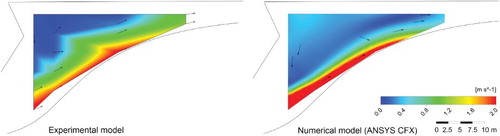
On the other hand, a more homogeneous flow distribution between the openings of the structure was obtained during generating mode (b). The velocity vectors were directed outwards the structure and orientated according to the structure openings. The flow left the structure practically symmetrically in plan view, with a slightly higher discharge passing through the central openings. However, the results showed an uneven vertical distribution within the openings. The flow separated from the upper walls, and most of the flow passed through the lower part of each opening (). This results in the formation of a low-velocity zone close to the structure, in which the surface flow is oriented towards the structure (b).
Figure 11. Velocity field in cross section A during generation mode, design 1. Physical model velocities have been scaled to prototype.
Overall, the flow patterns given by the numerical model in front of the structure showed a reasonable agreement with the experimental data. The asymmetry of the approach flow observed during pumping was captured by the numerical model, although differences in the extension of the recirculation zone could be found. This area was in fact slightly larger in the numerical model predictions than in the physical model (a), and it relates to the overestimation of maximum velocities in the numerical model results.
In the generating cycle the model correctly reproduced the overall flow behavior (b), with an adequate flow distribution between the openings and an uneven vertical distribution within them. Both models predicted maximum velocities of similar magnitude. However, the numerical model showed the influence of the structure openings on the flow field, with non-homogenous velocities in the outward flow region (b). This was not observed in the interpolated experimental velocity field due to the limited number of measuring points and the distances between them (). Similarly, some differences were observed in the flow velocity distributions shown in . The numerical model showed a steeper velocity gradient towards the bottom wall and higher velocities close to the wall. This could be attributed to three possible causes, or a combination of them: (1) the limitations of the measuring equipment, the ADV probe, which has been found to underestimate the streamwise velocity component when the solid boundary is less than 30 to 45 mm from the probe sampling volume (Chanson, Trevethan, & Koch, Citation2007); (2) the interpolation between sparse point measurements, which cannot properly characterize the spatial gradient of this fine bottom layer; (3) the limitations of the k-ε turbulence model for complex flow involving streamline curvature and jet flow.
Based on the above results, a modification of the design was considered. It is referred to as design 2 (Figure ) and it sought to achieve a more symmetrical flow into the structure in pumping mode. The elimination of the outer opening in this design reduced the size of the recirculation region (), which was generated again in front of the structure (). This recirculation cell, rotating counterclockwise, could be detected from the surface to the 192 m horizontal plane. Although the flow continued to enter the structure asymmetrically, a better flow distribution was observed due to the reduced recirculation. The highest flow enters through opening 6 and represents a 25% of the total flow, just as in design 1 (). Measured horizontal velocity values remained practically the same in spite of the elimination of an opening, and free surface velocities were below 1.3 m/s according to the numerical model. The head losses with this design are slightly reduced (). Hence, the second design is considered to improve the flow behavior in the vicinity of the structure during the pumping cycle.
Figure 12. Numerical horizontal velocity distributions at Z = 200 m (2.5 m depth) for the two modes of operation, design 2.
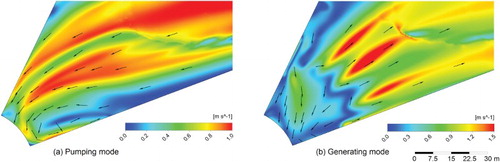
In generating mode the qualitative flow pattern remained unchanged with the elimination of the outer opening. Slightly higher velocity values (approximately a 5% increase) were obtained in this design, being overall flow behavior otherwise very similar. The surface water masses close to the structure showed low velocities, whereas the flow jet, with higher velocities, passed through a limited height of the openings. Maximum free surface velocity was around 1.4 m/s, and occurred approximately 50 m downstream of the structure openings. Therefore, the second tested geometry is considered a good compromise solution for both modes of operation.
5. Conclusions
This article presents a hydraulic model study conducted on the lower intake-outlet structure of a pumped-storage power station. First, a two-dimensional numerical model of the reservoir was developed to evaluate the location of the structure and the general flow behavior in the reservoir. Then, a physical reduced-scale model and a three-dimensional numerical model of the intake and its surrounding topography were used to analyze its submergence and the near-field velocity distributions and flow patterns.
The suitability of the geometry and the location of the structure were verified, and the effect of modifications to the original design was evaluated. The criteria used to evaluate the suitability and performance of the design include: smooth flow into the structure for pumping operation, gradual expansion of the outflow from the structure during the generating cycle, and suitable hydrodynamics in the reservoir. Based on these criteria, the second tested design was considered adequate.
The results show the capabilities of the combined use of numerical and experimental approaches for the design of this type of structures. From a reservoir management perspective, this approach can be applied to optimize the relative position of the upper and lower intake-outlet structures of a pumped-storage scheme between existing lakes or reservoirs and to evaluate potential limitations on water levels, inflows and outflows.
The proposed methodology considers the effects of plant operation on the near- and far-field hydrodynamics of the reservoir. Further research could explore the potential induced changes on water quality and ecosystem health (Anderson, Citation2010; Potter, Stevens, & Meyer, Citation1982), and the role of the intake-outlet location and design on limiting those (Bermúdez, Cea, Puertas, Rodríguez, & Baztán, Citation2017).
Acknowledgements
The authors would like to thank Gas Natural Fenosa Engineering for providing data and financial support, and Pablo Doncel and María Elena Fernández for setting up the 2D numerical model of the reservoir.
Disclosure statement
No potential conflict of interest was reported by the authors.
ORCID
María Bermúdez http://orcid.org/0000-0003-3189-4791
Luis Cea http://orcid.org/0000-0002-3920-0478
Jerónimo Puertas http://orcid.org/0000-0001-6502-0799
Additional information
Funding
References
- American Society of Civil Engineers (ASCE). (1995). Guidelines for design of intakes for hydroelectric plants. New York: Committee on Hydropower Intakes of the Energy Division, American Society of Civil Engineers, 475 p. doi: 10.1061/9780784400739
- Anderson, M. A. (2010). Influence of pumped-storage hydroelectric plant operation on a shallow polymictic lake: Predictions from 3-D hydrodynamic modeling. Lake and Reservoir Management, 26(1), 1–13. doi:doi: 10.1080/10402380903479102
- Andersson, A. G., Andreasson, P., & Staffan Lundström, T. (2013). CFD-Modelling and validation of free surface flow during spilling of reservoir in down-scale model. Engineering Applications of Computational Fluid Mechanics, 7(1), 159–167. doi:doi: 10.1080/19942060.2013.11015461
- ANSYS, I. (2010). ANSYS-CFX Reference Guide, Release 13.0. Southpointe, PA.
- Balairón, L., López, D., Morán, R., Ramos, T., & Toledo, M. Á. (2014). Advances in the design of dam engineering in applied research through physical and numerical modeling. Ingeniería del Agua, 18(1), 55–69. doi:doi: 10.4995/ia.2014.3143
- Baranya, S., Olsen, N. R. B., Stoesser, T., & Sturm, T. (2012). Three-dimensional RANS modeling of flow around circular piers using nested grids. Engineering Applications of Computational Fluid Mechanics, 6(4), 648–662. doi: 10.1080/19942060.2012.11015449
- Bermúdez, M., Cea, L., Puertas, J., Rodríguez, N., & Baztán, J. (2017). Numerical modelling of the impact of a pumped-storage hydroelectric power plant on the reservoirs’ thermal stratification structure: A case study in NW Spain. Environmental Modeling and Assessment. doi: 10.1007/s10666-017-9557-3
- Bermúdez, M., Puertas, J., Cea, L., Martín, A., & Baztán, J. (2012). Numerical simulation of the intake-outlet structures of a pumped-storage hydroelectric power plant. In J. Matos, S. Pagliara, & I. Meireles (Eds.), Proceedings of the 4th IAHR international symposium on hydraulic structures (pp. 1–8). Porto: APRH - Associação Portuguesa dos Recursos Hídricos.
- Bladé, E., Cea, L., Corestein, G., Escolano, E., Puertas, J., Vázquez-Cendón, M. E., … Coll, A. (2014). Iber: herramienta de simulación numérica del flujo en ríos. Revista Internacional de Métodos Numéricos Para Cálculo y Diseño en Ingeniería, 30(1), 1–10. doi:doi: 10.1016/j.rimni.2012.07.004
- Bogenrieder, W. (2006). 2.6. Pumped storage power plants. In K. Heinloth (Ed.), Renewable energy (pp. 165–196). Springer, Berlin, Heidelberg. doi:doi: 10.1007/10858992_7
- Bonalumi, M., Anselmetti, F. S., Kaegi, R., & Wuest, A. (2011). Particle dynamics in high-alpine proglacial reservoirs modified by pumped-storage operation. Water Resources Research, 47(9), W09523. doi:doi: 10.1029/2010WR010262
- Bormann, H., & Andersen Martinez, I. M. (2014). Towards an indicator based framework analysing the suitability of existing dams for energy storage. Water Resources Management, 28(6), 1613–1630. doi:doi: 10.1007/s11269-014-0569-3
- Cea, L., Bermúdez, M., Puertas, J., Blade, E., Corestein, G., Escolano, E., … Ahmadian, R. (2016). IberWQ: New simulation tool for 2D water quality modelling in rivers and shallow estuaries. Journal of Hydroinformatics, 18(5), 816–830. doi:doi: 10.2166/hydro.2016.235
- Chanson, H. (2004). The hydraulics of open channel flow: An introduction (2nd ed.). Oxford: Butterworth-Heinemann.
- Chanson, H., Trevethan, M., & Koch, C. (2007). Discussion of “Turbulence measurements with acoustic doppler velocimeters” by Carlos M. García, Mariano I. Cantero, Yarko Niño, and Marcelo H. García. Journal of Hydraulic Engineering, 133(11), 1283–1286. doi: 10.1061/(ASCE)0733-9429(2007)133:11(1283)
- Chow, V. T. (1959). Open-channel hydraulics. New York: McGraw-Hill.
- Dargahi, B. (2010). Flow characteristics of bottom outlets with moving gates. Journal of Hydraulic Research, 48(4), 476–482. doi:doi: 10.1080/00221686.2010.507001
- De Cesare, G., Bieri, M., Terrier, S., Candolfi, S., Wickenhäuser, M., & Micoule, G. (2014). Optimization of a shared tailrace channel of two pumped-storage plants by physical and numerical modeling. In P. Gourbesville et al. (Eds.), Advances in hydroinformatics (pp. 291–305). Singapore: Springer. doi:doi: 10.1007/978-981-4451-42-0_25
- Erduran, K. S., Seckin, G., Kocaman, S., & Atabay, S. (2012). 3D numerical modelling of flow around skewed bridge crossing. Engineering Applications of Computational Fluid Mechanics, 6(3), 475–489. doi: 10.1080/19942060.2012.11015436
- Gordon, J. L. (1970). Vortices at intakes. Water Power, 22(4), 137–138.
- Hager, W. H., & Boes, R. M. (2014). Hydraulic structures: A positive outlook into the future. Journal of Hydraulic Research, 52(3), 299–310. doi:doi: 10.1080/00221686.2014.923050
- Hecker, G. E. (1981). Model-prototype comparison of free surface vortices. Journal of the Hydraulics Division ASCE, 107(HY10), 1243–1259.
- Jain, A. K., Ranga Raju, K. G., & Garde, R. J. (1978). Vortex formation at vertical pipe intake. Journal of Hydraulic Engineering, 104(10), 1429–1445.
- Ji, Z.-G. (2008). Hydrodynamics and water quality: Modeling rivers, lakes, and estuaries. Hoboken, NJ: John Wiley & Sons. doi:doi: 10.1002/9780470241066
- Khan, L. A., Wicklein, E. A., & Rashid, M. (2005). A 3D CFD model analysis of the hydraulics of an outfall structure at a power plant. Journal of Hydroinformatics, 7(4), 283–290.
- Khan, L. A., Wicklein, E. A., Rashid, M., Ebner, L. L., & Richards, N. A. (2004). Computational fluid dynamics modeling of turbine intake hydraulics at a hydropower plant. Journal of Hydraulic Research, 42(1), 61–69. doi: 10.1080/00221686.2004.9641184
- Khan, L. A., Wicklein, E. A., Rashid, M., Ebner, L. L., & Richards, N. A. (2008). Case study of an application of a computational fluid dynamics model to the Forebay of the Dalles Dam, Oregon. Journal of Hydraulic Engineering, 134(5), 509–519. doi:doi: 10.1061/(ASCE)0733-9429(2008)134:5(509)
- Knauss, J. (1987). Swirling flow problems at intakes. IAHR Hydraulic Structures Design Manual 1. Rotterdam, NL: Taylor & Francis.
- Kucukali, S. (2014). Finding the most suitable existing hydropower reservoirs for the development of pumped-storage schemes: An integrated approach. Renewable and Sustainable Energy Reviews, 37, 502–508. doi: 10.1016/j.rser.2014.05.052
- Lin, F., Pigg, G., & Schohl, G. (2010). Use of CFD modeling for designing intake and discharge structures in a discharge canal. In Proceedings of the ASME power conference (pp. 743–748). Chicago, IL: ASME. doi: 10.1115/POWER2010-27146
- Liu, T., & Yang, J. (2014). Three-dimensional computations of water-air flow in a bottom spillway during gate opening. Engineering Applications of Computational Fluid Mechanics, 8(1), 104–115. doi:doi: 10.1080/19942060.2014.11015501
- López, D., Marivela, R., & Garrote, L. (2010). Smoothed particle hydrodynamics model applied to hydraulic structures: A hydraulic jump test case. Journal of Hydraulic Research, 48(1), 142–158. doi:doi: 10.1080/00221686.2010.9641255
- Müller, M., De Cesare, G., & Schleiss, A. J. (2016). Flow field in a reservoir subject to pumped-storage operation –in situ measurement and numerical modeling. Journal of Applied Water Engineering and Research, 1–16. doi:doi: 10.1080/23249676.2016.1224692
- Muste, M., Meselhe, E. A., Weber, L. J., & Bradley, A. A. (2001). Coupled physical-numerical analysis of flows in natural waterways. Journal of Hydraulic Research, 39(1), 51–60. doi:doi: 10.1080/00221680109499802
- Novak, P., Moffat, A., Nalluri, C., & Narayanan, R. (2007). Hydraulic structures. New York: Taylor & Francis.
- Potter, D. U., Stevens, M. P., & Meyer, J. L. (1982). Changes in physical and chemical variables in a new reservoir due to pumped storage operations. Journal of the American Water Resources Association, 18, 627–633. doi: 10.1111/j.1752-1688.1982.tb00045.x
- Pu, J. H., Shao, S., Huang, Y., & Hussain, K. (2013). Evaluations of SWEs and SPH numerical modelling techniques for Dam break flows. Engineering Applications of Computational Fluid Mechanics, 7(4), 544–563. doi: 10.1080/19942060.2013.11015492
- Punys, P., Baublys, R., Kasiulis, E., Vaisvila, A., Pelikan, B., & Steller, J. (2013). Assessment of renewable electricity generation by pumped storage power plants in EU member States. Renewable and Sustainable Energy Reviews, 26, 190–200. doi:doi: 10.1016/j.rser.2013.05.072
- Ruether, N., Singh, J. M., Olsen, N. R. B., & Atkinson, E. (2005). 3-D computation of sediment transport at water intakes. Proceedings of the Institution of Civil Engineers – Water Management, 158(1), 1–7. doi:doi: 10.1680/wama.2005.158.1.1
- Salaheldin, T. M., Imran, J., & Chaudhry, M. H. (2004). Numerical modeling of three-dimensional flow field around circular piers. Journal of Hydraulic Engineering, 130(2), 91–100. doi:doi: 10.1061/(ASCE)0733-9429(2004)130:2(91)
- Sydor, K. M., & Waterman, P. J. (2010). Engineering and design: The value of CFD modeling in designing a hydro plant. Hydro Review, 29(6), 46–54. Retrieved from www.hydroworld.com.
- Teklemariam, E., Korbaylo, B., Groeneveld, J., & Fuchs, D. (2002). Computational fluid dynamics: Diverse applications in hydropower project’s design and analysis. In Proceedings of the Canadian water resources association 55th annual conference, Winnipeg, MB.
- Terrier, S., Bieri, M., De Cesare, G., & Schleiss, A. J. (2014). Surge wave propagation in a common tailrace channel for two large pumped-storage plants. Journal of Hydraulic Engineering, 140(2), 218–225. doi: 10.1061/(ASCE)HY.1943-7900.0000809
- U.S. Army Corps of Engineers (USACE). (2003). Structural design and evaluation of outlet works. Publication No. EM 1110-2-2400, Washington, DC. Retrieved from http://www.publications.usace.army.mil.
- Vosnjak, S., & Mlacnik, J. (2009). Verification of a Flow3d mathematical model by a physical hydraulic model of a turbine intake structure of a small hydropower plant and a practical Use of the mathematical model [Abstract]. Geophysical Research Abstracts, 11, EGU2009–7041.