
ABSTRACT
Prediction of earthquakes has been long of interest of scientists to create a timely warning to save lives and reduce the damage. During the last few decades, scientists could record and classify the earthquakes’ effective parameters through careful studies. Precursor, as one of the most important parameters, presents the variation in the concentration of radon gas in the earth’s crust released by faults. Measuring and comparing this precursor requires the installation of appropriate hardware in the vicinity of the faults. The extraction of this gas and its lead ions will create additional precursors in the atmosphere layers. Through intelligent analyzing such historical meteorological data sets which are being measured and recorded in most parts of the world, the earthquakes can be predicted. In order to predict the magnitude and number of the earthquakes in this study, the particle filter-based and support vector regression is used. To evaluate the validity of the proposed method, the results are compared with multi layered perceptron neural network and support vector regression. The proposed method indicated the relationship between climatic data and the occurrence of earthquake leading to a precision of 96% for predicting the mean magnitude of earthquakes and a high accuracy of 78% for the expected earthquake count in a month. The accuracy of the method was measured by the correlation coefficient index.
1. Introduction
Earthquakes are among the most destructive natural disasters. Iran due to the convergence between the Arabian and Eurasian plates had been highly effected by earthquakes. Six earthquakes have been identified since 1997 with a magnitude of larger than seven Richter scale (Zhou, Thomas, Parsons, & Walker, Citation2018). Obviously, the prediction of this natural phenomenon prevents disasters in the area, which is seismically highly active. Scientists and researchers made many efforts in this field to determine the possibility of an earthquake in terms of magnitude, time and place. Although the unpredictability of the time is still emphasized.
The parameters such as “earthquake precursors” (Lu et al., Citation2018) have been used by scientists to predict the earthquake. During the past few decades, the hope for accurate earthquake prediction has dramatically increased with the advancement of computer systems. Up until now, about 30 precursors were identified. Since the probability of an earthquake cannot be predicted by focusing only on one precursor. Due to the importance of the subject, an acceptable technique can be found by improving the precursor systems or combining the signs. Earthquake processes are complex natural phenomena and it is difficult to capture diagnostic precursor, if any, before the occurrence of an earthquake (Asencio-Cortés, Martínez-Álvarez, Morales-Esteban, Reyes, & Troncoso, Citation2017).
As a predictor, support vector regression (SVR) has been used in this study, which is one of the best predictive methods used in several recent papers. SVR training parameters and the data set influences the overall performance of the model (Insom et al., Citation2015). In this research, the aim is to improve the performance of the SVR using a particle filter method (PF). In the proposed method, SVR parameters are determined by the particle filter, which is usually set by try and error.
The rest of the article is organized as follow. Section 2 provides the state of the art of earthquake prediction using machine learning algorithms. Section 3 defines precursors and their types. Sections 4 and 5 describe the support vector regression and particle filter. Section 6 explains the proposed method. Section 7 describes the database used and measurement accuracy. And finally, the conclusion is given in section 8.
2. An overview of earthquake prediction methods
Scholars have used a variety of approaches in this regard for decades. The earthquake prediction methods can be categorized into two groups: (i) traditional method; and (ii) knowledge-based method (Mehdidoust & Shahbahrami, Citation2016). The traditional methods are dependent on the basis of historical data obtained from external sensors or seismic cycles. Recent improvements in technologies have enabled researches to get acquainted with the causes and symptoms of the earthquakes via monitor the surface of the earth and collecting required data from orbiting satellites (Ikram & Qamar, Citation2014; Torabi, Hashemi, Saybani, Shamshirband, & Mosavi, Citation2018). To demonstrate the earthquake precursors through ionosphere layer changes (i.e. the total electron content), a scrutinize inspection was conducted at the equator. The results indicated that satellite facilities may help to diagnose the precursors in the ionosphere layer, from a few hours up to eleven days before the main shock (Mehdidoust & Shahbahrami, Citation2016). Another common prediction method is to study the continuous motion of the earth’s surface through remote sensing devices such as Global Positioning System (GPS) (Ikram & Qamar, Citation2015). It was found that GPS pre-signals data can help to predict the location of the earthquake, up to 90 days prior to its occurrence (Murai, Citation2010). According to a research on the surface temperature of the earth, using thermal bands in satellite pictures, it is noted that in some cases there are anomalies in the temperature state before the earthquake too (Tronin, Citation2010). Several recent works have been attempted to extract the empirical relationships between modified Mercalli intensity (MMI) and engineering ground acceleration (PGA) of the earthquakes, for the Iranian territory. The generated MMI-PGA relationships in that study will be particularly beneficial for either damage prediction or determination of the engineering parameters, when a major earthquake occurs at or nearby Iran. Therefore, modification of the seismic building code of Iran becomes vital to reduce hazards arising from future earthquakes (Nemati, Citation2016; Vargas, Citation2017). In a recent report, animals’ behavior has been addressed in this regard. Anomalous animal behaviors have been widely observed the date even several days before an occurrence an earthquake. In that research, animals were used as intelligent geo-sensors to tell or estimate when and where an earthquake will potentially occur (Cao & Huang, Citation2018; Mosavi, Bathla, & Varkonyi-Koczy, Citation2017).
The knowledge-based methods use previous information to predict the earthquake. In other words, these methods employ the features and data available from previous earthquakes at a time interval to predict the probability of an earthquake (Borghi, Aoudia, Riva, & Barzaghi, Citation2009). An efficient knowledge-based system based on the frequency pattern growth algorithm used to predict earthquakes, the aim was to predict future earthquakes by previous earthquakes data, and the system was able to predict the probability of an earthquakes occurrence for a defined range with high accuracy (Tonooka, Palluconi, Hook, & Matsunaga, Citation2005). A phase-neural classification was used for short-term prediction by stored seismic data including depth, magnitude, location and time, this method was capable to predict an earthquake five minutes before its occurrence with an accuracy of 82.86% (Mehdidoust & Shahbahrami, Citation2016). Another efficient knowledge-based system was obtained by extracting associative rules from earthquakes data from 1972 to 2013 (Ikram & Qamar, Citation2015). Another method for earthquake prediction has support vector regression, which is intrinsically a supervised learning algorithm (Dehbozorgi & Farokhi, Citation2008). Table shows the comparison of several prediction systems.
Table 1. Comparison of several system (Mehdidoust & Shahbahrami, Citation2016).
A study was conducted on the health of lithium-ion batteries and this paper used improved methods for the lithium-ion batteries SOH (State of Health) monitoring and RUL (Remaining Useful Life) prediction with the SVR-PF applied and achieve good performance and better monitoring and prediction capability than the standard particle filter (Dong, Jin, Lou, & Wang, Citation2014). Support vector machine is one of the best artificial intelligence tools which has been widely adopted by scientists to improve its performance by using other method along with it. Recently a study tried to improve breast cancer detection by using particle swarm optimization (PSO) method to recognize tumors patterns (feature reduction) and support vector machine is employed to classify tumors. This method could achieve high accuracy and best results (Ahmadi & Afshar, Citation2016).
3. Earthquake precursor
Any parameter which changes before the earthquake is called “precursor”, so that this phenomenon can be predicted by examining, measuring, and finding the relationships between them and the earthquake. More than 30 earthquakes were identified, but most of them are still at the research stage, while the strong relationship between these precursors and earthquakes was proven to researchers, and perhaps it is important to note that uncertainty is due to the complexity of geological phenomena. However, this may be more practical by limiting this prediction to certain regions with known geological patterns. Here are the types of earthquake precursors (Mehdidoust & Shahbahrami, Citation2016).
3.1. Types of earthquake precursors
Precursors have a lot of diversity and complexity requiring the cooperation of specialists in various scientific fields. In Iran, a research-specialized collection is working under the supervision of the Institute of Geophysics of the University of Tehran. Precursors can be divided into several categories in terms of the scientific field required for review and analysis such as the changes in the amount of radon gas in underground water, changes in temperature in groundwater, groundwater change, foreshock before the main earthquake, the magnitude of foreshock , the number of foreshock, the lack of an earthquake in areas including foreshock due to the presence of fault, on clouds due to the reaction of atmospheric gases with leaded ions released with radon gas, changes in air temperature and pressure, wind speed, relative humidity changes, bird fluttering, and earthworm outflow.
4. Support vector regression
Support vector machine is one of the supervisory learning methods used for classification and regression. This method is reported more effective compared to other ANNs e.g. perceptron neural networks. The purpose of an SVM is to search for a hyperplane that completely separates a data set. The construction of an SVM has been described in many publications (Insom et al., Citation2015). The basis for the SVM classifier is the linear classification of data which select a line with more fade margin. Support vector regression used in this study is generalized to the binary classification of support vector machine. In the classification, the inputs are in n-dimensional space and outputs are +1 or −1 (binary). In regression, there can be infinite regressions (outputs are as real) which can be used to estimate the values of the function (other uses include modeling and predicting the time series). In general, there are three main ideas for support vector machines: define an optimal hyperplane, extend the above definition for non-linearly separable problems and map data to high dimensional space where it is easier to classify with linear decision surface (Sayad, Citation2017). As depicted in (1), the data are based on continuous space in regression.
(1) In this equation, xi represents the input and ti is regarded as the target. It aimed to estimate yi during the process of real data as shown in equation (2).
(2) Equation (2) is related to linear regression. Using the kernel trick, which is also used in this research, we obtain linear regression from a nonlinear one.
One of the disadvantages of this method is the adjustment of its parameters, which in this study has been tried to optimize this problem (Insom et al., Citation2015). The benefits of support vector regression are as follows:
Training is relatively simple in this method.
Unlike neural networks, it does not get stuck at the local maximums.
For small data results are better, compared to other methods.
The tradeoff between the complexity and errors is clearly controlled.
Support vector regression is a generalized method of its classification, and the objective function can be defined as minimizing the equation (3).
(3)
and C parameters are explained in section 4.1 and w can be defined according to equation (4).
(4a) The values of
and
are inputs, and the coefficient
can be obtained from the dual problem of equation (4).
4.1. Support vector regression parameters
The parameters C, Epsilon, and Kernel Scale are the values which are estimated by the particle filter improving the function of the support vector regression. These values were usually determined by trial and error. The kernel function parameter, which is used to map non-linear data linearly was manually determined. A brief explanation of these parameters is given below:
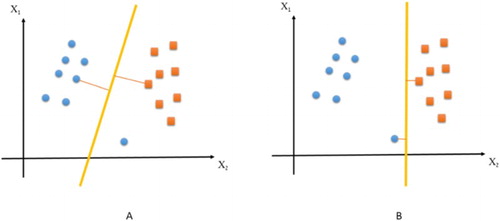
Parameter C
This parameter is a compromise between training error and model complexity (Insom et al., Citation2015). The larger C results in a reduction of the final error, but if you increase C too much, you will increase the risk of losing the generalizable classification properties. Regarding the reason, we can refer to the effort of the support vector regression to achieve the best results for all the points. In addition, C increases the training time. If C is small, we will have a complicated classification. The value of C is chosen to minimize the training error and can also be well-generalized. A large amount of C is shown in Figure (A) and its small one in Figure (B).
Figure 1. C value.
Epsilon
This parameter is Loss Function which is related to the accuracy of the approximation. The value becomes zero if the predicted value is inside the ε-tube (between −ε and +ε as shown in Figure ). Generally, it can be said that the accuracy of predicted outputs and the number of support vectors are directly related to this parameters; a support vector regression with an appropriate ε value can provide a smooth output inside the ε-tube (Insom et al., Citation2015). As it is shown in Figure , if ε value select greater than the range of educational data we cannot expect a good result, and if we make it zero, we expect over fitting, it means the freedom degree of the model is greater than the real one, which results in undesirable output on the test data, in other words, the model on training data has a better result than the test data. The ε-insensitive loss function, proposed by Vapnik (Citation2013), is the most frequently used function to quantify the empirical risk and measure the quality of estimation (Akay, Abut, Cetin, Yarim, & Sow, Citation2017).
Figure 2. -tube (Insom et al., Citation2015)
In this way, the condition is as equation (3).
(3a)
Kernel function
These functions are used to map nonlinear data to linear. The previous studies showed that the earthquake is a nonlinear phenomenon. There are several Kernel Functions such as polynomials and hyperbolic tangent. In this study, the Gaussian Radial Basis was used based on trial and error. This function is expressed as equation (4). Kernel methods generally are a class of algorithms for pattern analysis in SVM and the selection of the kernel function is a very important and mission-critical step (Feizizadeh, Roodposhti, Blaschke, & Aryal, Citation2017).
(4) where
represents an N-dimensional data vector and each sample belongs to a class with label Yi. The parameter which specifies kernel function is the standard deviation σ (Insom et al., Citation2015).
Kernel scale
This parameter is actually known as σ (sigma) and determines the output of the vector machine by kernel function which is explained. The kernel parameter defines the non-linear mapping from the input feature space to a high- dimensional feature space (Tharwat, Hassanien, & Elnaghi, Citation2017).
5. Particle filter
The particle filter is a method for estimating the state of linear systems. The difference between this method and the state observer (State estimator) is that the particle filter converts the system from a typical linear system to a system with random behavior at the presence of noise. However, this randomness is not highly severe. These noises affect both the state equation and the measurement equation as shown in equation (5). The measurement noise can be defined such as other measurement items including dimensions and weights. Particle filters are sequential important sampling methods (Morzfeld, Hodyss, & Snyder, Citation2017).
(5) In this equation,
indicates the current state and
represents the particle filter output.
and
are the process and measurement functions, respectively.
is regarded as the input and
and
are both the noises affecting the equations.
6. The proposed method
The performance of a support vector regression depends on its parameters and the data set. The correlation between the support vector regression parameters and the data can affect the model, so parameter estimation is an important and necessary process for achieving a strong correlation. In the usual case, these parameters are determined by the user or by trial and error. The most used method, in this case, is Grid Search, However, the range of parameters is still performed by the individual and trial and error which fails to achieve an ideal result. While the selection of main parameters is conducted by a particle filter in the particle filter based support vector regression, Parameter selection is performed with particles filter based on particle weight in this filter, which is obtained by calculating the probability density function (PDF). The particle filter is often used to estimate the state of a dynamic system, including prediction and updating process, where some functions are also used for repetitive techniques. Using these two processes, the state vector formed by the estimated parameters can update its values for each repetition based on the weight of each particle, as the result of calculating the PDF on the output and the correct value of the system. Each repetition of particle filter updates the parameters to obtain a logical and better value. Finally, the support vector regression is finalized with parameters predicted by the particle filter. Parameter calculation by particle filter is defined as equation (6) and (7).
(6)
(7) where
indicates the state vector in moment k,
represents the nonlinear noise with mean zero and variance Q, which describes the oscillation of the support vector regression parameters.
Is regarded as the vector of measurement or the degree of accuracy of the support vector regression training function
, and
is described as the nonlinear error prediction with mean zero and variance R. How this method works is displayed in Figure .
Figure. 3. Data flow related to the proposed method
By studying the minimum error, the process of predicting and updating the weight of the particles continues at any repetition. Thus each time it repeats, the support vector machine is modeled to calculate the predicted values with actual values, leading to the estimation of the error. At the end of repetitions, depending on the data and their number, the selection of more repetitions according to the number of data leads to over-processed modeling without producing the correct result of the test data. Using the obtained weights, the support vector model is modeled with the estimated parameters and is re-tested and tested as the final model. The parameters set in the proposed method are given in Table .
Table 2. Parameters set in proposed method.
The three parameters that are referred to as unknown in Table are values that will be selected by particle filter and set by zero at the beginning. It should be noted that the noise value is given in equation 5.
7. Experiment and discussion
7.1. Study area and dataset
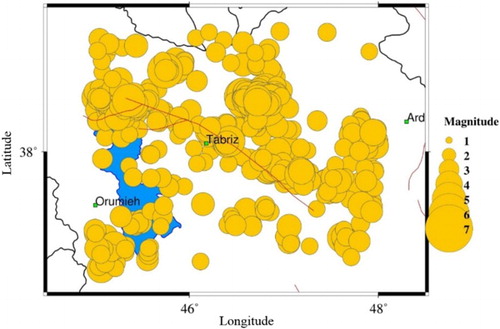
The data used in this study were extracted from two Iranian databases, climatic data from the Islamic Republic of Iran Meteorology Center (www.irimo.ir) and seismic data from the Iranian Seismological Center (www.irsc.ut.ac.ir) during 2006–2014 and the area under consideration was in Tabriz in the range of 37–39° latitude and 45–48° longitude, Tabriz is located northwest of Iran and as shown in Figure , is located on an active fault, shown with red line. In the present study, the seismic data included the number and magnitude of the earthquakes and the meteorological data included the mean temperature, maximum temperature, minimum temperature, average wind speed and precipitation. Figure illustrates 1385 earthquakes recorded in this area.
Figure 4. The earthquakes recorded within the studied area (www.irsc.ut.ac.ir)
More information on the collected data is shown in Table .
Table 3. Collected data details.
Feature 6 and 7 were used as outputs and the rest as inputs.
7.2. Accuracy assessment
The following figures display the results obtained from the regression model in terms of the correlation between the actual and expected outputs. The model for the average magnitude of earthquakes is as follows. In this study, the accuracy of 96% was achieved using two databases. This accuracy drop is related to a severe malformation in November 2013, the study area encountered 477 earthquakes which were unprecedented. This anomaly was more evident in predicting the number of earthquakes. By obtaining the appropriate model and training it with 80% of the data that is randomly separated from entire data, the testing is carried out with residual values which is 20% of entire data. The proposed method was used for test data and results for the mean magnitude are shown in Figures and .
Figure 5. The comparison of actual and estimated values for mean magnitude.
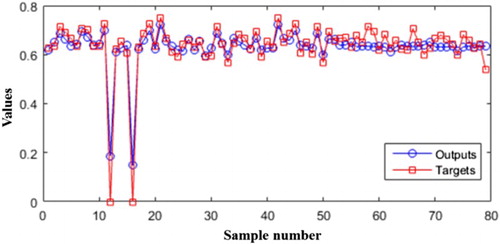
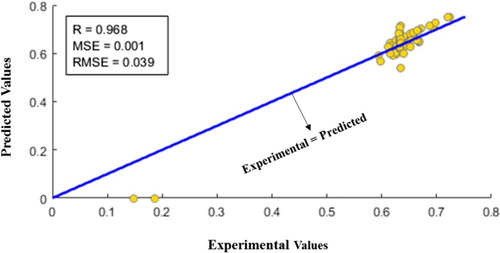
Figure 6. Coincidence of estimated mean magnitude of earthquakes (R index).
As shown, the used method could calculate and predict the correct values to a high accuracy of 96% which is for test data (Figure (C)). This method was used with the same conditions and assumptions to determine and predict the number of expected earthquakes in a month. Which are shown in Figures and .
Figure 7. The comparison of actual and estimated number of earthquakes.
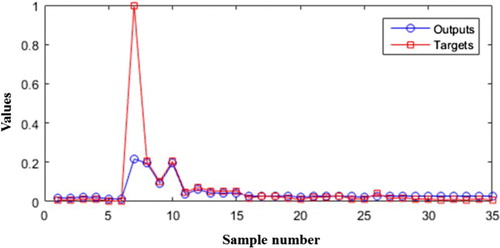
Figure 8. The coincidence of estimated number of earthquakes (R index).
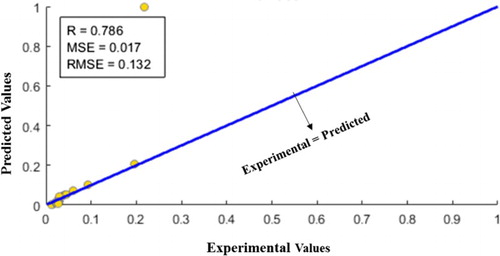
Based on the above figure, the actual values and estimated targets by the optimized support vector regression were apparent, and except one case, prediction and estimation were performed appropriately. The same data (with the same separation for train and test) were analyzed for other data mining methods including multi-layered perceptron and support vector regression and Tables and indicate the results of the regression index indicating the accuracy of the research estimate, these results are for test data to be evaluated.
Table 4. The comparison of regression results for the mean magnitude of earthquakes.
Table 5. The comparison of regression results for the number of earthquakes.
As shown in Tables and , the proposed method could increase the accuracy of the measurement. In this comparison, the difference between the support vector machine and the parameters determined by trial and error and the proposed method was quite evident.
The chart of the R index in Figures and represent the coincidence of outputs of the method (Correlation) and the actual values, it is a standard for describing linear relations and is not used for nonlinear data. This criterion will represent four modes:
Complete and positive correlation if R = 1
Incomplete and positive correlation if 0 < R < 1
Complete and negative correlation if R = −1
Incomplete and negative correlation if −1 < R < 0
In general, negative or positive sign only represent correlation point. The appropriate value of R cannot be defined, but the closer to one is better. This index can be defined as equation (8).
(8) In this case, x and y will be comparable values, and the parameters in equation (8) can be calculated according to equations 9–13.
(9)
(10)
(11)
(12)
(13)
And n also indicate the number of samples.
In the case of other indicators, the mean squared error and its root are shown as MSE and RMSE. The MSE represents the difference between the real values and predicted values in regression. The equation is shown in equation (14).
(14) where θ1 and θ2 are real and predicted vectors, and n is the number of data.
The root of mean square error is another criterion used to examine the method error and can be calculated according to equation (15).
(15)
8. Conclusion
By studying and reviewing the history of earthquake prediction, the signs of occurring earthquakes can be identified which were always considered by ordinary people and even researchers. The signs or parameters which vary before and after the earthquake are known by the researchers as the earthquake precursors. As for the earthquake phenomenon, 30 precursors were identified and evaluated about earthquake phenomena. The evaluated data were extracted from the meteorological and seismological organizations of Iran which include meteorological precursors and seismological history. The study area is located in Tabriz, northwest of Iran. A Support vector regression is one of the best methods for predicting, but the parameters of this method can play an important role in the accuracy of the model, they are always considered as a subtlety of this method and are often determined as trial and error. In this study, the particle filter method was used to optimize the support vector regression performance. The used model could increase the accuracy in predicting the magnitude and number of expected earthquakes in a month, with an accuracy of 96% for the mean magnitude of the earthquake and more than 78% for the number of earthquakes, leading to an accuracy drop in the number of earthquakes, due to a seismic disorder in November 2013. The studied area witnessed the occurrence of more than 477 earthquakes, which may be due to human error in data recording. This study could demonstrate the relationship between meteorological data and the occurrence of an earthquake and predict it in terms of the number and magnitude of the earthquake by using the proposed method based on artificial intelligence methods with a high accuracy.
The database of this study was limited to monthly data; if accessed to the daily data, the proposed method probably was able to identify the results within daily range. And deferent results can be found using other precursor types as described in section 3.
Disclosure statement
The authors declare no conflict of interest.
ORCID
Shahaboddin Shamshirband http://orcid.org/0000-0002-6605-498X
Related Research Data
References
- Ahmadi, A., & Afshar, P. (2016). Intelligent breast cancer recognition using particle swarm optimization and support vector machines. Journal of Experimental & Theoretical Artificial Intelligence, 28(6), 1021–1034. doi: 10.1080/0952813X.2015.1055828
- Akay, M. F., Abut, F., Cetin, E., Yarim, I., & Sow, B. (2017). Support vector machines for predicting the hamstring and quadriceps muscle strength of college-aged athletes. Turkish Journal of Electrical Engineering & Computer Sciences, 25(4), 2567–2582. doi: 10.3906/elk-1603-304
- Aminzadeh, F., Katz, S., & Aki, K. (1994). Adaptive neural nets for generation of artificial earthquake precursors. IEEE Transactions on Geoscience and Remote Sensing, 32(6), 1139–1143. doi: 10.1109/36.338361
- Asencio-Cortés, G., Martínez-Álvarez, F., Morales-Esteban, A., Reyes, J., & Troncoso, A. (2017). Using principal component analysis to improve earthquake magnitude prediction in Japan. Logic Journal of the IGPL, 25(6), 949–966.
- Borghi, A., Aoudia, A., Riva, R. E., & Barzaghi, R. (2009). GPS monitoring and earthquake prediction: A success story towards a useful integration. Tectonophysics, 465(1-4), 177–189. doi: 10.1016/j.tecto.2008.11.022
- Cao, K., & Huang, Q. (2018). Geo-sensor (s) for potential prediction of earthquakes: Can earthquake be predicted by abnormal animal phenomena? Annals of GIS, 24(2), 125–138. doi: 10.1080/19475683.2018.1450785
- Dehbozorgi, L., & Farokhi, F. (2008). Effective feature selection for short-term earthquake prediction using Neuro-Fuzzy classifier –, Centran Tehran Branch, Sci. Assoc. of Electr. & Electron. Eng., Islamic Azad Univ.
- Dong, H., Jin, X., Lou, Y., & Wang, C. (2014). Lithium-ion battery state of health monitoring and remaining useful life prediction based on support vector regression-particle filter. Journal of Power Sources, 271, 114–123. doi: 10.1016/j.jpowsour.2014.07.176
- Feizizadeh, B., Roodposhti, M. S., Blaschke, T., & Aryal, J. (2017). Comparing GIS-based support vector machine kernel functions for landslide susceptibility mapping. Arabian Journal of Geosciences, 10(5), 122. doi: 10.1007/s12517-017-2918-z
- Ikram, A., & Qamar, U. (2014). A rule-based expert system for earthquake prediction. Journal of Intelligent Information Systems, 43(2), 205–230. doi: 10.1007/s10844-014-0316-5
- Ikram, A., & Qamar, U. (2015). Developing an expert system based on association rules and predicate logic for earthquake prediction. Knowledge-Based Systems, 75, 87–103. doi: 10.1016/j.knosys.2014.11.024
- Insom, P., Cao, C., Boonsrimuang, P., Liu, D., Saokarn, A., Yomwan, P., & Xu, Y. (2015). A support vector machine-based particle filter method for improved flooding classification. IEEE Geoscience and Remote Sensing Letters, 12(9), 1943–1947. doi: 10.1109/LGRS.2015.2439575
- Lu, K., Hou, M., Jiang, Z., Wang, Q., Sun, G., & Liu, J. (2018). Understanding earthquake from the granular physics point of view – causes of earthquake, earthquake precursors and predictions. International Journal of Modern Physics B, 32(07), 1850081. doi: 10.1142/S0217979218500819
- Mehdidoust, J. Z., & Shahbahrami, A. (2016). Study Of Expert Systems In Predicting Earthquake.
- Morzfeld, M., Hodyss, D., & Snyder, C. (2017). What the collapse of the ensemble Kalman filter tells us about particle filters. Tellus A: Dynamic Meteorology and Oceanography, 69(1), 1283809. doi: 10.1080/16000870.2017.1283809
- Mosavi, A., Bathla, Y., & Varkonyi-Koczy, A. (2017). Predicting the future using Web knowledge: State of the Art survey. International conference on global research and education.
- Moustra, M., Avraamides, M., & Christodoulou, C. (2011). Artificial neural networks for earthquake prediction using time series magnitude data or seismic electric signals. Expert Systems with Applications, 38(12), 15032–15039. doi: 10.1016/j.eswa.2011.05.043
- Murai, S. (2010). Can we predict earthquakes with GPS data? International Journal of Digital Earth, 3(1), 83–90. doi: 10.1080/17538940903548438
- Nemati, M. (2016). Relationships between modified Mercalli intensity and engineering ground-motion of the earthquakes in Persia. Journal of Earthquake Engineering, 20(5), 795–808. doi: 10.1080/13632469.2015.1104751
- Sayad, S. (2017). Support vector machine. Np, nd Web, 26.
- Sikder, I. U., & Munakata, T. (2009). Application of rough set and decision tree for characterization of premonitory factors of low seismic activity. Expert Systems with Applications, 36(1), 102–110. doi: 10.1016/j.eswa.2007.09.032
- Tharwat, A., Hassanien, A. E., & Elnaghi, B. E. (2017). A BA-based algorithm for parameter optimization of support vector machine. Pattern Recognition Letters, 93, 13–22. doi: 10.1016/j.patrec.2016.10.007
- Tonooka, H., Palluconi, F. D., Hook, S. J., & Matsunaga, T. (2005). Vicarious calibration of ASTER thermal infrared bands. IEEE Transactions on Geoscience and Remote Sensing, 43(12), 2733–2746. doi: 10.1109/TGRS.2005.857885
- Torabi, M., Hashemi, S., Saybani, M. R., Shamshirband, S., & Mosavi, A. (2018). A hybrid clustering and classification technique for forecasting short-term energy consumption. Environmental Progress & Sustainable Energy. doi:10.1002/ep.12934
- Tronin, A. A. (2010). Satellite remote sensing in seismology. A review. Remote Sensing, 2(1), 124–150. doi: 10.3390/rs2010124
- Vapnik, V. (2013). The nature of statistical learning theory. Springer Science & Business Media.
- Vargas, R. (2017). Deep learning: A review. Advances in Intelligent Systems and Computing.
- Zhou, Y., Thomas, M. Y., Parsons, B., & Walker, R. T. (2018). Time-dependent postseismic slip following the 1978 M w 7.3 Tabas-e-Golshan, Iran earthquake revealed by over 20 years of ESA InSAR observations. Earth and Planetary Science Letters, 483, 64–75. doi: 10.1016/j.epsl.2017.12.005