
 ?Mathematical formulae have been encoded as MathML and are displayed in this HTML version using MathJax in order to improve their display. Uncheck the box to turn MathJax off. This feature requires Javascript. Click on a formula to zoom.
Abstract
Natural companies employ turbine flow meters to measure natural gas which delivered to Compressed Natural Gas stations. The stations utilize compressors to increase pressure. The compressor produces a flow pulsation, which affects the accuracy of the measurement. The main aim of this article is to decrease the compressor effects on measurement accuracy by utilizing a snubber between the turbine flow meter and the reciprocating compressors. For this aim, numerical modeling has been built to simulate natural gas flow through a snubber. The effects of various snubber parameters on pressure pulsation have been investigated. The parameters included snubber volume to the minimum volume ratio, the ratio of height to diameter, outlet pipe length, and the existence and non-existence a buffer. The Ansys Fluent has been used for numerical modeling with transient analysis. Results show that in H/D value of 3, the maximum reduction in the percentage of pressure pulsation drop is about 47% and increasing the outlet pipe length to the 10 times of initial length causes a decrease of about 83% in pressure pulsations. Besides, for the ratio of snubber volume to the minimum volume from 1 to 16.7, the amplitude of pressure pulsations decreases from 4.1% to 0.25%.
1. Introduction
The utilization of NG (Natural Gas) as a fuel for vehicles has been underway for decades. One of the forms of NG used all over the world is CNG (Compressed Natural Gas). CNG technology has been developed and applied for decades and is becoming an established applicable technology. Methane is the main element (97%) of Natural Gas. This gas has no color or odor and is lighter compared with air. With ever growing concerns about environmental pollution, the high cost of petroleum fuels, the low cost of natural gas compared to conventional fuels and the low cost of the process for preparing natural gas for industrial application have led to a strong desire for different countries to use natural gas as a fuel for automobiles. If Natural Gas is properly used as a clean fuel in cars, the amount of harmful pollutant emissions will be greatly reduced. Thus development of CNG stations will facilitate the usage of Natural Gas and will lead to lower environmental pollution. The most important component of a CNG station is a reciprocating compressor. In a CNG station, the pressure of the gas must be increased from approximately 0.5 MPa to about 20–25 MPa. A multi-stage compressor is employed to achieve this pressure increment. The largest share of the current and initial costs of the stations depends on the reciprocating compressor (Farzaneh-Gord, Niazmand, Deymi-Dashtebayaz, & Rahbari, Citation2015).
In reciprocating compressors, pulsations can occur due to the opening and closing of the valves in the inlet and outlet flow lines. If vibrations do not reduce to a standard level, they may cause various issues. In general, these vibrations should be eliminated for reasons of providing a laminar flow into and out of the compressor, preventing excessive loading on compressors and reducing overall compressor vibrations (Yu, Na, & Kim, Citation2002). Mujic, Kovacevic, Stosic, and Smith (Citation2008) stated that the pulsations of gas in discharge and suction chambers are the main reasons for noise creation in screw compressors. The effects of compressor working conditions and the geometric features of the mentioned phenomena were analyzed in the study. An area function was distinguished as the crucial factor affecting the pulsations of the gas. In addition, it was concluded that the amplitude could be decreased by port shape optimization. Wu, Xing, Peng, and Shu (Citation2004) investigated unsteady equations with periodic flow changes at the discharge port of a twin-screw compressor. In their study, one-dimensional unsteady equations, by considering the impacts of gas and pipe heat transfer in addition to friction for gas flow, was derived to explain the pulsation of pressure in discharge mode. The two-step Lax-Wendroff scheme was used in order to obtain the results of the problem. They concluded that difference in pressure between upstream of the discharge port and discharge line some way downstream has the key role in the pulsation of discharge pressure. The lowest fluctuation happened in the cases where there was the same value for discharge pressure and the pressure belonged to the built-in volume ratio. In the case of constant discharge pressure, the amplitude of pressure pulsation increased with the rotational speed. Furthermore, accurate natural gas measurement is an important issue, especially in residential natural gas consumption usage levels (Farzaneh-Gord, Parvizi, Arabkoohsar, Machado, & Koury, Citation2015). In CNG stations, Turbine gas flow meters are used extensively to measure the volume of NG entering the site. These types of flow meters are very sensitive to oscillating flows. When the reciprocating compressor is operated, due to the operation of the piston and the valves, a pulse is produced at the suction line and downstream of the flow meter. It results in false pulses in flow meters and, ultimately, errors in measurement.
Experimental and theoretical research has been performed to determine the pulsation effects on turbine flow meters’ measurement accuracy. Atkinson (Citation1992) solved the turbine rotor motion equation and employed the magnetic pickup registering the passing of a rotor blade to compute the real volume flow. This approach should only be employed if the amplitude of the pulsations is detectable by the turbine signal. By the rapid reduction of the amplitude of pulsation in the turbine meter signal due to an increase in frequency, it was difficult to forecast the real flow in the cases of pulsations with high frequency. Lee, Cheesewright, and Clark (Citation2004) developed another software tool called the ‘Watchdog System’. In addition, this system utilized the equation of the motion of the rotor, but an accelerometer is also used to measure the flow noise of a valve or bend. Assuming incompressible and quasi-steady flow and negligible friction force, a relationship can be obtained between the pulsations of velocity and the error of measurement (Lee et al., Citation2004). Experiments have been conducted in the past by Lee et al. (Citation2004), Jungowski and Weiss (Citation1996) and McKee (Citation1992).
Vetter and Schweinfurther (Citation1987), Zhao, Xiao, Wang, Luo, and Cao (Citation2018) and Hou, Zhang, Li, and Zhang (Citation2017) investigated pressure pulsation in a reciprocating pump. Vetter and Schweinfurther (Citation1987) presented a calculation approach to model precisely different pump installations. Comparison of calculated and experimental data shows a good agreement and provides a validation of the computational model. Notzon (Citation1996) discussed different methods of pulsation dampening in high pressure reciprocating pumps and described ways to control and optimize the effectiveness of damping measures by numerical pulsation analysis. Reciprocating pumps are often used as pressure generators in high-pressure process technology. Modern numerical simulation methods are able to determine pressure pulsations in high pressure plants with high accuracy. Therefore, a prediction of pressure pulsations in the planning stage becomes possible and measures for improvements can be taken in time. Commonly used simulation programs are based on a numerical solution of the one-dimensional classical fluid mechanics equation by the method of characteristics.
Zhou, Liu, Wang, Liu, and Zhao (Citation2017) numerically investigated an unsteady multiphase flow in the whole passage of a Francis hydraulic turbine. In their research, pulsation of the pressure was forecast and compared with the data experimentally obtained. Afterwards, the relationship between the pulsation of pressure and air admission was analyzed. According to the numerical data, air admission from a spindle hole reduced the difference in the pressure in the draft tube horizontal part, which in turn reduced the amplitude of low-frequency pulsation of pressure in the draft tube; the nitration of rotor-stator between the runner and air inlet resulted in an increment in the pressure pulsation of the blade-frequency in front of the runner. Jeong et al. (Citation2008) explained the numerical investigation of gas flow moving via a snubber in a hydrogen gas compressor unit. In their study, 30 snubber models were generated by changing the height of the snubber angle of buffer. Afterwards, the models were simulated with the real working operation of a hydrogen gas compressing system. A Star CD, which had transient analysis and used a k-ϵ / high Reynolds number transient model, was used as a Computational Fluid Dynamic (CFD) code package. The research was carried out by comparing pressure loss and the pulsation of pressure, since the factors noted are the objective functions of optimizing the snubber. Numerical outcomes showed that pressure loss increases with the increment in the volume of the snubber. To the contrary, however, the pressure pulsation is decreased. By determining the angle of buffer as the adjusted variable, the lowest pressure loss was obtained at 30°; however, the trend of the pulsation of pressure was escalating. Akbar, Shim, and Yi (Citation2006) and Akbar, Shim, Yi, Chung, and Jeong (Citation2006) experimentally investigated the decrease in pressure pulsation in the compressing system using a snubber with and without buffer. The experiment measured pressure at the inlet and outlet of the snubber. It used an air compressor as a model of a hydrogen one. Snubbers with and without a buffer were utilized in order to reach comprehensive comparison between both of the systems noted. An analysis by employing a Fast Fourier Transform (FFT) approach was carried out to verify the frequency of operating pressure. They observed that pulsation was increasing proportionally in the cases where there was an increment in the driver motor frequency.
During investigating different aspects of technology, CFD has many engineering and medical applications (Alizadeh et al., Citation2018; Ghalandari, Mirzadeh Koohshahi, Mohamadian, Shamshirband, & Chau, Citation2019; Ramezanizadeh, Alhuyi Nazari, Ahmadi, & Açıkkalp, Citation2018). CFD-based simulation of utilizing natural gas in a dual-fueled diesel engine was done on a dual-fueled constant-speed engine (Akbarian et al., Citation2018). The outcomes of the study revealed that under different loads and pilot to gaseous fuel ratios, the nitrous oxides and particle materials emissions in the dual mode were lower than the corresponding values of the diesel engine. Faizollahzadeh Ardabili et al. (Citation2018) reviewed a computational intelligence method for modeling hydrogen production. Chau and Jiang (Citation2002, Citation2004) developed a 3-D numerical model for pollutant transport, which was on the basis of orthogonal curvilinear and sigma coordinate systems in horizontal and vertical directions, respectively. A simple open boundary condition was considered in the model noted. Furthermore, Ramezanizadeh, Alhuyi Nazari, Ahmadi, and Chau (Citation2019) numerically investigated a thermosyphon-based heat exchanger and compared its performance with other kinds of heat exchangers.
The aim of the pulsation analysis is to prevent difficulties such as: an unfavorable level of fluctuations and vibrations and cyclic pipe stresses leading to fatigue failure; increased consumption of power and loss of capacity; hammering of compressor valves, relief valves and check valves due to oscillations; and inaccuracies of devices used for flow measurement. Most of the studies in this area have been carried out to investigate the effect of snubber applications in the output of the compressor; a few studies have been conducted to investigate the effect of snubber application in the suction line of the compressor. The aim of this article is to propose a snubber at the suction line of the compressor of a CNG station to decrease pressure pulsation, and finally eliminate or decrease compressor effects on the measuring of the NG flow rate. To achieve this aim, 3D numerical investigation is conducted in ANYSYS FLUENT for a snubber between a turbine flow meter and a reciprocating compressor. This investigation studies the effect of buffer application on pressure specifications. Significant pressure specifications such as pressure drop and pressure pulsation are also studied in order to optimize the snubber. It should be noted that the best snubber has minimum pressure loss and pressure pulsation.
2. CNG station equipment and the application of a snubber
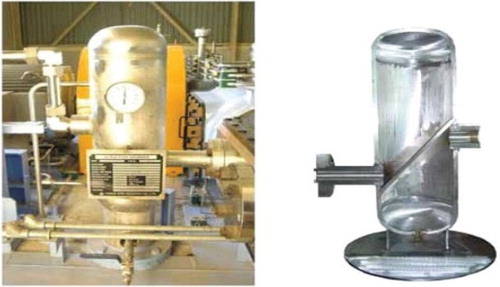
CNG stations receive fuel via a local utility line at a pressure lower than that used for vehicle fueling. The gas is compressed to a higher pressure for vehicle fueling. According to the storage capacity, the size of the compressors and dispensing rate, CNG stations are of three types: fast-fill; time-fill; and combination-fill. The CNG fueling equipment includes compressors, a dryer, storage, dispensers and flow meter. As mentioned, one of the problems of such a fueling station is the error occurring in measuring the gas flow due to the oscillating flows. To eliminate or decrease these pulsations, the solution is the application of a snubber in these stations. Figure schematically shows a snubber. To improve the performance of the snubber, a metal plate called a buffer is placed inside the snubber. It is also shown how to connect this buffer to the snubber.
Figure 1. Schematic of a snubber (Jeong et al., Citation2008).
2.1. Minimum volume of the snubber
In this project, the snubber volume of a CNG station is investigated for 250 psi (17.1 bar) inlet gas pressure. The minimum volume of a snubber in a suction line of a compressor is calculated according to API standard 618. This standard covers the lowest needs for reciprocating compressors and their drivers for utilization in the gas, petroleum and chemical industries. One of the important subjects of the standard is pulsation analysis. This standard proposes a relation for a minimum volume of a snubber in the suction line of a compressor as below:
(1)
(1)
(2)
(2)
In Equation (1), ,
,
, M and PD are the minimum volume of a snubber (m3), compressibility factor, gas temperature at suction line of compressor (K), molar mass and displacement volume after one revolution of the crankshaft. The maximum allowed pulsation of a snubber is calculated as below:
(3)
(3)
In Equation (3), is mean pressure of line. Thus according to the line pressure of 17.1 bar, the maximum allowed pulsation equals 1.6% of line pressure. The minimum volume is presented in Table .
Table 1. Minimum volume according to standard API 618.
2.2. Calculation of drop in pressure pulsations
The main objective of this article is to decrease the pressure pulsations at the inlet of the snubber. Thus three equations are defined as below (Jeong et al., Citation2008):
(4)
(4)
(5)
(5)
(6)
(6)
In these equations, ,
,
,
and
, are the pressure difference between the inlet and outlet of the snubber, pressure at the inlet of the snubber, pressure at the outlet of the snubber, and the maximum and minimum pressure of the cycle, respectively. In addition,
,
,
and
are the percentage of pressure pulsation amplitude related to the line pressure, percentage of pressure pulsation drop, pressure pulsation amplitude of inlet and pressure pulsation amplitude of outlet. Decrease in pulsations means a decrease in A (Akbar, Shim, Yi, Lee, et al., Citation2006; Jeong et al., Citation2008).
3. Numerical analysis
3.1. Governing equation
One of the most significant choices in CFD is the verdict of an applicable turbulence model. The main aim of any turbulence model is providing an approach for determining the impact of turbulence fluctuations on the mean flow field. In the present study, the k-ϵ model has been implemented. The k-ϵ model is the most conventional and validated turbulence model, applicable for different flow fields, which indicates its appropriateness. It is generally applicable for free-shear layer flows with relatively average pressure gradients in addition to the confined flows where the Reynolds shear stresses are most important. A differential form of continuity equation is as follows (Jeong et al., Citation2008):
(7)
(7)
Generally, conservative equations of turbulent fluid flow are written as:
(8)
(8)
A conservative equation of Energy is written as (Jeong et al., Citation2008):
(9)
(9) λ is Thermal Conductivity in Equation (9). These equations, called RANS, are nearly identical to the original Navier-Stokes equations written for the mean flow variables. These equations are explicit and no assumptions have been applied to achieve them. Stress tensor is defined by Equation (10) and components of
are known as Reynolds stress (Jeong et al., Citation2008).
(10)
(10)
(11)
(11)
(12)
(12)
is presented as below (Jeong et al., Citation2008):
(13)
(13)
(14)
(14)
The coefficients of Equation (13) and Equation (14) are defined as below (Jeong et al., Citation2008):
(15)
(15)
(16)
(16)
3.2. Geometry, modeling and grid system
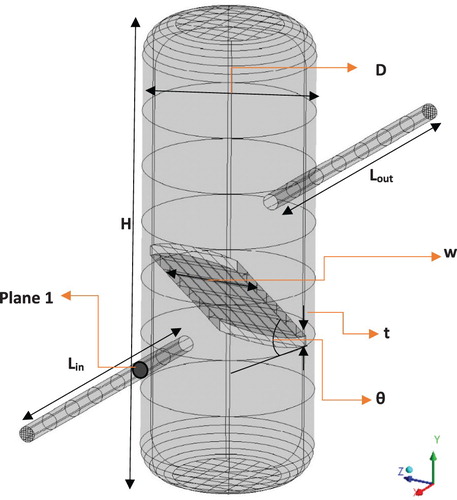
Problem geometry includes an inlet pipe of 2 in diameter and 1 m length, and an outlet pipe of 2 in diameter and different lengths. In addition, a cylinder exists between these two pipes. We study this cylinder in two cases, with and without a buffer. In order to find the suitable snubber, many geometries and many parameters are studied including the effects of snubber volume to the minimum volume ratio, the ratio of height to diameter (H/D), the outlet pipe length and usage or not to use a buffer in the snubber. Figure shows the geometry of the equipment and Figure presents the geometric parameters and the location of symbols in the geometry. In Figure , plane 1 is observed at the inlet of snubber cylinder. To measure pressure pulsation, this plate is located at a distance of 10 cm from the cylinder wall.
Figure 2. A view of the equipment geometry.
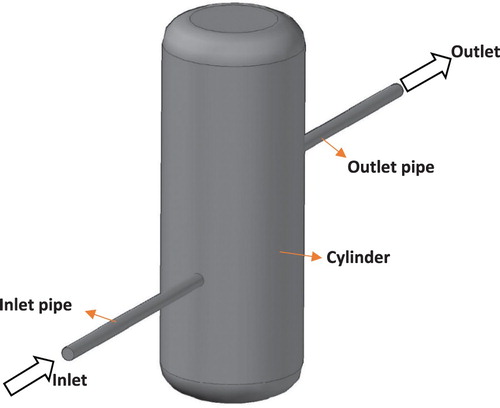
Figure 3. Location of symbols in the geometry and plane 1.
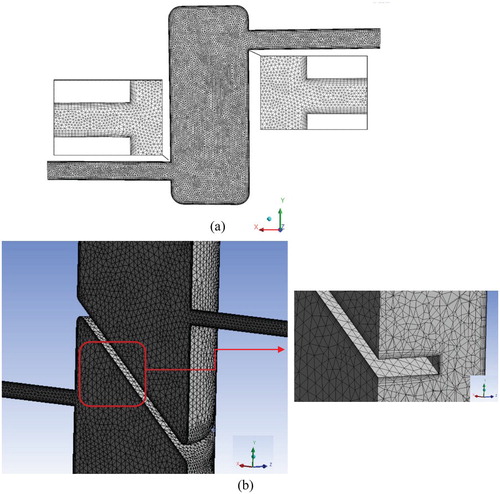
Then it is required to generate a suitable mesh. High mesh quality is necessary to solve the problem. Course mesh produces large numerical errors in the solution while very fine mesh can be unacceptably expensive. Thus finding the right mesh that meets the accuracy and be run in an acceptable time is very important. To check the mesh quality, the parameter of Skewness is used. The value of this parameter for each cell is between 0 and 1. A smaller value of Skewness presents a higher mesh quality. For 3D geometries, it should not exceed 0.75. Figure depicts the mesh of geometry for two cases, with and without a buffer. The mesh includes the structured and unstructured meshes. Far from the wall, unstructured mesh with pyramid shaped elements and near the wall of the pipe, cylinder and buffer, hexahedral structured mesh is considered. To decrease mesh number and iteration, symmetry of xy plane is used in the modeling of the problem.
Figure 4. A general view of the geometry grid: (a) without a buffer; and (b) with a buffer.
3.3. Boundary conditions
The boundary conditions include constant velocity at the inlet, pressure pulsation at the outlet, symmetry at xy plane for the inlet and outlet pipes and cylinder wall. Based on the type of CNG station with an inlet pressure of 17.1 bar and according to Table , the volumetric flow rate under normal condition is 950 by the measure of a turbine flow meter. According to the inlet pipe diameter of 2 in, the equality of mass flow rate at normal condition and real condition, inlet velocity is considered to be 8.42
. It should be noted that under normal condition, pressure is 1 atm and temperature is 15°C; under real condition, the pressure is 17.1 bar and temperature is 25°C. The values of velocity and density of the methane under real and normal conditions are presented in Table .
Table 2. Inlet conditions.
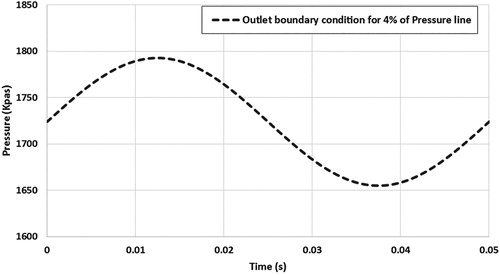
The pressure outlet boundary condition is selected for an outlet boundary which is connected to the compressor inlet or the source of pressure pulsations. To enter the amount of pressure pulsations as sinusoidal functions of time, UDFs are attached to FLUENT (Figure ). It should be noted that the base pressure is 250 psi (17.1 bar). The problem is solved for three pressure pulsations: 5, 10 and 25 psi (equivalents to 2%, 4% and 10% of line pressure). Also according to the rotational speed of the compressor crankshaft which is equal to 1200rpm, each compressor cycle occurs in 0.05 s. Figure shows boundary condition at the outlet of snubber for amplitude of pressure pulsation of 4% of the line pressure. The boundary condition of inner cylinder wall and pipes is defined as a rigid wall with no-slip conditions. It means that the adjacent gas has no velocity. This boundary condition is employed for continuity, momentum, turbulence kinetic energy and turbulence dissipation rate.
Figure 5. Boundary condition of outlet-pulsation amplitude 4% of line pressure.
3.3.1. Solver settings
Fluent settings, Model Solver and the solution method used in the simulation are presented in Table . A second order implicit unsteady solver was used in the simulation.
Table 3. FLUENT settings.
3.4. Verification of the computational method
For mesh dependency, seven mesh grids of 1383, 5676, 10,535, 50,580, 106,032, 222,234 and 417,362 are employed. In this study for a case with no buffer, the percentage of pressure pulsation amplitude of geometry is studied for minimum volume, output length of 1 m and height to diameter ratio of 2. As Figure depicts, the variation of the percentage of pressure pulsation amplitude is negligible for mesh grids greater than 200,000. Thus to reduce the computing cost, a mesh grid of 222,234 cells is employed.
Figure 6. Mesh dependency of the model.
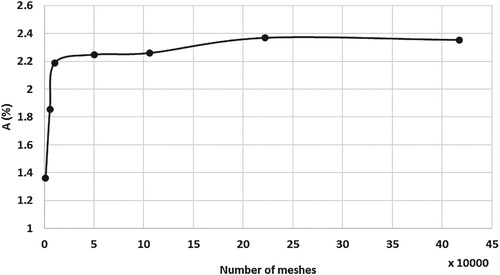
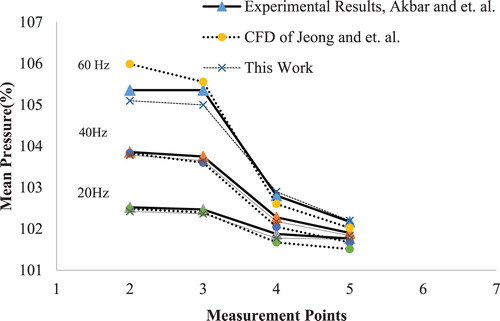
Figure shows comparison between the results of this paper and the experimental study of Akbar, Shim, Yi, Chung, et al. (Citation2006) and CFD work of Jeong et al. (Citation2008). In this figure, the same trend between CFD and the experimental results is observed. The mean pressures of each case were compared for three motor frequencies. Good agreement can be seen with a maximum of only 0.43% of the difference.
Figure 7. Validation with previous works.
4. Results and discussion
In the current study, the effect of different geometrical parameters on inlet pressure pulsation have been investigated. The effects of these parameters are discussed in this section.
4.1. Height to diameter ratio
API standard 618 describes a relationship for the minimum volume of a snubber, while it does not express a relationship for the ratio of height to diameter of the cylinder. One of the effective parameters in determining the optimum design of the snubber is the ratio of height to diameter of the cylinder (H/D). For H/D values of 1, 2, 3 and 4, study is performed at the minimum snubber volume, pressure pulsation of 10 psi (4% of line pressure), and exit length of 1 m with no buffer. Height, diameter and the ratio of height to diameter of the cylinder are presented in Table .
Table 4. The ratio of height to diameter of the cylinder.
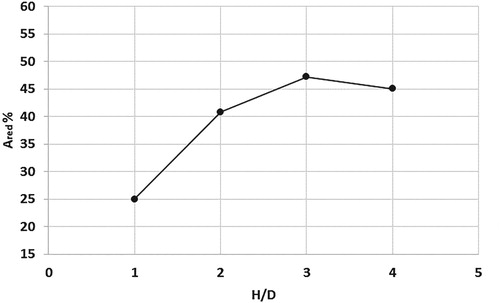
For H/D values of 1, 2, 3 and 4, study is performed at the minimum constant snubber volume, pressure pulsation of 10 psi (4% of line pressure), and outlet pipe length of 1 m with no buffer. In API Standard 618, it is stated that for a snubber with a single cylinder, the ratio of height to diameter should not exceed more than 4. Thus the maximum value of H/D is set to 4. Figures and state that the maximum reduction in percentage of pressure pulsation drop is about 47%, which takes place with a H/D value of 3.
Figure 8. Percentage of pressure pulsation amplitude versus H/D pulsation amplitude 4% of line pressure.
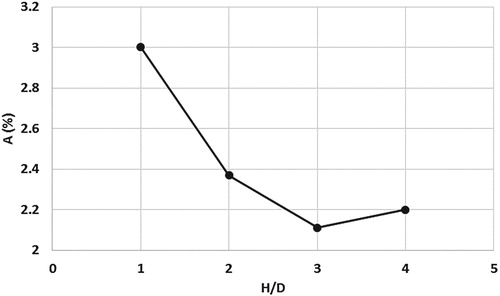
Figure 9. Percentage of pressure pulsation drop versus H/D pulsation amplitude 4% of line pressure.
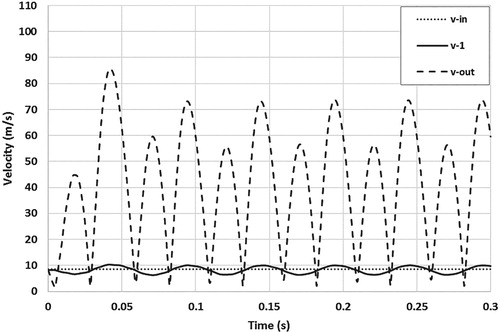
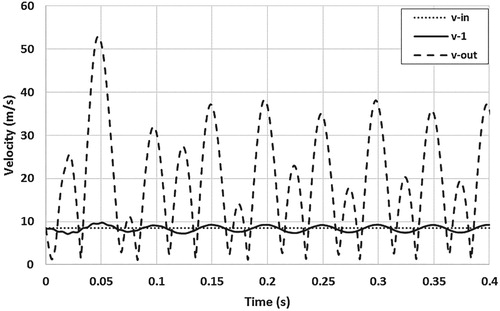
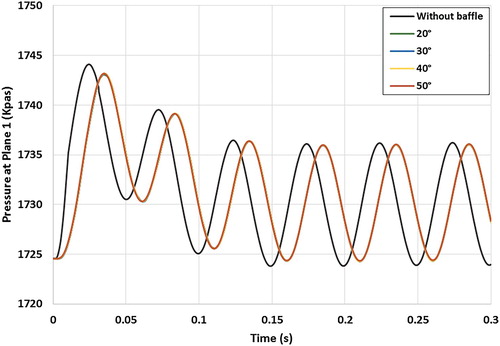
For plane 1, inlet and outlet of the snubber, Figures and present pressure and velocity variation resulting from pressure pulsations of the outlet within 0.3 s of the compressor start for H/D = 3. Time phase difference between the inlet and outlet of the snubber is produced due to the fact that time is running out when pulsations reach the inlet and outlet of the snubber. As is clear, the pressure pulsations decrease with the presence of the snubber. In Figure , it is seen that the velocity is high in some moments due to the high pressure difference between the inlet and outlet of the snubber. In some moments the velocity approximates to 0 and this is while the pressure difference between inlet and outlet is insignificant. According to Figure , when pressure at the inlet of the snubber is at the maximum value of 1770 kPa, pressure at the outlet is at the minimum value of 116 kPa. Based on these results, from the compressor start-up (from the first cycle to the second cycle), the peak pressure pulsation decreases; after the second cycle, we witness the constant pulsations and equality of the minimum and maximum values of pressure in each cycle. In comparison with outlet velocity amplitude, smaller velocity amplitude is produced at the inlet.
Figure 10. Pressure pulsation over time at H/D = 3.
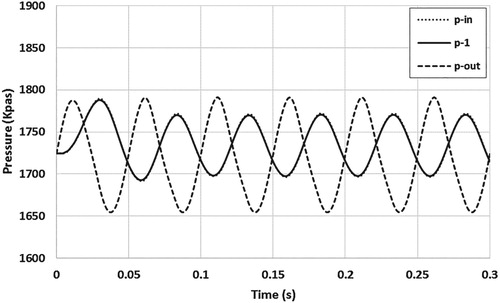
Figure 11. Velocity pulsation over time at H/D = 3.
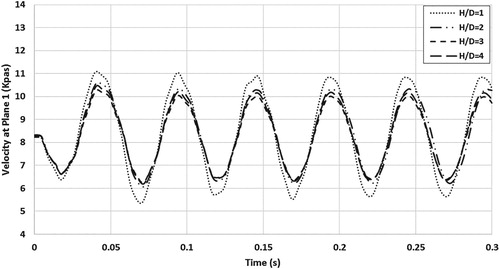
For six working cycles of a compressor, Figures and indicate the variation of pressure and velocity on plane 1, located 10 cm from the snubber inlet and 0.3 s from the start of pulsation at the outlet. Excepting the H/D value of 1, for other ratios, there is little difference between the pulsations for both pressure and velocity.
Figure 12. Pressure pulsations over time for different values of H/D.
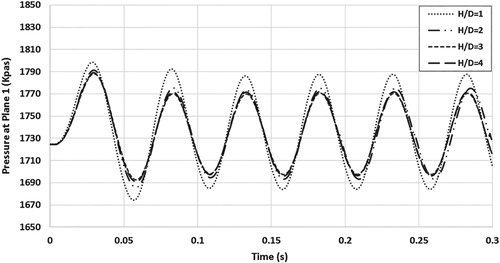
Figure 13. Velocity pulsations over time for different values of H/D.
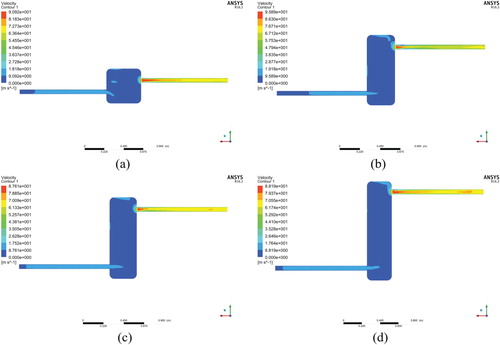
Figures and present contours of pressure and velocity for different values of H/D. These contours are for 0.3 s. Figure shows comparison between H/D values of 1, 2, 3 and 4. Pressure difference between the inlet and outlet of the snubber decreases while for higher values of H/D, no difference is observed. According to Figure , the same trend occurs for velocity difference. It means velocity difference decreases for H/D value of 1 and 2 while for H/D values of 2, 3 and 4, no remarkable velocity difference is observed in the velocity field.
Figure 14. Pressure contours in 0.3 s for different values of H/D: (a) H/D = 1; (b) H/D = 2; (c) H/D = 3; (d) H/D = 4.
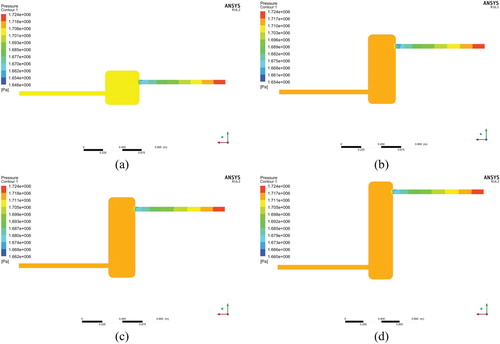
Figure 15. Velocity contours at 0.3 s for different values of H/D: (a) H/D = 1; (b) H/D = 2; (c) H/D = 3; (d) H/D = 4.
4.2. The length of outlet pipe
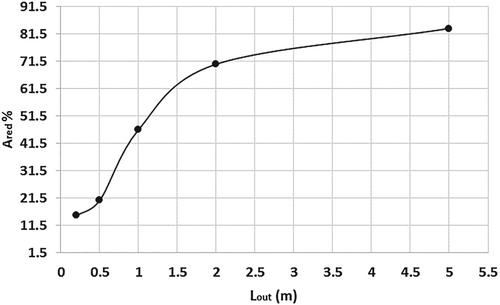
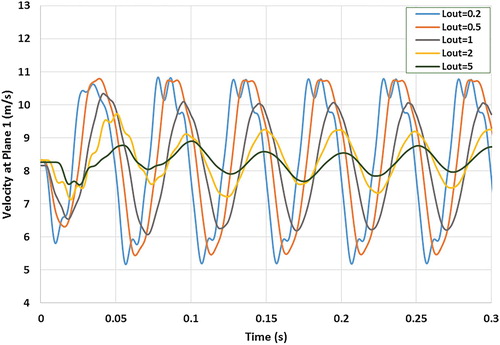
The other parameter studied here is the outlet pipe length, Lout, the distance of the connecting pipe between the snubber and the compressor. The lengths of 0.2, 0.5, 1.0, 2.0 and 5.0 m are considered. This case is done at minimum snubber volume, pressure pulsation of 10 psi (4% of line pressure) and H/D value of 2.5 with no buffer. The length of snubber outlet pipe, in fact, is the distance between the snubber and the compressor or the source of pulsations. The results were obtained for a snubber with a volume equal to the minimum volume calculated by standard API 618. The length of inlet pipe is 1 m, H/D is 2.5 and amplitude of pressure pulsation is 4% of line pressure. The aim of this section is to prove that by increasing the length of the snubber outlet pipe, the pressure pulsation effects on the flow meter can be decreased. The length of the snubber outlet pipe is designed according to the space of CNG station. While Figures and show that the greater the distance from the compressor, the lower the effect of pressure pulsations of compressor on the pressure pulsations of the snubber inlet, the amplitude of pressure pulsations of 3.2% of line pressure for outlet pipe length of 0.5 m reaches to 0.7% for outlet pipe of 5 m. It means that the drop in pressure pulsations will be about 83% for an outlet pipe of 5 m. The reason is the pressure drop, which damps the impact of these pulsations by increasing the length of the pipe. This result also states that with a small snubber volume equal to the minimum volume with increasing distance from the compressor, pulsations can be significantly decreased. It should be noted that the best place to install a snubber at the station is immediately after the measurement unit and before the dryer of the compressor.
Figure 16. Percentage of pressure pulsation amplitude versus the length of outlet pipe – pulsation amplitude 4% of line pressure.
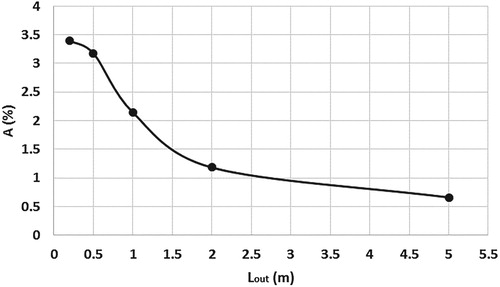
Figure 17. Percentage of pressure pulsation drop versus the length of outlet pipe – pulsation amplitude 4% of line pressure.
For outlet pipe length of 2 m, Figures and show the effects of pressure pulsation and velocity pulsation of the outlet on the pressure pulsation and velocity pulsation of inlet for plane 1 and in 0.4 s from the compressor start-up. At first cycles, the decreasing trend of the pressure pulsation at the inlet shows the effect of the application of the snubber. From the fourth cycle, the amplitude of pressure and velocity pulsations at the inlet and outlet reaches constant values, the maximum pressure of 1745.5 kPa and the minimum pressure of 1704.7 kPa. According to Figure , a maximum velocity of 9.25 m/s and a minimum velocity of 7.32 m/s are achieved at the inlet of the snubber. Thus amplitude of velocity pulsations is 0.9 m/s.
Figure 18. Pressure pulsation over time for Lout = 2m.
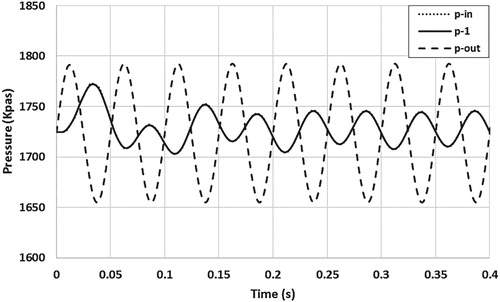
Figure 19. Velocity pulsation over time for Lout = 2m.
To compare the pressure pulsation and velocity pulsation over time at the inlet of the snubber for different values of outlet pipe length, Figures and are presented. These figures clearly show a decreasing trend of pulsation amplitude with increasing the outlet pipe length in 0.3 s from the compressor start-up; as output pipe length increases, the pulsation amplitude also decreases. The results are not in the same time phase because with an increase in outlet length, it takes more time to affect pulsations on the input.
Figure 20. Pressure pulsations over time for different values of Lout = 2m and pulsation amplitude 4% of line pressure.
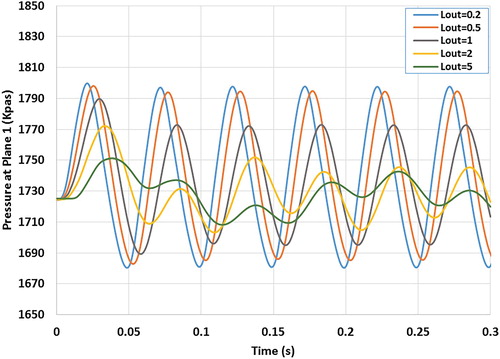
Figure 21. Velocity pulsations over time for different values of Lout = 2m and pulsation amplitude 4% of line pressure.
4.3. The ratio of current volume to the minimum volume (CV)
The other parameter playing an important role is the ratio of snubber volume to the minimum volume . A few cases are studied with CV ratios of 1, 2, 5, 10 and 16.7 and pressure pulsations of 5, 10 and 25 psi (2%, 4% and 10% of line pressure). These cases are done at the outlet pipe length of 1 m, and an H/D value of 2.5 with no buffer. Table presents the ratio of height to diameter of the cylinder. Table presents the geometric dimensions of a snubber cylinder for various CV ratios.
Table 5. Geometry dimensions of the snubber cylinder.
Figure shows the percentage of pressure pulsation amplitude. Increasing the snubber volume effectively controls pressure pulsations, so that for amplitude of pressure, pulsations decrease from 4.1% to 0.25% at the inlet for CV ratios of 1–16.7. According to Equation (3), the maximum allowed value for the pressure pulsations is 1.6% of line pressure.
Figure 22. Pulsation amplitude of pressure versus CV ratios and different pulsation amplitudes.
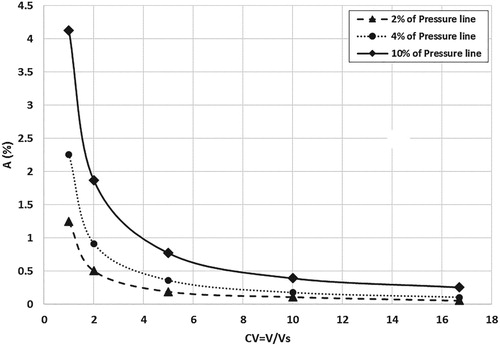
Percentage of pressure pulsation drop resulting from the variation of snubber volume is shown in Figure . It is clear that for CV ratios greater than 5, 90% of pulsations are damped. In CV = 1, we see that for 10% of the line pressure, the percent of pressure pulsation drop is 58% while for 2% of line pressure, the percent of pressure pulsation drop is 38%. To compare the pressure and velocity variations over time at the inlet of snubber, Figures and are given. These graphs present well the decreasing trend of pulsation amplitude by increasing the volume in 0.3 s of the compressor start and at 4% of the line pressure. According to Figure , it can be seen that from the second cycle, pulsation amplitude is fixed and the maximum and minimum values of each cycle are the same. In CV = 1, maximum and minimum pressures are 1773 kPa and 1695 kPa and the difference of these values are 78 kPa; in CV = 16.7, maximum and minimum pressures are 1731 kPa and 1728 kPa and the difference is 3 kPa.
Figure 23. Percent of pressure pulsation drop versus CV and different pulsation amplitudes.
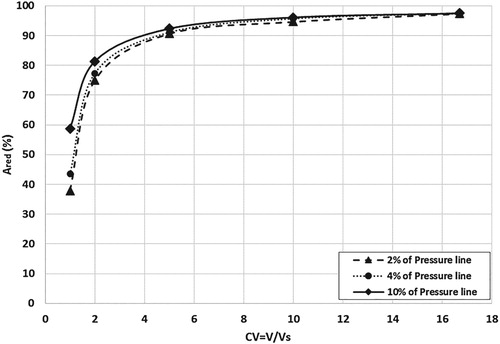
Figure 24. Pressure pulsations over time for different values of CV and pulsation amplitude 4% of line pressure.
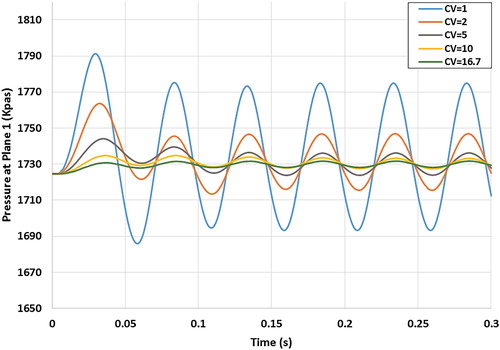
Figure 25. Velocity pulsations over time for different values of CV and pulsation amplitude 4% of line pressure.
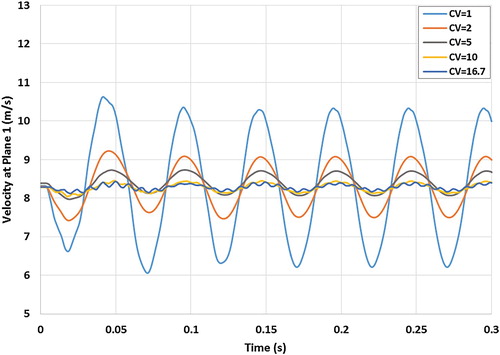
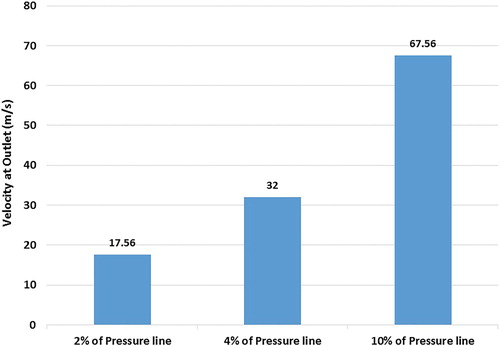
For different values of CV, Figure shows that velocity as well as pressure has constant pulsations from the second cycle. In CV = 1, the maximum and minimum velocities are 10.3 and 6.2 m/s with an amplitude about 2 m/s, while in CV = 16.7, the maximum and minimum velocities are 8.43 and 8.14 m/s with an amplitude about 0.15 m/s. Figure shows average velocity for pulsation amplitude of 2%, 4% and 10% of the line pressure. Here line pressure more than 10% is not considered, because for these cases, the produced velocity at the outlet is very high and, in accordance with the Natural Gas standards, gas velocity in the pipelines should not exceed 20 m/s. For line pressure of 10%, the average velocity is about 68 m/s and this high velocity damage severely the valves and fittings. One way to slow down the velocity at the outlet is an increase in the distance between the snubber and the compressor or an increase in the outlet pipe diameter.
Figure 26. Average velocity versus pulsation amplitude.
4.3.1. Buffer existence
Installation of a buffer or a simple blade in the snubber is a proposal to decrease snubber volume. The effect of buffer use in the snubber on pressure pulsations is studied. This parameter is examined for an H/D value of 2.5, amplitude of pressure pulsations 4% of the pressure line, outlet pipe length of 1 m, 4 buffer angles of 20°, 30°, 40° and 50° and 3 CV ratios of 2.5 and 10. The geometric dimensions of the buffer are presented in Table .
Table 6. Geometry dimensions of buffer.
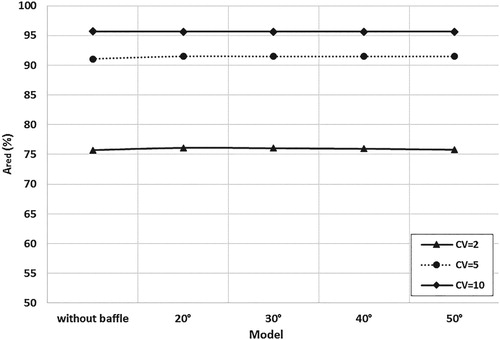
As a proposal to reduce the snubber volume, the presence of a buffer or a simple blade inside the snubber is investigated. This parameter is examined for four angles (20°, 30°, 40° and 50°), the CV values of 2, 5 and 10, H/D value of 2.5, pulsation amplitude of 4% line pressure and an outlet pipe length of 1 m. Then a comparison with a no buffer case was performed. The application of a buffer in the snubber is provided by Jeong et al. (Citation2008). To decrease pressure pulsations in the outlet of the compressor, they used blades and achieved good results in damping pulsations. But as shown in Figures and , when a snubber is installed at the compressor inlet, the utilization of a buffer with different angles or the lack of a buffer have little effect in reducing amplitude, especially for CV = 10.
Figure 27. Pulsation amplitude of pressure versus buffer angle and pulsation amplitude 4% of line pressure with and without buffer.
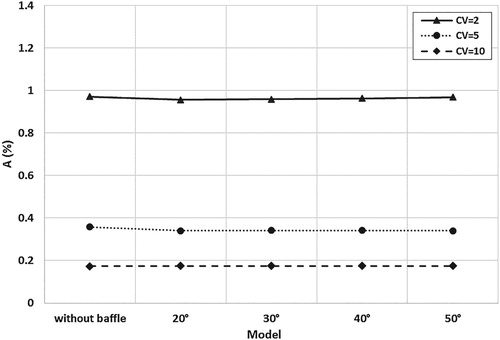
Figure 28. Percent of pressure pulsation drop versus buffer angle and pulsation amplitude 4% of line pressure with and without buffer.
For CV = 5, Figure shows the variation of pressure pulsations at the inlet with and without a buffer. As is clear, the variation of buffer angle has no effect in reducing the pulsation amplitude, but in the model without the buffer, the time phase is earlier compared to the model with a buffer. This is due to the rotation of the gas flow behind the buffer for a while.
Figure 29. Pressure pulsation at the inlet over time with and without the buffer CV = 5.
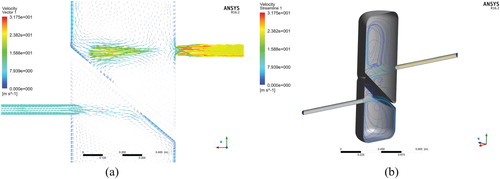
Figures – show the stream lines and the velocity vector in a cycle, for four moments. At 0.2 s, pulsations start at the outlet and increase gradually until 0.2125 and reach the maximum pressure value. In the outlet pipe, flow direction is against the direction of inlet flow. Then pressure reaches the minimum value at the outlet at 0.2375 s and again the flow continues in the direction of inlet flow.
Figure 30. Flow contours in a snubber with the buffer at 0.2 s: (a) velocity vector; (b) stream lines.
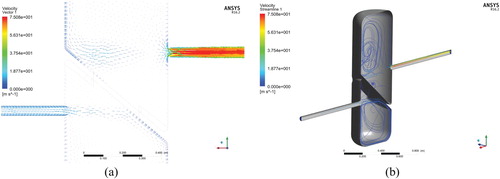
Figure 31. Flow contours in a snubber with the buffer at 0.2125 s: (a) velocity vector; (b) stream lines.
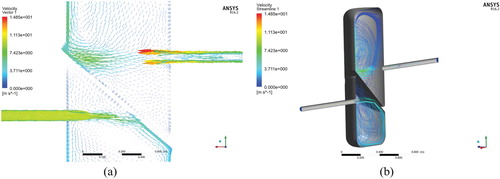
Figure 32. Flow contours in a snubber with the buffer at 0.225 s: (a) velocity vector; (b) stream lines.
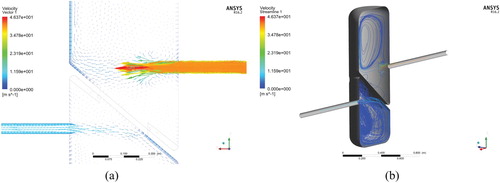
Figure 33. Flow contours in a snubber with the buffer at 0.2375 s: (a) velocity vector; (b) stream lines.
5. Conclusions
Turbine flow meters are extensively used in CNG fueling stations to measure the volumetric flow rate of the inlet NG. These types of flow meters are very sensitive to oscillating flows. When a reciprocating compressor starts operation, due to piston and valve performance, oscillating flows are created in the suction line of the compressor (downstream of turbine flow meter). These pulsations make errors in measurement and are the source of difference between the gas supplier and gas consumer. In this study, the numerical simulation of a snubber was investigated. The snubber is located after the turbine flow meter and before the compressor. The final target is to eliminate or reduce the effects of the compressor on the turbine flow meter in a CNG station and consequently to reduce measurement errors. To achieve this goal and study the effects of different geometrical parameters, governing equations were supplemented for compressible fluid. The boundary conditions are a non-slip condition on the walls, constant velocity at inlet and pressure pulsation at outlet. Continuity, momentum and turbulent equations were solved by ANSYS FLUENT software. Numerical simulation of the snubber was carried out for a CNG station with a gas inlet pressure of 17.1 bar and inlet and outlet pipe diameter of 2 in. In this paper, several parameters, including ratio of volume to minimum volume, distance between snubber and compressor, ratio of height to diameter of snubber, and utilization of a buffer in the cylinder are investigated to achieve the best design for snubber dimensions. Comparing the results with previous studies shows that the difference is less than 2%, which indicates the validity of simulation.
Results showed that for the ratio of volume to a minimum volume of 5, the pressure pulsation amplitude would decrease less than the maximum amount limit of 1.6% of pressure line. Furthermore, increasing the distance between snubber and compressor has significant effect on decreasing the pressure pulsation while the application of a buffer inside the snubber has no effect on a decrease in pressure pulsation. The maximum decrease in the percentage of pressure pulsation drop takes place in a height to diameter ratio of 3. The maximum reduction in the percentage of pressure pulsation drop is about 47%, which takes place with a H/D value of 3. Pressure difference between the inlet and outlet of the snubber decreases, while for higher values of H/D, no difference is observed. The same trend occurs for velocity difference, which decreases for H/D values of 1 and 2, while for H/D values of 2, 3 and 4, no remarkable velocity difference is observed in the velocity field. Based on the results, from the first cycle to the second cycle, the peak pressure pulsation decreases; after the second cycle, we witness the constant pulsations. In comparison with an amplitude of velocity pulsation of the outlet, a smaller amplitude of velocity pulsation is produced at the inlet. The greater the distance from the compressor, the lower the effect of pressure pulsations of the compressor on the pressure pulsations of the snubber inlet. The amplitude of pressure pulsations are 3.2% and 0.7% of the line pressure for outlet pipe length of 0.5 and 5 m. This means that the drop in pressure pulsations will be about 83% for an outlet pipe of 5 m in comparison with an outlet pipe length of 0.5 m. In addition, increasing the ratio of snubber volume to the minimum volume effectively controls pressure pulsations, so that for amplitude of pressure, pulsations decrease from 4.1% to 0.25% at the inlet for CV ratios of 1–16.7.
Nomenclature
| = | Percentage of pressure pulsation amplitude related to the line pressure (%) | |
| = | Pressure pulsation amplitude of inlet (%) | |
| = | Area of inlet entrance (m2) | |
| = | Percentage of pressure pulsation drop (%) | |
| = | Pressure pulsation amplitude of outlet (%) | |
| M | = | Molar mass ( |
| P1 | = | Maximum allowed pulsation of snubber (%) |
| PD | = | Displacement volume (m3/rev) |
| = | Pressure at the inlet of snubber (KPa) | |
| = | Pressure at the outlet of snubber (KPa) | |
| = | Maximum pressure of the cycle (KPa) | |
| = | Minimum pressure of the cycle (KPa) | |
| = | Pressure difference between inlet and outlet of snubber (KPa) | |
| = | Mean pressure of line (KPa) | |
| = | Inlet mass flow at normal condition (Kg/s) | |
| = | Gas temperature at suction line of compressor (K) | |
| = | Fluid velocity at the inlet (m/s) | |
| = | Minimum volume of snubber () (m3) | |
| = | Density of methane under normal condition (kg/m3) | |
| = | Density of methane under real condition (kg/m3) | |
| = | Compressibility factor (-) |
Disclosure statement
No potential conflict of interest was reported by the authors.
Related Research Data
References
- Akbar, W. A., Shim, K., Yi, C., Chung, H., & Jeong, H. (2006). A study on pressure characteristics in the snubber of hydrogen gas sompressor. , 1–6. Retrieved from http://www.dbpia.co.kr/journal/articleDetail?nodeId=NODE00853539&language=ko_KR
- Akbar, W. A., Shim, K., Yi, C., Lee, K., Chung, H., & Jeong, H. (2006). Pressure characteristics analysis on various types of with-buffer snubber for hydrogen compressing system. , 341–346. Retrieved from http://www.dbpia.co.kr/journal/articleDetail?nodeId=NODE01031126&language=ko_KR
- Akbar, W. A., Shim, K. J., & Yi, C. S. (2006). Gas pressure fluctuation characteristics inside pipe line passing through a snubber for hydrogen gas compressor. Proceeding of international conference on Sustainable Energy Technologies, Vicenza (pp. 659–664).
- Akbarian, E., Najafi, B., Jafari, M., Faizollahzadeh Ardabili, S., Shamshirband, S., & Chau, K. (2018). Experimental and computational fluid dynamics-based numerical simulation of using natural gas in a dual-fueled diesel engine. Engineering Applications of Computational Fluid Mechanics, 12(1), 517–534. doi: 10.1080/19942060.2018.1472670
- Alizadeh, H., Ghasempour, R., Shafii, M. B., Ahmadi, M. H., Yan, W.-M., & Nazari, M. A. (2018). Numerical simulation of PV cooling by using single turn pulsating heat pipe. International Journal of Heat and Mass Transfer, 127, 203–208. doi: 10.1016/J.IJHEATMASSTRANSFER.2018.06.108
- Atkinson, K. N. (1992). A software tool to calculate the over-registration error of a turbine meter in pulsating flow. Flow Measurement and Instrumentation, 3(3), 167–172. doi: 10.1016/0955-5986(92)90032-Z
- Chau, K. W., & Jiang, Y. W. (2002). Three-dimensional pollutant transport model for the Pearl River Estuary. Water Research, 36(8), 2029–2039. doi: 10.1016/S0043-1354(01)00400-6
- Chau, K. W., & Jiang, Y. W. (2004). A three-dimensional pollutant transport model in orthogonal curvilinear and sigma coordinate system for Pearl river estuary. International Journal of Environment and Pollution, 21(2), 188. doi: 10.1504/IJEP.2004.004185
- Faizollahzadeh Ardabili, S., Najafi, B., Shamshirband, S., Minaei Bidgoli, B., Deo, R. C., & Chau, K. (2018). Computational intelligence approach for modeling hydrogen production: A review. Engineering Applications of Computational Fluid Mechanics, 12(1), 438–458. doi: 10.1080/19942060.2018.1452296
- Farzaneh-Gord, M., Niazmand, A., Deymi-Dashtebayaz, M., & Rahbari, H. R. (2015). Effects of natural gas compositions on CNG (compressed natural gas) reciprocating compressors performance. Energy, 90, 1152–1162. doi: 10.1016/J.ENERGY.2015.06.056
- Farzaneh-Gord, M., Parvizi, S., Arabkoohsar, A., Machado, L., & Koury, R. N. N. (2015). Potential use of capillary tube thermal mass flow meters to measure residential natural gas consumption. Journal of Natural Gas Science and Engineering, 22, 540–550. doi: 10.1016/J.JNGSE.2015.01.009
- Ghalandari, M., Mirzadeh Koohshahi, E., Mohamadian, F., Shamshirband, S., & Chau, K. W. (2019). Numerical simulation of nanofluid flow inside a root canal. Engineering Applications of Computational Fluid Mechanics, 13(1), 254–264. doi: 10.1080/19942060.2019.1578696
- Hou, H., Zhang, Y., Li, Z., & Zhang, Y. (2017). A CFD study of IGV vane number on hydraulic characteristics and pressure pulsation of an is centrifugal pump. Journal of Vibroengineering, 19(1), 563–576. doi: 10.21595/jve.2016.17306
- Jeong, H. M., Chung, H. S., Akbar, W. A., Lee, G. H., Shim, K. J., & Lee, Y. H. (2008). Numerical analysis on various models of pressure snubbers in the hydrogen gas compressing system. Journal of Mechanical Science and Technology, 22(4), 761–769. doi: 10.1007/s12206-008-0104-7
- Jungowski, W. M., & Weiss, M. H. (1996). Effects of flow pulsation on a single-rotor turbine meter. Journal of Fluids Engineering, 118(1), 198. doi: 10.1115/1.2817503
- Lee, B., Cheesewright, R., & Clark, C. (2004). The dynamic response of small turbine flowmeters in liquid flows. Flow Measurement and Instrumentation, 15(5–6), 239–248. doi: 10.1016/J.FLOWMEASINST.2004.07.002
- McKee, R. J. (1992). Pulsation effects on single- and two-rotor turbine meters. Flow Measurement and Instrumentation, 3(3), 151–166. doi: 10.1016/0955-5986(92)90031-Y
- Mujic, E., Kovacevic, A., Stosic, N., & Smith, I. K. (2008). The influence of port shape on gas pulsations in a screw compressor discharge chamber. Proceedings of the Institution of Mechanical Engineers, Part E: Journal of Process Mechanical Engineering, 222(4), 211–223. doi: 10.1243/09544089JPME205
- Notzon, S. (1996). Low pulsation design of piping systems for high pressure reciprocating pumps. Process Technology Proceedings, 12, 575–580. doi: 10.1016/S0921-8610(96)80099-9
- Ramezanizadeh, M., Alhuyi Nazari, M., Ahmadi, M. H., & Açıkkalp, E. (2018). Application of nanofluids in thermosyphons: A review. Journal of Molecular Liquids, 272, 395–402. doi: 10.1016/j.molliq.2018.09.101
- Ramezanizadeh, M., Alhuyi Nazari, M., Ahmadi, M. H., & Chau, K. (2019). Experimental and numerical analysis of a nanofluidic thermosyphon heat exchanger. Engineering Applications of Computational Fluid Mechanics, 13(1), 40–47. doi: 10.1080/19942060.2018.1518272
- Vetter, G., & Schweinfurther, F. (1987). Pressure pulsations in the piping of reciprocating pumps. Chemical Engineering & Technology - CET, 10(1), 262–271. doi: 10.1002/ceat.270100132
- Wu, H., Xing, Z., Peng, X., & Shu, P. (2004). Simulation of discharge pressure pulsation within twin screw compressors. Proceedings of the Institution of Mechanical Engineers, Part A: Journal of Power and Energy, 218(4), 257–264. doi: 10.1243/0957650041200669
- Yu, Y.-T., Na, G.-D., & Kim, J.-H. (2002). Propagation characteristics of pressure pulse of unsteady flow in n hydraulic pipeline. Transactions of the Korean Society of Mechanical Engineers B, 26(1), 1–11. doi: 10.3795/KSME-B.2002.26.1.001
- Zhao, X., Xiao, Y., Wang, Z., Luo, Y., & Cao, L. (2018). Unsteady flow and pressure pulsation characteristics analysis of rotating stall in centrifugal pumps under off-design conditions. Journal of Fluids Engineering, 140(2), 021105. doi: 10.1115/1.4037973
- Zhou, L., Liu, M., Wang, Z., Liu, D., & Zhao, Y. (2017). Numerical simulation of the blade channel vortices in a Francis turbine runner. Engineering Computations, 34(2), 364–376. doi: 10.1108/EC-10-2015-0302