
 ?Mathematical formulae have been encoded as MathML and are displayed in this HTML version using MathJax in order to improve their display. Uncheck the box to turn MathJax off. This feature requires Javascript. Click on a formula to zoom.
Abstract
This research aimed to systematically maximize hydraulic efficiency and suction specific speed for mixed-flow pump using a commercial CFD packages and optimization tool. First, mixed-flow pump was initially designed according to the traditional design method, and then the blade shape was re-designed by focusing on the hydraulic efficiency. Second, the efficiency-oriented optimum design was selected as the reference model. The objective was to improve the suction specific speed under the specific condition of the mixed-flow pump through the multi-objective optimization technique. The incidence angles and meridional plane were optimized through a systematic optimization process, namely, central composite method and response surface approximation. The optimization results indicated that the suction specific speed values of the reference and optimum model were 88.13 and 289.65, respectively. Furthermore, the hydraulic efficiency was kept within ± 1% compared to the reference model as the constraint condition. The hydraulic efficiency of the reference and optimum model were 91.44% and 90.40%, respectively. The reasons for the improved efficiency and suction performance were investigated through internal flow field analysis. Finally, the reliability of the optimization was demonstrated by comparing the numerical and experimental results.
1. Introduction
Mixed-flow pumps are installed to convert the mechanical energy from the pumping of liquids at a certain level or the generation of pressure. These pumps transport liquid in irrigation, drainage, sewage disposal, recirculation, etc. Hence, the need for mixed flow pumps has steadily increased and interest in research into cavitation phenomena is growing. Cavitation is an important and abnormal phenomenon in hydraulic turbomachines that has negative effects, such as severe noise, vibration, erosion, and damage. Most pumping machinery has a cavitation problem that occurs when the pressure at any location decreases to the vapor pressure at the operating temperature. Accordingly, cavities or bubbles grow and become extinct inside the internal flow field (Brennen, Citation2011; Gülich, Citation2010; Karassik, Messina, Cooper, & Heald, Citation2001; Stepanoff, Citation1957).
Many experimental and numerical approaches have been performed to understand the cavitation phenomenon and to suppress the cavitation for improving suction performance. Fu et al. (Citation2015) analyzed the cavitation phenomenon through numerical simulations and flow visualization experiments. The results of this study can be used as an effective reference to help understand and control the complex phenomena occurring in cavitating flows in centrifugal pumps operating under low flow rates. Zhang et al. (Citation2017) investigated the unsteady cavitation characteristics of a centrifugal charging pump. The vapor generation and the growth and collapse of vapor bubbles during the cavitation influenced the pressure and velocity fluctuations. The fluctuations in the impeller and volute showed the same tendency. Bachert, Stoffel, and Dular (Citation2010) experimentally studied the cavitation at the specific location of a centrifugal pump. Direct visualization and particle image velocimetry were used to investigate the velocity field inside and outside the cavitation area. The cavitation in the tongue is similar to the cavitation phenomenon in hydrofoil. But there was a unique difference in the source of instability. Ding, Visser, Jiang, and Furmanczyk (Citation2011) proposed a novel computational fluid dynamics (CFD) methodology and advanced cavitation model. The prediction method of cavitation occurrence was applied to the full cavitation model. This model was detail simulated the phase-change rate expressions according to the Rayleigh–Plesset equation for bubble dynamics. The role of additional geometries such as inlet guide vane (IGV) and inducer on cavitation was also studied. Tan, Zhu, Cao, Wang, and Wang (Citation2014) investigated the effect of pre-whirl regulation on cavitation performance by inlet guide vanes. For the experimental and numerical simulation results of this study, inlet guide vanes can greatly increase the hydraulic performance and have a limited negative influence on the cavitation. Tani, Yamanishi, and Tsujimoto (Citation2012) numerically investigated the flow structure on rotating cavitation in an inducer. The results reported that the cavitation collapse point plays a critical role in the initiation of revolving cavitation and that huge backflow can suppress its influence and positively affect the stable operating range.
Recently, many kinds of research have been investigated to maximize or minimize the objective functions using three-dimensional steady and unsteady computational fluid dynamics with optimization technique for various turbo-machinery applications (Ezhilsabareesh, Rhee, & Samad, Citation2017; Gao, Wang, Pang, & Cao, Citation2016; Jeong & Kim, Citation2018). The common numerical optimization in pumps suppressed the cavitation phenomenon by controlling main rotating components, especially at the meridional plane and blade angles (Liu et al., Citation2013; Visser, Dijkers, de Woerd, & H, Citation2000). Moreover, pump head and efficiency were also sensitive to shape parameters (Tao, Xiao, & Wang, Citation2018; Zhu, Tao, & Xiao, Citation2019). Therefore, when designing a high-performance impeller, both the suction performance and the hydraulic performance must be considered, thereby increasing the complexity of work.
Although several studies have investigated the optimization of a high efficiency and suction performance, systematic and continuous research was not found in the literature. Hence, it is necessary to find a reasonable optimization method, prediction method, and decision-making strategy. This research aimed to provide a guideline for systematically maximizing hydraulic efficiency and suction specific speed for mixed-flow pump using a commercial CFD packages and optimization tool. Prior to performing the study, the numerical optimization and cavitation of previous works were investigated (Choi et al., Citation2016; Suh et al., Citation2018; Suh, Kim, Choi, Joo, & Lee, Citation2017). First, mixed-flow pump was initially designed according to the traditional design method, and then the both impeller and diffuser were re-designed by focusing on the hydraulic efficiency. Second, the efficiency-oriented optimum design was selected as the reference model. The objective was to improve the suction specific speed under the specific condition of the mixed-flow pump through the systematic multi-objective optimization. The hydraulic efficiency was kept within ± 1% compared to the reference model as the constraint condition. The meridional plane and blade angles were optimized using an optimization technique, namely, central composite design (CCD) method and response surface approximation (RSA). The reasons for the improved hydraulic efficiency and suction performance were investigated through internal flow field analysis. Finally, the reliability of the optimization was demonstrated by comparing the numerical and experimental results.
2. Problem description
2.1 Mixed-flow pump model
In commercial and industrial hydraulic pumps, nominal parameters, such as the discharge factor, power factor, and speed factor allow the calculation of the specific speed. The specific speed is most commonly used in the selection of the blade type, which should have the maximum mechanical power and efficiency (Dixon & Hall, Citation2013). The mixed-flow pump with a specific speed of 0.04-class [rad/s, m3/s, m] was selected as subject of this study (IEC60193, Citation1999). The specific speed (nq), speed factor (n11), discharge factor (Q11), and power factor (P11) are defined by Eqs. (1) to (4), respectively. The detailed design specifications of the reference pump model are presented in Table .
(1)
(1)
(2)
(2)
(3)
(3)
(4)
(4) where n, g, Q, H, D and P denote rotational speed, acceleration of gravity, volumetric flow rate, total head, the outlet diameter and power.
Table 1. Design specifications of the reference model.
The mixed-flow pump was initially designed using the method of error triangles (Imaichi, Murakami, Tsurusaki, & Cho, Citation2002). Vane plane development with velocity triangles, the blade length, and the thickness is assumed. Then, the internal flow lines are replotted on the plane view. The both impeller and diffuser were re-designed through single-objective optimization for the hydraulic efficiency (Report No., 10044860, Citation2016). The efficiency-oriented optimum design was selected as the reference model. Figure shows the meridional configuration. As shown in Figure , the three-dimensional shapes of the mixed-flow pump impeller represent the numerical model and manufactured model, respectively. The geometric information of the impeller is presented in Table .
Figure 1. Meridional configuration.
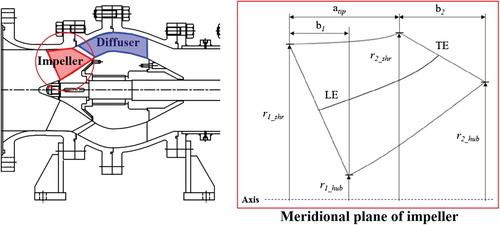
Figure 2. Numerical and manufactured shape of the mixed-flow pump.
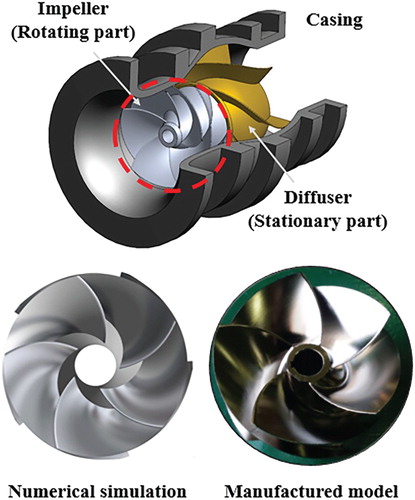
Table 2. Geometrical information of the reference model.
2.2 Design variables
According to the research in the article, the impeller inlet diameter can control that the relative velocity at the leading edge is roughly minimum to reduce friction, shock loss, and leakage loss. When the available NPSH is sufficiently high, this design concept is recommended. The suction specific speeds, which are related value to the suction performance, can be raised to be up to 300 (Gülich, Citation2010). In this paper, the length in the axial direction from the inlet to the outlet parts of the shroud as well as the impeller inlet diameter is selected to enhance the suction performance of the mixed-flow pump.
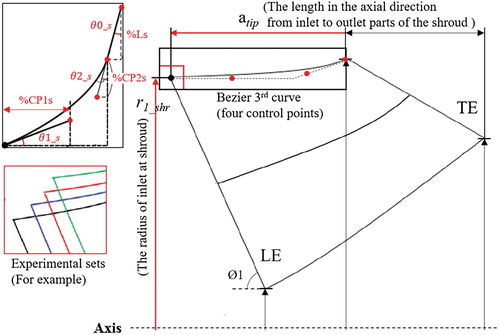
Figure shows the design variables of the meridional plane—the radius of the inlet at the shroud (r1_shr) and the length in the axial direction from the inlet to the outlet parts of the shroud (atip)—controlled by the 3rd Bezier curve. The 3rd Bezier curve has four control points. The three control points excluded from the design variables are presented in red, and one control point is selected as the design variable. The main effect plot of several design variables on the objective function was performed before the numerical optimization was performed. In case of the head, the blade angle at trailing edge and the meridional plane at the trailing edge were found to have great influence. In order to minimize the variation of the head, the blade angle at the trailing edge and the shape of the meridional plane at the trailing edge were fixed. Therefore, this study tried to improve the suction performance on the change of the shape of the impeller inlet diameter with fixed meridional plane except for the one control point. The main advantage by Bezier curve is that the shape of the meridional plane and blade profiles can be changed with minimal control points. For the constraint condition, the range of available values for the meridional plane design variables was 0% to 5% in the axial and radial directions.
Figure 3. Design variables of the meridional plane.
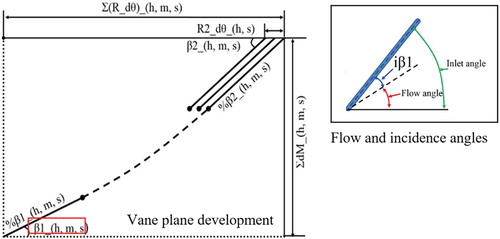
As the meridional shape changes, there is an effect on the blade angle. Because this also affects the hydraulic performance, the incidence angles of the impeller at the hub and shroud were chosen as design variables. The design variables of the incidence angle were set at 0.5° to 8.5°, and the limit was set at 8.5° because the flow separation phenomenon induced as the incidence angle increased. The vane plane development and incidence angle are shown in Figure . For the constraint condition, %1 and %
2 are variables that determine the degree to which the blade angles remain the same at the inlet and outlet, and the same 20%, respectively.
Figure 4. Vane plane development and incidence angle.
3. Numerical analysis method
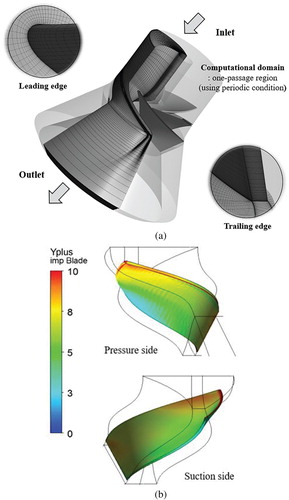
To investigate the subject of the study, a structured grid system was generated in the inside flow-passage using O-type grids near the blade surface and H/C type grids near the blade edges through the commercial software ANSYS TurboGrid-19.1®. Various turbomachines have a low Reynolds number and require computation of laminar sublayer. Shear stress transport (SST) turbulence model is widely applied to secure the shortcomings of the standard k-ε and k-ω models (Leroux, Astolfi, & Billard, Citation2004). The advantages of the k-ω model can be extended by the automatic wall treatment to ensure the accuracy of the pressure gradient regardless of the distance to the nearest wall. However, the standard viscous sublayer model requires that the near-wall grid resolution maintain less than 2 for the well-predict velocity profiles around the wall (Lee, Yuk, & Kang, Citation2017). Therefore, a low Reynolds number SST turbulence model was applied to accurately predict the adverse pressure gradient such as reverse flow and flow separation (Hellsten & Laine, Citation1997). Considering the applied turbulence model, the most of the near-wall grid resolution was densely generated. In case of the computational domain, tip clearance is not taken into consideration. The impeller without tip clearance has less resource requirements, better convergence, and lower time consumption. When considering tip clearance in two-phase flow, the overall resource requirements increases and the convergence deteriorates with increasing number of grids near the shroud (Suh, Kim, Choi, Kim, Joo, & Lee,Citation2018). Therefore, it is not suitable to perform a large number of computations like numerical optimization. Grid dependency tests were conducted for the reliability of the numerical results, and the domains of the in impeller and inlet part were composed of approximately 460,000 and 65,000 nodes, respectively.
A CFD simulation was performed using ANSYS CFX-19.1® (Citation2018). A three-dimensional steady RANS equation was solved for turbulent flow analysis to investigate the characteristics of the flow fields. The governing equations were discretized by the finite-volume method. A high-resolution discretization is adjusted as close to second-order accuracy as possible, ensuring physical boundaries. This adaptive numeric scheme provides robust and accurate discretization for the full range of physics and meshes (Menter, Galpin, Esch, Kuntz, & Berner, Citation2004). The boundary conditions were imposed as follows: at the inlet, the atmospheric pressure was specified, at the outlet, the operating mass-flow rate was specified. A simple periodic calculation domain is suitable for steady cavitation prediction rather than full flow passage with a component of recovering static pressure. The former has better convergence, less time spent, and fewer resource requirements on engineering applications. Furthermore, the single-passage of impeller with diffuser has a tendency to over-estimation in the steady simulations of cavitation prediction (Luo et al., Citation2013).
Three types of frame change/mixing models are widely used such as frozen-rotor, stage-average and transient rotor-stator. The frozen-rotor condition was used as the frame change model. The method of frozen-rotor transforms a rotating domain into a stationary domain depending on the position of the initial grid, and considers it appropriately for all rotating domains. The advantage of this method is that it uses less computer resources than other frame change models, making it suitable for a robust. The computational domain and distribution of the y+ value of the subject of this study are shown in Figure .
Figure 5. Computational domain and distribution of the y+ value, (a) Computational domain, (b) Distribution of the y+value on the blade surface.
A cavitation model was applied to the homogenous flow. Homogeneous models have been widely employed in engineering practice. The two source terms in the mass-transfer equation reflect the evaporation and condensation effects during the phase change. Which can be derived from the generalized Rayleigh–Plesset equation. The converged solutions were obtained after 1,000 iterative cycles with the root-mean-square (RMS) residual values were set below 1.0E-05. Computations were performed with using a personal computer with an Intel Xeon (R) central processing unit with a clock rate of 2.70 GHz. The calculation was subdivided into 20 tasks. The computational time was approximately 8 h. In general, 5–6 numerical analyses are performed to find a 3% head drop point for one experimental set. The time cost used for each experimental set is 40–48 h.
4. Optimization methodology
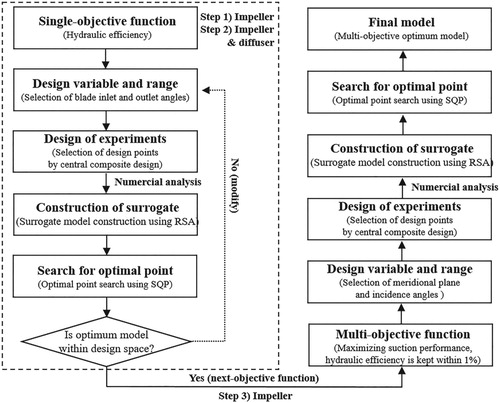
Figure illustrates the multi-objective optimization procedure. This research aimed to systematically maximize hydraulic efficiency and suction specific speed for mixed-flow pump using a commercial CFD packages and optimization tool. First, mixed-flow pump was initially designed according to the traditional design method, and then the impeller and diffuser blades were re-designed by focusing on the hydraulic efficiency. Second, the efficiency-oriented optimum design was selected as the reference model. Third, the objective was to improve the suction performance under the specific condition of the mixed-flow pump via multi-objective numerical optimization.
Figure 6. Multi-objective optimization procedure.
4.1 Objective function
The length of the low-pressure zone under the vapor pressure determines the extent of the cavity area. It is necessary to quantify the cavity for numerical optimization. The minimum local static pressure at the inlet determines the range and occurrence of the cavitation. This local pressure cannot be measured by any simple way. Only numerical methods can be calculated or determined from sophisticated laboratory tests. For the above-mentioned reasons, all cavitation processes are usually quantified by the NPSH value.
In the present study, first, the net positive suction head required (NPSHre), which is an important parameter for evaluating the suction performance of the pump (Limbach & Skoda, Citation2017; Zhang et al., Citation2017), is selected as the objective function. In addition, the suction performance can be expressed by the suction specific speed (Nss) using the objective function. Second, the efficiency-oriented optimum design was selected as the reference model. The hydraulic efficiency was kept within ± 1% compared to the reference model, which is high-efficiency model, as the constraint condition.
The optimum point was derived with the goal of maximizing the hydraulic efficiency and minimizing the NPSHre. The total efficiency, NPSH, NPSHre, and NSS are defined using the following equations (Gülich, Citation2010; IEC60193, Citation1999):
(5)
(5)
(6)
(6)
(7)
(7)
(8)
(8) where ΔPt, T, ω, Qd, Cm2, Pinlet, Pvapor, P3% head and ρ represent the total pressure rise, blade torque, angular velocity, volumetric flow rate at design point, mean axial velocity, pressure at the inlet, vapor pressure, pressure at 3% head drop and density, respectively.
4.2 Response surface approximation
CCD and RSA were applied to investigate the relationship between response factors and quantitative experimental factors. The Box-Wilson Central Composite Design commonly referred to as the ‘CCD’, is useful in response surface methodology to build a second-order model of response variables. It is one of the popular experimental designs. Twenty-five training sets within the range of design variables were generated via CCD (Hick & Turner, Citation1999; Montgomery, Runger, & Hubele, Citation2009). The chosen feasible ranges and training sets are presented in Table . The RSM is beneficial for both single-and multi-objective optimizations (Myers & Montgomery, Citation2002). It includes fitting a polynomial function to discrete responses obtained from each value of a training set. Regression analysis, which is a statistical process, uses data-based mathematical models to examine the relationship among variables. Generally, multiple response analysis performed by building a regression model for each response separately.
Table 3. Feasible design variables and ranges.
5. Results and discussion
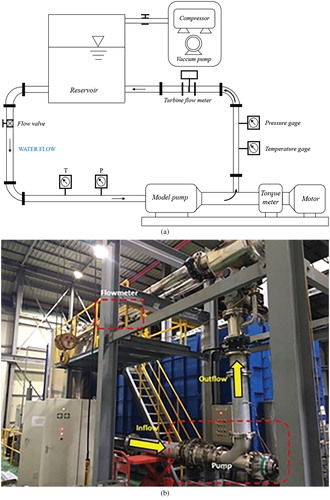
Figure shows a schematic of the experimental apparatus, including the installation of the test pump. The experimental facility employed in this study satisfied the ANSI/HI 1.6 (Citation2000) and ISO 5198 standards (Citation1987). The facility had a closed-loop arrangement with high-precision sensors, such as a flow meter, a pressure gauge, a torque meter, and an RPM meter. The maximum allowed standard deviation for the pressure, flow rate, and torque was within ± 0.2% of the nominal value, and the rotating speed was within ± 0.02% of the nominal value. Thus, the inlet pressure of the pump could be controlled using the vacuum pump and compressor for the cavitation test.
Figure 7. Test facilities of performance evaluation, (a) Schematic of the experimental apparatus, (b) Configuration of the experimental system.
The performance parameters are sufficient for comparing the numerical and experimental results. The cavitation coefficient is defined as follows:
(9)
(9) where u1 represents the peripheral speed at the impeller inlet.
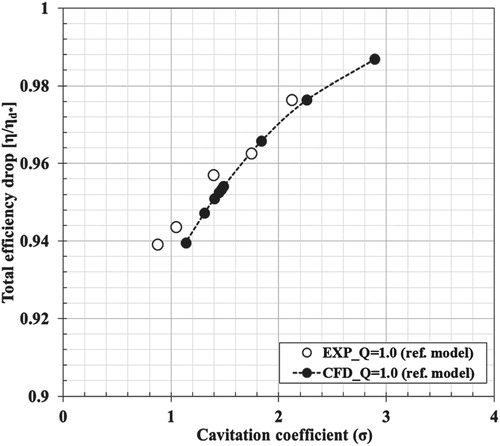
To validate the simulated results of the reference model, the measured total head drop and total efficiency drop performance curves are compared with the experimental results in Figures and . Hd* is the total head rise under the cavitation-free condition, and d* is the total efficiency under the cavitation-free condition. The tendencies of the performance curves generally matched. The prediction error of the total head drop in respect to the cavitation coefficient under the best efficiency condition was only <1%. The prediction error of the efficiency drop in respect to the cavitation coefficient under the best efficiency condition was only <1%. The manufactured model pump has a tip clearance of 0.4 mm, however, tip clearance is not taken into consideration in the computational domain. The difference also occurred because the diffuser was not assembled, and the mechanical losses were not considered in the numerical analysis. The standard head was measured using different methods in the numerical and experimental analyses. In the numerical simulation, it was calculated using single-phase flow analysis at the atmospheric pressure. However, in the experiments, it was measured according to the maximum head obtained from the experiment.
Figure 8. Comparison of the measured head drop performance curves.
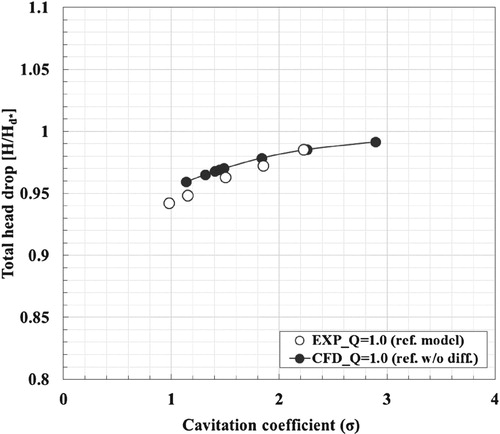
Figure 9. Comparison of the measured efficiency drop performance curves.
Analysis of the numerical optimization was performed through the commercial statistical software MINITAB-17.1® (Citation2003). The results of the regression analysis of the response surface were analyzed including the RMS error of the multi-objective function. For the analyzed results to have acceptable values, the value of required to be in the range of 0.9 <
< 1.0 (Guinta, Citation1997). The values of
for the hydraulic efficiency and NPSHre were 0.9614 and 0.8922, respectively. Therefore, all the predicted values obtained using the numerical analyses and RSA were dependable.
The main effects plot of the efficiency is shown in Figure (a). The efficiency decreased when the meridional plane design variables r1_shr increased. Conversely, as the design variable atip and ißh increased, the efficiency also increased. Moreover, as the ißh changes, the increase and decrease of the efficiency were in the form of a quadratic curve. The main effects plot of the NPSHre is shown in Figure (b). As r1_shr and ißh increased, NPSHre tended to increase. Furthermore, ißs had the tendency of a quadratic curve. atip had a negligible effect on NPSHre. According to the main effects plots, the influence of each variable was analyzed, and the optimum model was derived to maximize the efficiency and minimize the NPSHre.
Figure 10. Main effects plots of the efficiency and NPSHre (a) Main effects plot of total efficiency (b) Main effects plot of NPSHre.
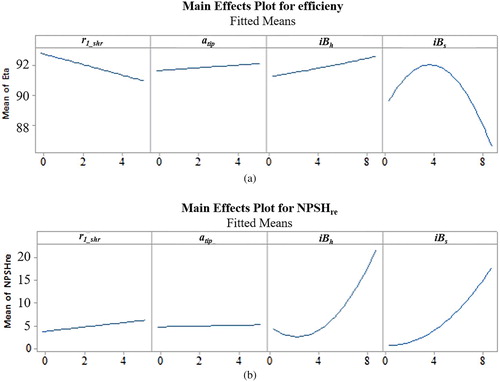
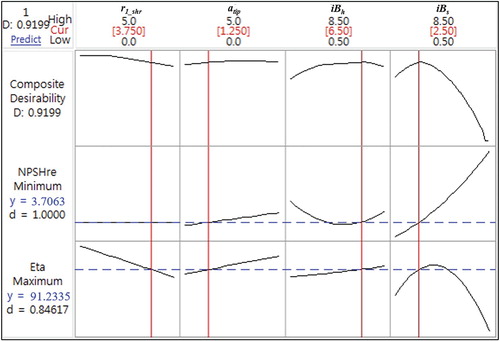
Figure plots the response surface optimization results. The regression analysis was used to analyze the relationship between the design variables and the objective function. The functional forms expressed in terms of the normalized design variables, as follows.
(10)
(10)
(11)
(11)
Figure 11. Response optimization for the impeller.
Here, ,
,
, and
represent the radius of the inlet of the impeller at the shroud (r1_shr), the length in the axial direction from the inlet to the outlet parts of the shroud (atip), and the incidence angles of the impeller at the hub (iβh) and shroud (iβs), respectively.
The values of the calculated results of multi-objective optimization are presented in Table . These were selected as the optimum model to satisfy the objective functions, and the performance was verified via numerical analysis. The predicted efficiency was computed to be 91.23% using the RSA model. It was solved to be 90.40% using the numerical analysis. The predicted NPSHre was computed to be 3.70 [m] using the RSA model. It was solved to be 4.37 [m] using the numerical analysis. As a result of the design optimization, the NPSHre values of the reference and optimum model are 21.38 and 4.37 [m], respectively. The calculation of the Nss of the optimum model was approximately 289.65, which was increased by 201.52 compared with the reference model. To minimize the variation of the head, the blade angle at the trailing edge and the shape of the meridional plane at the trailing edge were fixed. Therefore, the change in the meridional plane at the leading edge and incidence angle resulted in only a small amount of head variation. The total head for the reference and optimum model are 14.66 and 14.30 m, respectively. A comparison of the measured total head drop performance curves between the experimental data and simulated results is shown in Figure . The curves of the cavitation coefficient versus the total head drop have similar tendencies. The quantitative values differ, but the forms of the graphs are similar. The errors of the reliability verification for the reference and optimum models were approximately 0.25 and 0.36, respectively. Generally, numerical simulation over-predicts the performance. Likewise, in this study, the predicted suction performance was higher than the experimental result.
Table 4. Calculated results of design optimization.
Figure 12. Comparison of the measured head drop curves between the reference and optimum models.
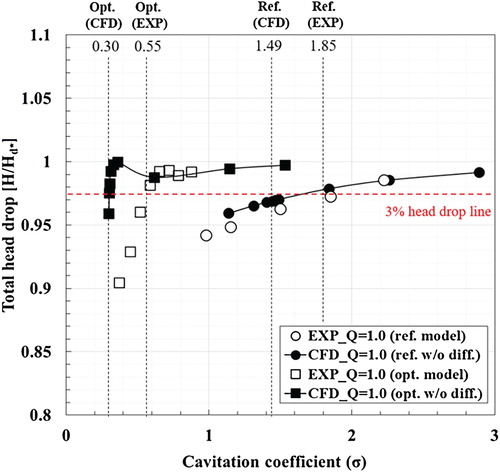
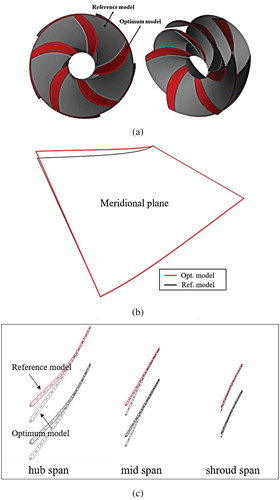
Figure (a) shows the comparison of three-dimensional geometrical parameters. The black color represents the reference model, and the red color represents the optimized model for the pump suction performance. Figure (b) shows a comparison of the meridional plane. Owing to the design variables of the meridional plane, the radius of the inlet at the shroud and the length in the axial direction from the inlet to the outlet parts of the shroud are increased. Figure (c) shows a comparison of the blade angles. Overall, the distributions of the beta (relative velocity) angle and theta (absolute velocity) angle are decreased because of the changed incidence angles.
Figure 13. Comparison of geometrical parameters (a) Comparison of three-dimensional shape (b) Comparison of meridional plane (c) Comparison of blade angles.
To compare the main factors affecting the improvement of the suction performance, qualitative and quantitative analyses under the cavitation-free and cavitation conditions were investigated, as shown in Figures –.
Figure 14. Pressure-coefficient distributions (a) Cavitation-free vs. cavitation coefficient () (b) Cavitation-free vs. cavitation coefficient (
).
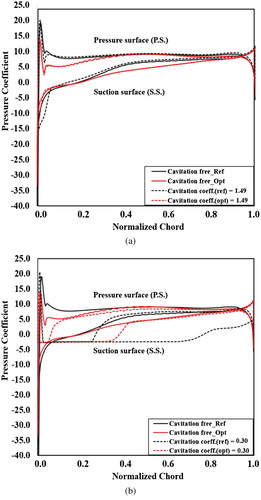
Figure plots the pressure-coefficient distributions on the blade surface along the normalized chord length at 90% span.
(12)
(12) Here, W1 represents the relative velocity at the impeller inlet.
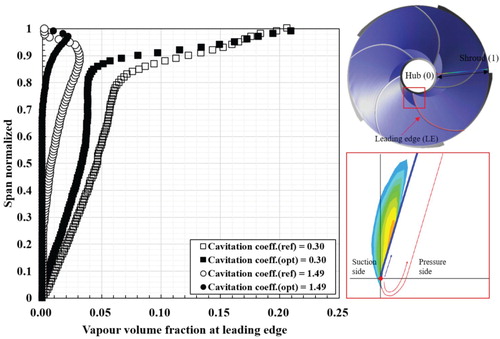
Figure 15. Comparison of the vapor volume fraction on hub to shroud line at leading edge.
The blade work was calculated using the distributions of the pressure coefficient. The water flowing through the leading edge was saturated with dissolved air, which corresponds to the inlet pressure. For the fluid flowed around the blade profile, the static pressure decreased to the minimum value.
Figure (a) compares the pressure-coefficient distribution of the cavitation-free condition with the 3% head drop point of the reference model (). Under the cavitation-free (full lines) condition, the pressure coefficient of the reference model on the suction side decreases sharply along the leading edge. The form of the pressure-coefficient distribution shows a positive incidence, and a stagnation point is observed on the pressure side. Meanwhile, in the optimum model, the lowest value among the pressure coefficients on the suction side increases and becomes much higher than the reference model. The form of the pressure-coefficient distribution still shows a positive incidence, but the peak and lowest points are changed owing to the re-designed cross-sectional area of the impeller inlet and the incidence angles at the hub and shroud. Under the cavitation coefficient (
), a minor cavitation phenomenon on the blade surface appeared in the reference and optimum models. The form of the distribution on the pressure and suction side changed slightly. The suction surface exhibited a thickened shape compared with the cavitation-free condition in the reference model. It is possible to predict the occurrence of cavitation. Figure (b) compares the pressure-coefficient distribution of the cavitation-free condition with the 3% head drop point of the optimum model (
). The steep pressure drop at the leading edge changes to a flat pressure distribution. The overall region of the pressure and suction surface represents the development of the cavitation phenomenon. The form of the flat pressure distribution in the reference model is remarkably observed along the normalized chord length. It is possible that the major part of the pressure and suction sides occurred the cavitation phenomenon. Otherwise, the half of the suction surface exhibited a flat shape in the optimum model. Furthermore, only the fore-region exhibits the cavitation phenomenon on the pressure surface.
In order to compare the amount of vapor volume quantitatively, Figure shows the vapor volume fraction from hub to the shroud at impeller leading edge. The span-wise length from the hub to shroud is normalized from 0 to 1. Under the 3% head drop point of the reference model (), a minor vapor volume along the span-wise direction gradually appeared in the reference model. The vapor volume fraction increased to over 0.03 and the highest vapor volume fraction was generated near 0.9 span. However, in the optimum model, the vapor volume fraction hardly occurred along the span-wise direction. Under the 3% head drop point of the optimum model (
), vapor volume fraction along the span-wise direction gradually increased up to 0.20 in the reference and optimum models. The forms of the vapor volume fraction show a similar generated tendency. The vapor increases gradually from 0 to 0.8 span, but increases sharply thereafter 0.8 span. Although the vapor volume fraction in the optimum model is lower than the reference model, it is still not sufficient to explain the cause of the improvement of the suction performance.
To examine the improved suction performance in more detail, the internal flow fields were visually analyzed, as shown in Figures and . Figure presents a comparison of the pressure distribution on the blade-to-blade plot near the shroud. Figure (a) presents an unfavorable pressure distribution in the flow path and the lowest pressure region at the leading edge in the reference model under the cavitation-free condition. This pressure distribution impaired the work transfer. The flow has been caused by an uneven approach flow due to the sharp around the impeller, the separated flow was dominant on the suction side. Owing to the large positive incidence angle on the surface other hand, in the case of the optimum model, these non-uniform flow components were suppressed, and the pressure distribution is relatively uniform. Figure (b) shows the intensity at the low pressure in the reference model. Similar to the aforementioned pressure-coefficient distributions, the location of the flat shape along the normalized chord matches the low-pressure region on the pressure and suction surfaces. A broad low-pressure region affects the negative influence of flow blockage on the hydraulic performance. In the optimum model, the reduced flow instability contributes to the improvement of the suction performance.
Figure presents the distributions of the vapor volume fraction on the blade-to-blade plot and within the impeller cross section near the shroud span under the NPSHre conditions. Depending on the geometrical parameters, different forms of cavitation would be developed. The bubbles were developed first in the shroud rather than in the hub. The cavitation zone started near the leading edge and extended to the observed cavity length. Attached cavities were observed on the suction surface, and their blockage accelerated the flow near the closure area. The growth of the cavities reduced the local pressure and the meridional component of the velocity and increased the flow incidence. Regarding the cavitation coefficient (), the reference model shows an irregular shape compared with the optimum model. The cavitation coefficient at the inlet pressure of the 3% head drop is significantly larger than that of the optimum model. The result for the reference model can be a critical problem for the operation. The different cavity lengths and vapor volumes affect the total efficiency and suction performance. According to the numerical simulation results, the total efficiencies for the reference model and optimum model are 87.17% and 89.46%, respectively. Efficiency drops of approximately 4.26% and 0.94% are observed in Figures (a,b), respectively. Thus, the total efficiencies for the reference model and optimum model are 78.48% and 86.38%, respectively. Efficiency drops of approximately 12.96% and 4.02% are observed in Figures (c,d), respectively.
Figure 16. Comparison of the pressure distribution on the blade-to-blade plot at 90% span (a) Cavitation-free (b) Cavitation coefficient ().
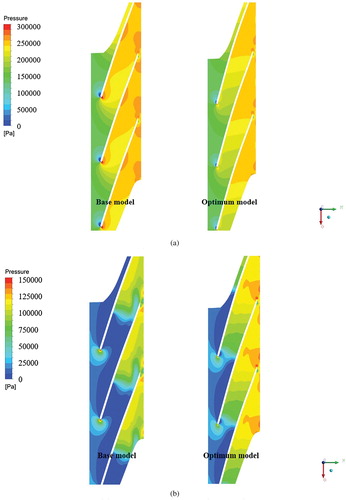
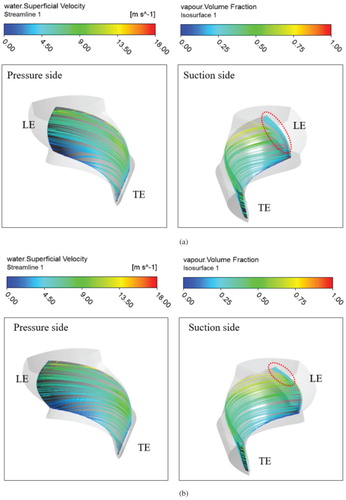
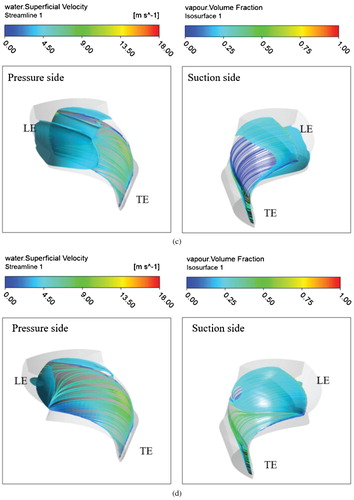
Figure shows the distributions of the streamline and iso-surface with vapor volume fraction of 0.2 on the blade surface. Figure (a) confirms that the vapor is generated in the same manner as the above-mentioned analysis results, and an unstable flow pattern is observed at the leading edge of the impeller on the suction side due to the vapor volume. In addition, it was represented that the streamline was not smooth near the hub on the pressure side. Figure (b) shows the reason why the hydraulic efficiency was kept within 1%. Although a small amount of vapor is generated at the shroud on the suction side, the streamline of water superficial velocity smoothly flows both the pressure and suction sides. Figure (c) presents that the vapor volume fraction generates from the front of the blade and occupies a significant portion of the internal passage. In the case of the suction side, the streamline does not flow steadily along the blade surface due to the influence of vapor production. This is the reason why the hydraulic efficiency drops drastically due to the flow blockage phenomenon. Figure (d) shows that the vapor volume fraction generates from the forepart of the impeller, and it accounted for half of the suction side. In the case of the pressure side, it was confirmed that the flow was relatively smooth. Compared to the reference model, the streamline flows smoothly after the area occupied by the vapor.
Figure 17. Distributions of the vapor volume fraction on the blade-to-blade plot and within the impeller cross section at 90% span (under NPSH3 conditions) (a) Reference model () (b) Optimum model (
) (c) Reference model (
) (d) Optimum model (
).
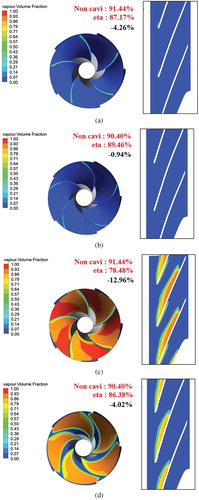
Figure 18. Distributions of the streamline and vapor volume fraction on the blade surface (under NPSH3 conditions) (a) Reference model () (b) Optimum model (
) (c) Reference model (
) (d) Optimum model (
).
6. Conclusion
This study aimed to provide a guideline for systematically maximizing hydraulic efficiency and suction specific speed for mixed-flow pump using a commercial CFD packages combined with CCD and RSA. The optimization results indicated that the suction specific speed values of the high-efficiency model and multi-objective optimum model were 88.13 and 289.65, respectively. Furthermore, the hydraulic efficiency was kept within 1% compared to the high-efficiency model as the constraint condition. The hydraulic efficiencies of the high-efficiency and multi-objective optimum model were 91.44% and 90.40%, respectively. After the optimization of the suction performance, the relationship between the design variable and the objective function was analyzed by using regression analysis. Increasing the cross-sectional area of the impeller at the inlet and the incidence angle influenced the hydraulic performance. Most effective design variable is the incidence angles at the shroud. To compare the main factors affecting the improvement of the suction performance, qualitative and quantitative analyses under the cavitation-free and cavitation conditions were investigated. The numerical results of the high-efficiency model and multi-objective optimum model have different cavitation structures and pressure-coefficient distributions. When the bubbles generated via the numerical analysis were examined, it was found that the multi-objective optimum model generated less bubbles than the high-efficiency model under the same inlet pressure condition. To validate the simulated results, the measured total head drop and total efficiency drop curves were compared with the experimental results. Generally, the tendencies of the performance curves were similar. The limitations of this study, the tip clearance, mechanical loss and diffuser are not taken into account and steady-state analyses are performed for a single-passage domain. In order to improve the reliability of the analysis, an unsteady-state analysis need to conduct considering the experimental conditions under the operating ranges. In a future work, numerical optimization on various specific speed will be performed. Based on the studies, the design variable with high-performance trends will be obtained by multi-objective optimizations. Ultimately, the mixed-flow pump can be designed with high efficiency and suction performance in any design specification.
Nomenclature
| CFD | = | Computational fluid dynamics |
| Cp | = | Pressure coefficient |
| Cm2 | = | Mean axial velocity (m/s) |
| g | = | Acceleration of gravity (m/s2) |
| H | = | Total head (m) |
| Hd* | = | Total head rise under the cavitation-free condition (Q = Qd) |
| NPSH | = | Net positive suction head (m) |
| NPSHre | = | Net positive suction head required (m) |
| Nss | = | Suction specific speed |
| Pinlet | = | Inlet total pressure (Pa) |
| Pvapor | = | Saturated vapor pressure (Pa) |
| ΔPt | = | Total pressure rise (Pa) |
| Q | = | Volumetric flow rate (m3/min) |
| Qd | = | Volumetric flow rate at design point (m3/min) |
| RMS | = | Root mean square |
| SST | = | Shear-stress transport |
| T | = | Blade torque (Nm) |
| u1 | = | Peripheral speed at the impeller inlet (m/s) |
| W1 | = | Relative velocity at the impeller inlet (m/s) |
| η | = | Total efficiency |
| ηd* | = | Total efficiency under the cavitation-free condition |
| ρ | = | Density (kg/m3) |
| σ | = | Cavitation coefficient |
| ω | = | Angular velocity [rad/s] |
Disclosure statement
No potential conflict of interest was reported by the authors.
Additional information
Funding
References
- ANSI/HI 1.6. (2000). American national standard for centrifugal pump tests. Parsippany, NJ, USA: Hydraulic Institute.
- ANSYS. (2018). CFX-19.1, boundary conditions: Interface, User Manual. Canonsburg, PA: ANSYS Inc.
- Bachert, R., Stoffel, B., & Dular, M. (2010). Unsteady cavitation at the tongue of the volute of a centrifugal pump. Journal of Fluids Engineering, 132(6), 061301. doi: 10.1115/1.4001570
- Brennen, C. E. (2011). Hydrodynamics of pumps. New York: Cambridge University Press.
- Choi, Y., Lee, Y. G., Lee, K. Y., Kim, J. H., Kim, S., Yang, H. M., & Choi, Y. S. (2016). Efficient prediction approach of net positive suction head required (NPSHre) for Mixed-flow Pump, 2nd International symposium of cavitation and multiphase flow (ISCM 2016), October 22–25, Jiangsu University, Zhenjiang, China, ISCM-051.
- Ding, H., Visser, F. C., Jiang, Y., & Furmanczyk, M. (2011). Demonstration and validation of a 3D CFD simulation tool predicting pump performance and cavitation for industrial applications. Journal of Fluids Engineering, 133(1), 011101. doi: 10.1115/1.4003196
- Dixon, S. L., & Hall, C. (2013). Fluid mechanics and thermodynamics of turbomachinery. Burlington: Butterworth-Heinemann: Elsevier.
- Ezhilsabareesh, K., Rhee, S. H., & Samad, A. (2017). Shape optimization of a bidirectional impulse turbine via surrogate models. Engineering Applications of Computational Fluid Mechanics. Advanced Online Publication, doi: 10.1080/19942060.2017.1330709
- Fu, Y., Yuan, J., Yuan, S., Pace, G., d’Agostino, L., Huang, P., & Li, X. (2015). Numerical and experimental analysis of flow phenomena in a centrifugal pump operating under low flow rates. Journal of Fluids Engineering, 137(1), 011102. doi: 10.1115/1.4027142
- Gao, T., Wang, Y., Pang, Y., & Cao, J. (2016). Hull shape optimization for autonomous underwater vehicles using CFD. Engineering Applications of Computational Fluid Mechanics, 10(1), 599–607. doi: 10.1080/19942060.2016.1224735
- Guinta, A. A. (1997). Aircraft Multidisciplinary design optimization using design of experimental Theory and response surface Modeling methods (Ph.D. Thesis). Blacksburg, VA, USA: Virginia Polytechnic Institute and State University.
- Gülich, J. F. (2010). Centrifugal pumps (2nd ed.). Berlin: Springer-Verlag Berlin Heidelberg. 4(1) 328–336.
- Hellsten, A., & Laine, S. (1997). Extension of the k-ω-SST turbulence models for flows over rough surfaces, 22nd Atmospheric flight mechanics conference. https://doi.org/10.2514/6.1997-3577.
- Hick, C. R., & Turner, K. V. (1999). Fundamental Concepts in the design of experiments (pp. 239–267), (5th ed.). New York: Oxford University Press.
- Imaichi, K., Murakami, Y., Tsurusaki, H., & Cho, K. R. (2002). The basis of pump design (pp. 307–375). Seoul: Daeyoung Sa.
- ISO 5198. (1987). International organization for standardization for centrifugal, mixed-flow and axial pump tests-code for hydraulic performance tests-precision class.
- ISO 60193. (1999). International electro technical commission, hydraulic turbines, storage pumps and pump-turbines – model acceptance tests.
- Jeong, H. S., & Kim, K. Y. (2018). Shape optimization of a feedback-channel fluidic oscillator. Engineering Applications of Computational Fluid Mechanics, 12(1), 169–181. doi: 10.1080/19942060.2017.1379441
- Karassik, I. J., Messina, J. P., Cooper, P., & Heald, C. C. (2001). Pump Handbook. New York: McGraw-Hill.
- Korea Ministry of Trade, Industry and energy, development of design program for centrifugal and mixed-flow pump (3rd year report), Report No. 10044860, (2016).
- Lee, Y. G., Yuk, J. H., & Kang, M. H. (2017). Flow analysis of fluid machinery using CFX pressure-based coupled and various turbulence model. The KSFM Journal of Fluid Machinery, 7(5), 82–90. doi: 10.5293/KFMA.2004.7.5.082
- Leroux, J. B., Astolfi, J. A., & Billard, J. Y. (2004). An experimental study of unsteady partial cavitation. Journal of Fluids Engineering, 12(1), 94–101. doi: 10.1115/1.1627835
- Limbach, P., & Skoda, R. (2017). Numerical and experimental analysis of cavitating flow in a Low specific speed centrifugal pump with different surface Roughness. Journal of Fluids Engineering, 139(10), 101201. doi: 10.1115/1.4036673
- Liu, H., Wang, K., Yuan, S., Tan, M., Wang, Y., & Dong, L. (2013). Multicondition optimization and experimental measurements of a double-blade centrifugal pump impeller. Journal of Fluids Engineering, 135(1), 011103. doi: 10.1115/1.4023077
- Luo, X., Wei, W., Ji, B., Pan, Z., Zhou, W., & Xu, H. (2013). Comparison of cavitation prediction for a centrifugal pump with or without volute casing. Journal of Mechanical Science and Technology, 27(6), 1643–1648. doi: 10.1007/s12206-013-0411-5
- Menter, F. R., Galpin, P. F., Esch, T., Kuntz, M., & Berner, C. (2004). CFD simulations of aerodynamic flows with a pressure-based method, 24th International congress of the aeronautical sciences, Yokohama, Japan.
- MINITAB. (2003). Statistical software 17 for Windows. Pennsylvania: State College.
- Montgomery, D. C., Runger, G. C., & Hubele, N. F. (2009). Engineering statistics. New York: John Wiley & Sons.
- Myers, R. H., & Montgomery, D. C. (2002). Response surface methodology: Process and process and Product optimization using designed experiments, (2nd ed). (pp. 85–143), USA: A Wiley-Interscience Publication.
- Stepanoff, J. (1957). Centrifugal and axial flow pumps. New York: John Wiley & Sons.
- Suh, J. W., Kim, J. H., Choi, Y. S., Joo, W. G., & Lee, K. Y. (2017). A study on numerical optimization and performance verification of multiphase pump for offshore plant. Proceedings of the Institution of Mechanical Engineers, Part A: Journal of Power and Energy, 231(5), 382–397.
- Suh, J. W., Kim, J. W., Choi, Y. S., Kim, J. H., Joo, W. G., & Lee, K. Y. (2018). Development of numerical Eulerian-Eulerian models for simulating multiphase pumps. Journal of Petroleum Science and Engineering, 162, 588–601. doi: 10.1016/j.petrol.2017.10.073
- Tan, L., Zhu, B., Cao, S., Wang, Y., & Wang, B. (2014). Influence of prewhirl regulation by inlet guide vanes on cavitation performance of a centrifugal pump. Energies, 7(2), 1050–1065. doi: 10.3390/en7021050
- Tani, N., Yamanishi, N., & Tsujimoto, Y. (2012). Influence of flow coefficient and flow structure on rotational cavitation in inducer. Journal of Fluids Engineering, 134(2), 021302. doi: 10.1115/1.4005903
- Tao, R., Xiao, R., & Wang, Z. (2018). Influence of blade leading-edge shape on cavitation in a centrifugal pump impeller. Energies, 11(10), 2588. doi: 10.3390/en11102588
- Visser, F. C., Dijkers, R. J. H., de Woerd, O., & H, J. G. (2000). Numerical flow-field analysis and design optimization of a high-energy first-stage centrifugal pump impeller. Computing and Visualization in Science, 3(1-2), 103–108. doi: 10.1007/s007910050057
- Zhang, F., Yuan, S., Fu, Q., Pei, J., Böhle, M., & Jiang, X. (2017). Cavitation-induced unsteady flow characteristics in the first stage of a centrifugal charging pump. Journal of Fluids Engineering, 139(1), 011303. doi: 10.1115/1.4034362
- Zhu, D., Tao, R., & Xiao, R. (2019). Anti-Cavitation design of the Symmetric leading-edge shape of mixed-flow pump impeller blades. Symmetry, 11(1), 46. doi: 10.3390/sym11010046