
 ?Mathematical formulae have been encoded as MathML and are displayed in this HTML version using MathJax in order to improve their display. Uncheck the box to turn MathJax off. This feature requires Javascript. Click on a formula to zoom.
Abstract
Sustaining flameless combustion under elevated pressure conditions remains a challenge that hinders its application in gas turbines. Previous attempts succeeded to sustain flameless operation up to 5 atm. In the present work, reaction rate is decreased by increasing heat transfer through combustor walls so that the reaction zone is kept distributed. Pressure is elevated from 1 to 15 atm. and its effect on reaction zone location and spread, and emissions is investigated. Two-dimensional computations are performed using ANSYS fluent package. Under adiabatic combustor wall conditions, increasing the pressure results in a more concentrated reaction zone, and a departure from flameless mode at 3 atm. The calculated Damköhler number is noticed to increase from 0.2 to 1.9. NOx emissions increases from 10 to 78 ppm. Nearly 90 % of the predicted NOx are generated via the thermal route. Under isothermal combustor wall conditions, increased heat transfer is noticed to limit the increase in heat of reaction and temperature with pressure. The calculated Damköhler number is noticed to increase from 0.12 to 0.85. This is nearly half the values encountered under adiabatic conditions, which demonstrate a distributed reaction under all pressures investigated. Finally, NOx emissions are found below 5 ppm for all pressures investigated.
1. Introduction
Flameless or MILD combustion is a recent combustion technology that is based on mixing a considerable amount of recirculated product gases with fresh reactants before combustion takes place (Khidr, Eldrainy, & El-Kassaby, Citation2017; Wünning & Wünning, Citation1997; Zhang, Mi, Li, Wang, & Dally, Citation2015). To sustain combustion at these vitiated conditions, combustion air is preheated either before entering the combustor or through mixing with hot product gases inside the combustor. The resulted distributed reaction zone has led to many advantages for this type of combustion. The axial temperature profile appears to be more flat with no temperature peaks or hot spots. This in turn has led to single digit emission levels, low noise and high combustion stability (Cavaliere & de Joannon, Citation2004; Tsuji et al., Citation2002). Motivated by these features and the success of flameless combustion application in industrial furnace systems, research efforts have been conducted to extend its application to gas turbines (Flamme, Citation2004, Citation2005; Nemitallah, Rashwan, Mansir, Abdelhafez, & Habib, Citation2018; Perpignan, Talboom, Levy, & Rao, Citation2018). However, gas turbine combustors are intrinsically different from industrial furnaces as they operate under high-pressure levels typically in the range of 5–50 bars. It is well understood that increasing pressure leads to a subsequent reduction of the laminar flame speed as it slows down species molecular diffusion (Goswami et al., Citation2013; Zahedi & Yousefi, Citation2014). However, it also induces smaller turbulent scales, which in turn results in higher flame front wrinkling. A subsequent increase in the flame surface area is resulted which offsets the reduction in the laminar flame speed (Cohé, Halter, Chauveau, Gökalp, & Gülder, Citation2007). Consequently, pressure has a minimal effect on the turbulent flame speed of methane-air mixtures at least theoretically (Griebel, Siewert, & Jansohn, Citation2007). However, increasing the pressure is noticed to cause abortion from flameless combustion as previously reported in several works (Khalil & Gupta, Citation2015; Kruse, Kerschgens, Berger, Varea, & Pitsch, Citation2015; Lammel et al., Citation2010; Lückerath, Meier, & Aigner, Citation2008; Zornek, Monz, & Aigner, Citation2015). Increasing pressure, while maintaining constant inlet mass flowrate, reduces the reaction zone size due to the reduction in flow velocity (Khalil & Gupta, Citation2015). Consequently, heat release becomes more concentrated with pressure leading to a higher and more localized temperature zone. Due to the elevated temperature, the production of high carbonaceous compounds are promoted leading to an increased flame luminosity (De Joannon, Saponaro, & Cavaliere, Citation2000). Limited number of studies were reported to address this problem of pressure according to authors’ knowledge (Khalil & Gupta, Citation2015; Lückerath et al., Citation2008). In these studies, focus is given to enlarge the reaction zone size, despite the elevated pressures, through reducing the reaction rate or increasing reactants flow velocity. Reducing the reaction rate is achieved by increasing the amount of recirculated exhaust gases (Shareh, Silcox, & Eddings, Citation2018), while increasing reactants flow velocity is achieved by increasing the inlet momentum (Khalil, Eldrainy, Saqr, & Abdelghaffar, Citation2018). Previous approaches only succeeded to sustain flameless operation under slightly elevated pressures (up to 5 atm.). The primary reason for this limited pressure range is believed to be the significant effect of pressure on mixing between incoming reactants and recirculated products inside the combustor. In the present work, authors propose a different approach to sustain flameless operation under more elevated pressure conditions (above 5 atm.). This approach is based on decreasing the reaction rate by increasing heat transfer through combustor walls to keep the reaction zone distributed under more elevated pressure levels. It is believed that this approach could be able to extend flameless operation pressure limit beyond 5 atm. as it is independent from mixing. Therefore, the objective of this paper is to investigate the combined effect of pressure and increased heat transfer on flameless combustion. Computational fluid dynamics, CFD, is being employed in the current investigation and validation with experimental data is provided whenever possible. Recently, CFD has become a very powerful tool in tackling various engineering challenges (Akbarian et al., Citation2018; Faizollahzadeh Ardabili et al., Citation2018; Ghalandari, Mirzadeh Koohshahi, Mohamadian, Shamshirband, & Chau, Citation2019; Mou, He, Zhao, & Chau, Citation2017; Ramezanizadeh, Alhuyi Nazari, Ahmadi, & Chau, Citation2019).
2. Numerical setup
In this section, the geometry used for the present analysis is first presented. The details of the turbulence and combustion models along with the discretization theme and the solver type are then followed. After that, the generated mesh and imposed boundary conditions are then demonstrated. Finally, geometrical and operational aspects of the investigated cases are summarized.
2.1. Combustor geometry and computational domain
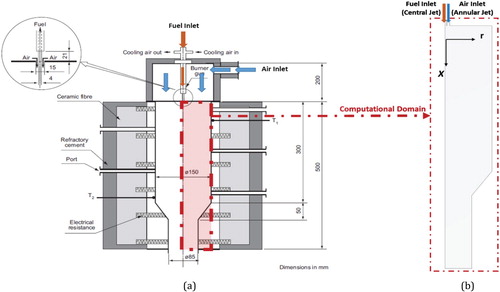
Figure (a) shows the geometry of the combustor employed in the present study. The combustor was originally constructed and employed by Rebola, Coelho, and Costa (Citation2013; Rebola, Costa, & Coelho, Citation2013). Fresh reactants are introduced inside the combustor through one central fuel jet of 4 mm diameter, surrounded by a central air jet of 15 mm diameter in a concentric configuration. It is placed at the top of a cylindrical quartz combustion chamber, which has an inner diameter of 150 mm and a length of 300 mm. Combustor walls are preheated to 1173 K using an electric heating system. The combustor ends at the bottom with a 35° slopped nozzle of 50 mm length. Methane is employed as a fuel. All details about the experimental setup can be found in (Rebola, Costa, et al., Citation2013). As the combustor is axisymmetric, only a 2D axisymmetric section is employed for the present numerical work to save the computational time (Figure (b)).
Figure 1. (a) Details of combustor and inlet section geometry, (b) 2D combustor domain employed for present computations (Rebola, Costa, et al., Citation2013).
2.2. Numerical model
The following steady state Reynolds averaged Navier-Stokes set of equations (RANS), are used in the present computations (short notation used) (Fluent, Citation2016):
(1)
(1)
(2)
(2) Where
is the density of the fluid,
is the time,
is the mean component of velocity in the direction
,
is the pressure,
is the dynamic viscosity, and
is a fluctuating component of velocity. Repeated indices indicate summation from one to two. Due to averaging, additional six terms
appear which represent the contribution of turbulence to the mean flow. They are considered additional stresses resulted due to turbulence and named after Reynolds as ‘Reynolds turbulent stresses’.
Turbulence is modeled using the realizable – epsilon model (RKE) of Shih, Liou, Shabbir, Yang, and Zhu (Citation1995). The transport equations for both
and
are shown below (short notation form):
(3)
(3)
(4)
(4) Where
In these equations,
represents the generation of turbulence kinetic energy due to the mean velocity gradients.
is the generation of turbulence kinetic energy due to buoyancy.
represents the contribution of the fluctuating dilatation in compressible flows in the overall dissipation rate.
and
are constants.
and
are the turbulent Prandtl numbers for
and
respectively.
and
are any other defined source terms.
RKE demonstrates higher performance compared with other two equation models in strained and swirling flows (Khalil, Saqr, Eldrainy, & Abdelghaffar, Citation2018). In addition, it is the standard turbulence model often used in most of flameless combustion past numerical studies (Duwig, Stankovic, Fuchs, Li, & Gutmark, Citation2007; Hosseini, Bagheri, & Wahid, Citation2014; Khidr et al., Citation2017; Rebola, Coelho, et al., Citation2013). This is mainly because of its demonstrated accurate predictions of flameless combustion characteristics under various conditions (Rebola, Coelho, et al., Citation2013).
The modeled energy equation is as follows:
(5)
(5) Where E is the total energy,
is the effective thermal conductivity, and
is the effective stress tensor (in case of viscous heating which is not included in the present case). The effective thermal conductivity is modeled from:
(6)
(6) where
, in this case, is the thermal conductivity.
Near wall flow parameters are estimated using standard wall function with a coarse near wall grid; y+ = 40–60.
The non-flamelet eddy dissipation concept (EDC) of Magnussen (Citation1989) is used for combustion modeling. The eddy-dissipation-concept (EDC) model is an extension of the eddy-dissipation model to include detailed chemical mechanisms in turbulent flows. It assumes that reaction occurs in small turbulent structures, called the fine scales. The length fraction of the fine scales is modeled as Fluent (Citation2016):
(7)
(7) where
denotes fine-scale quantities and
= volume fraction constant = 2.1377
= kinematic viscosity
The volume fraction of the fine scales is calculated as .
Species are assumed to react in the fine structures over a time scale (Fluent, Citation2016):
(8)
(8) where
is a time scale constant equal to 0.4082.
The source term in the conservation equation for the mean species , is modeled as (Fluent, Citation2016):
(9)
(9) EDC is believed to be able to deal with both slow and fast chemistry regions that can coexist in flameless combustors (Locci, Citation2015). Moreover, it can deal with a wide range of both high and low Damköhler numbers (Hosseini et al., Citation2014; Hosseini & Abdul Wahid, Citation2015). For these reasons, it has been the standard combustion model often used for flameless combustion studies (Duwig et al., Citation2007; Hosseini et al., Citation2014; Khidr et al., Citation2017; Rebola, Coelho, et al., Citation2013).
A reduced version of GRI-MECH 1.2 with 22 species and 104 reactions (DRM-22) is used for chemical kinetics (Kazakov & Frenklach, Citation1994). However, this kinetic mechanism is further refined in the present work to improve CO predictions as will be explained in the validation section. The in-situ adaptive tabulation method (ISAT) is used to reduce the computational cost of the detailed chemistry calculations (Pope, Citation1997). Radiation heat transfer is taken into account using the Discrete Ordinates (DO) radiation model theory (Raithby & Chui, Citation1990). The weighted-sum-of-grey gases (WSGG) model is used to estimate all mixture radiative properties based on local mass fractions and temperatures inside the domain. The finite volume approach with the second order upwind scheme is employed for the spatial discretization of pressure, momentum and species transport equations. Pressure based solver is employed along with the Pressure Implicit with Splitting of Operator (PISO) algorithm for the solution of the pressure corrected continuity equation. A desktop computer with an Intel core I7 processor, and 16 GB RAM is employed for all computations along with ANSYS-Fluent 17 commercial package.
Regarding boundary conditions, inlet mass flow is applied at combustor inlets. Pressure outlet is applied at the combustor exit. No-slip condition with either zero heat flux or isothermal boundary is applied at combustor walls according to the investigated case. Finally, axis condition is applied at the combustor centerline.
It should be noted that a critical parameter in flameless combustion which will be used throughout the present work is the recirculation ratio, K. It is defined as the ratio between the mass of the recirculated product gases to the inlet mass of reactants. As we move axially along the combustor center line, this parameter is zero at the inlet, and starts to increase due to the added recirculated mass to the main inlet stream mass. After reaching its maximum, it then starts to decrease due to the detached mass from the inlet stream mass until it becomes zero again at the combustor exit. The recirculated mass is being determined by subtracting (in a separate excel sheet) the inlet mass from the total mass passing through a certain combustor radial section. The inlet air mass flowrate is given from the experimental conditions of Rebola et al. (Rebola, Coelho, et al., Citation2013; Rebola, Costa, et al., Citation2013). The total mass passing through a certain combustor section is computed numerically at each combustor section. Therefore, inlet recirculation ratio is not defined as a boundary condition and it has a zero value.
2.3. Grid independent test
Figure shows the mesh generated for the present computational domain. As mentioned before, a 2D axisymmetric section is used for our numerical computations due to geometric symmetry. Three grid resolutions were tested for a grid independence solution; a coarse grid of 56700 cells, a moderate grid of 130000 cells, and a fine grid of 300000 Cells. All grids are refined where high turbulence, mixing, and high temperature gradient are expected. The operating case used for the study was reported in [53, 54] and is presented in Table under constant wall temperature of 1173 K. Figure demonstrates both predicted the axial velocity and mean temperature profiles along the combustor centerline for the three grids employed. Other parameters were also tested but not shown for brevity. Predicted axial profiles of velocity, temperature, and CH4, CO2, O2, and CO mole fractions (not included), were almost identical for the three grids. Maximum discretization error is 3.76% and is recorded for the temperature predictions between the first two grids. Finally, Table demonstrates the grid densities and combustion parameters peak values for different grid resolutions employed. It can be concluded that the coarse grid (56700 cells) can be used for the present analysis.
Figure 2. The mesh generation of (a) the computational domain, and (b) the zoomed near burner region.
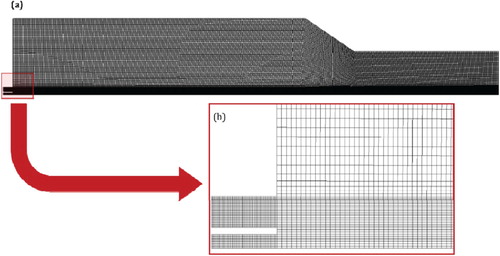
Figure 3. Predicted axial velocity and mean temperature profiles at combustor centerline for the three different grid resolutions.
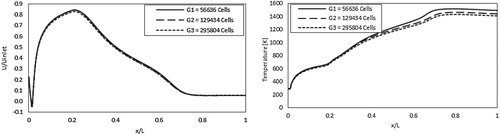
Table 1. Grid densities and combustion parameters peak values for different grid resolutions.
2.4. Solution convergence
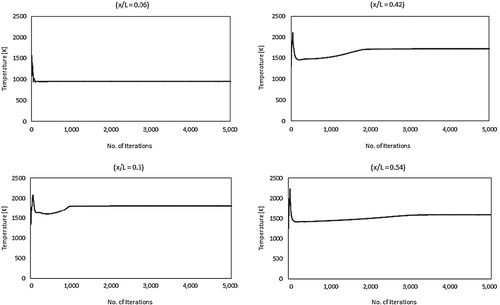
A converged solution is reached when all computational residuals become less than 10−6. Moreover, to increase confidence in the solution adopted, velocity and temperature are monitored at several points inside the domain. The solution is considered to be converged when they reach steady state values. Figure shows the development of the static temperature profile with number of iterations at four different axial locations (x/L = 0.06, 0.3, 0.42, and 0.54). These axial locations are all located at the combustor centerline (y = 0). It can be noted from the figure that temperature profiles reach a steady state solution with number of iterations less than 5000 at all locations. Velocity profiles show a similar behavior, however, they were not included due to limited space.
Figure 4. Development of mean temperature profiles with number of iterations at various combustor axial locations, y = 0, x/L = 0.06, 0.3, 0.42, and 0.54.
2.5. Investigated cases
In the present paper, the combustor operating pressure is increased incrementally from atmospheric to 15 atm. to cover the typical operating range of gas turbine combustors. Equivalence ratio is maintained constant at 0.5 to match the experimental conditions of Rebola et al. (Rebola, Coelho, et al., Citation2013; Rebola, Costa, et al., Citation2013). The effect of increasing the pressure on flameless combustion characteristics is investigated under two conditions of combustor walls. First, it is investigated under adiabatic wall condition where no heat transfer across the walls is included (referred to as ‘the adiabatic case’). Then, it is investigated under constant wall temperature of 1173 K where wall heat transfer is included (referred to as ‘the isothermal case’). Table lists the geometrical aspects and operating conditions for both cases.
Table 2. Geometrical parameters and operating conditions for investigated cases.
3. Results and discussion
In this section, validation of the numerical model is first conducted to gain confidence in the results obtained. The isothermal case under atmospheric pressure conditions is used for the validation. Predicted results are compared with the experimental measurements of Rebola, Costa, et al. (Citation2013). Following the validation, the effect of pressure on mixing and recirculation, reaction zone location and spread, combustion global features, and emissions is investigated under adiabatic wall conditions. Finally, the combined effect of pressure and heat transfer on the previous parameters is studied.
3.1. Validation of the numerical model
The performance of the DRM22 reduced mechanism is first assessed and is briefed in the following lines. The mean temperature, O2, and CO2 predictions are found to agree well with the experimental data while CO is considerably over predicted. Primary CO production and consumption reactions in flameless combustion were identified in the work of Liu et al. (Citation2017). Accordingly, four main reactions are selected for the tuning of their kinetic parameters. Following the approach of Tu, Yang, and Liu (Citation2017), the reaction rate constant, k, can be tuned only through modifying the pre-exponential factor, A, which reflects the number of collisions from the correct orientation. Consequently, as CO is over predicted, the pre-exponential factor is increased by order of magnitude for consumption reactions and decreased by order of magnitude for production reactions. The effect of each individual reaction modification on CO predictions is then studied. Table summarizes the reactions selected with their original and modified pre-exponential factors.
Table 3. CO primary reactions in flameless combustion with their original and modified pre-exponential factors.
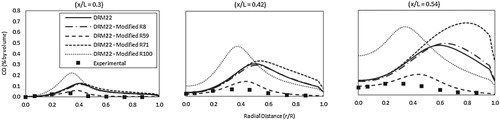
Figure shows the predicted CO radial profiles at three different axial combustor locations (x/L = 0.3, 0.42 and 0.54) for the different DRM22 modification scenarios. Only the modification of R59 is noticed to improve the CO predictions. Increasing the pre-exponential factor of R59 by order of magnitude results in an increase of the CO consumption rate to a value that closely matches the actual case. Moreover, this improvement is noticed to be consistent at different combustor axial locations. Modifying other reactions does not lead to any predictions improvement. This can be attributed to the different role played by these reactions (production or consumption) at different combustor regions. Consequently, the DRM22 mechanism with modified R59 will be used for the present analysis. It should be noted that the present validation is conducted only under atmospheric pressure conditions. Experimental data under elevated pressure conditions are not available. However, the DRM22 mechanism is already validated in (Kazakov & Frenklach, Citation1994) under elevated pressure conditions for both ignition delay time and laminar flame speed. The tested pressure range is (0.1–10 atm.) while the tested equivalence ratio range is (0.2–2). Deviations from GRI-MECH 1.2 are below 2% for most cases.
Figure 5. Predicted radial profiles of CO concentrations for the different DRM22 modification scenarios, measurements are taken from Rebola, Costa, et al. (Citation2013).
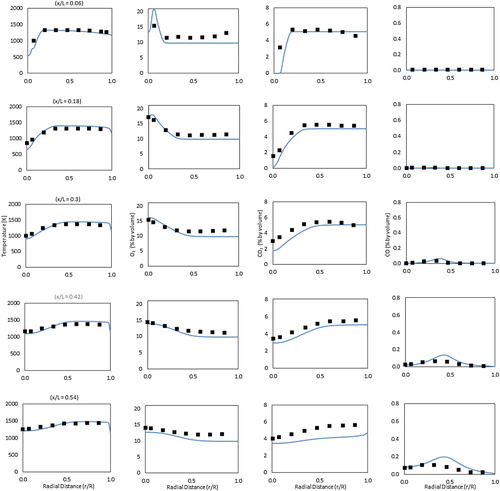
It Figure demonstrates the predicted and experimental radial profiles of mean temperature and O2, CO2 and CO concentrations at five combustor axial locations (x/L = 0.06, 0.18, 0.3, 0.42, 0.54) using the present numerical theme with the modified DRM22 mechanism. Generally, the numerical predictions are in fairly good agreement with the experimental measurements despite some discrepancies between the CO predictions and the experiments. These discrepancies in CO predictions are still noted despite the previous tuning of the reduced chemical reaction mechanism. The main reason for this might be the limited ability of the current chemical reaction mechanism to predict all CO consumption and production routes in flameless combustion. It is noteworthy to say that the DRM22 reduced mechanism is derived from the GRI-MECH 1.2 which was primarily developed for conventional combustion. Thus, it is important to consider the future development of new mechanisms for this purpose. In general, the present numerical model is able to regenerate the main flameless combustion characteristics of the present isothermal case with accepted accuracy. Temperature profiles are noticed to be nearly uniform except for the near burner region where mixing takes place. In this region, the development from a steep temperature increase at x/L = 0.06 to more gradual temperature increase at x/L = 0.18 is attributed to the effect of the central jet expansion. Temperature in the product gases region downstream the combustor is noticed to be slightly higher than the temperature in the recirculation zone upstream the combustor. This is apparently because of the heat transfer across the combustor walls which cools down the recirculated product gases before they are mixed with the incoming reactants. Overall, maximum temperature does not exceed 1480 K anywhere in the combustor. This moderate temperature increase along with the nearly uniform temperature profiles, can be attributed to the distributed reaction zone typical of the flameless operation. O2 and CO2 show complementary profiles while the latter appear to qualitatively follow the temperature trends. Maximum CO mole fraction is found below 0.3% which reflects the low emissions operation of the present combustor.
Figure 6. Predicted (Line) and experimental (Symbol) radial profiles of mean temperature and O2, CO2 and CO concentrations for the atmospheric isothermal case, experimental measurements are taken from Rebola, Coelho, et al. (Citation2013); Rebola, Costa, et al. (Citation2013).
The ability of the present numerical model to capture the main differences between the flameless and conventional modes of combustion was assessed (not included in the present paper for brevity). This assessment was performed through studying the effect of increasing the air jet diameter, da, from 15 to 30 mm. Increasing da to twice its value was noticed to cause abortion from the flameless mode due to the considerable reduction in the recirculation ratio, . Recirculation ratio is defined as the ratio between the recirculated product gases mass flowrate, mrec, and the inlet fresh reactants mass flowrate, (
) [1]. The model successfully generated the global combustion characteristics for both modes.
3.2. Effect of pressure – the adiabatic case
The effect of pressure on the characteristics of the mean flow field is first investigated. Increasing the pressure inside the combustor results in a proportional decrease in reactants density. Since the air and fuel inlet mass flowrates are kept constant, the increased density will lead to a subsequent decrease in both air and fuel inlet velocities. To further demonstrate the effect of pressure on flow turbulence and mixing, predicted contours of turbulent intensity at combustor symmetry plane are shown in Figure . Relatively high turbulence intensity is noticed to occupy most of the combustor volume under atmospheric pressure conditions. It reaches its peak at the shear layer between the inlet high velocity air jet and the surrounding medium. However, increasing the pressure suppresses the turbulence inside the combustor as noticed from Figure . This reduced turbulence intensity with increasing pressure can be attributed to the decreased inlet velocity. Figure shows the variation of the recirculation ratio with pressure. Despite the considerable effect of pressure on turbulence intensity, increasing the pressure results in a slight decrease in recirculation ratio. This slight decrease of recirculation ratio with increasing the pressure can be explained using the following relation (Han & Mungal, Citation2001):
(10)
(10) Increasing the pressure results in a similar increase in both air and recirculated exhaust gas densities, hence, it has minimal effect on the ratio
. However, the slight increase in combustion products temperature with increasing the pressure (as will be shown) results in a slight decrease in the recirculated exhaust gases density,
. Decreasing
results in an increase of the term
, however, it will be a slight increase due to the term’s power. Consequently, the recirculation ratio will be slightly decreased as noted in Figure . This slight decrease in recirculation ratio with pressure can be attributed to both the slight and hardly noticed increase in recirculated gases temperature and the square power of the term
. Despite the slight effect of pressure on recirculation ratio, its substantial effect on turbulence intensity is expected to affect the reaction zone characterisitics, hence, the flameless combustion.
Figure 7. Predicted contours of turbulence intensity for the adiabatic case at different pressures.
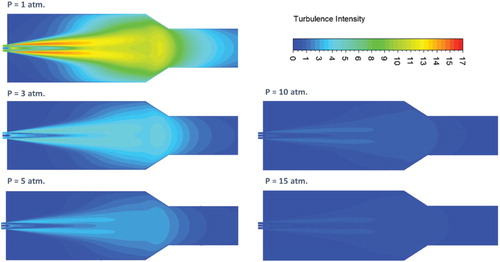
Figure 8. Variation of the computed recirculation ratio with pressure at the adiabatic case.
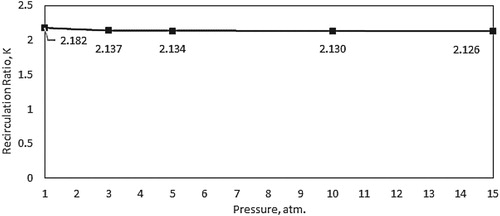
Figure shows the effect of pressure on the predicted contours of OH mole fraction at the combustor symmetry plane. OH radicals are widely known for its high reactivity, hence, short living. Consequently, visualization of OH radicals is a frequent approach that is used to study the reaction zone structure. Under atmospheric pressure conditions, Figure shows a widely distributed reaction zone with relatively high OH intensity. Although it occupies most of the combustor volume, its highest intensity is at the middle of the combustor (x/L = 0.44) close to the combustor centerline. This is the location where fuel and air are believed to be mixed with considerable amount of recirculated exhaust gases and preheated enough for the combustion to be initiated. The resulting distributed reaction zone structure appears to comply well with the high turbulence intensity noticed under the same conditions. It also represents one of the flameless combustion mode intrinsic characteristics. Under elevated pressures, reaction zone becomes more concentrated specifically at the combustor centerline. Reaction zone size is determined by both laminar flame speed and flow velocity. Increasing the pressure is found to reduce the laminar flame speed and subsequently the reaction rate as will be demonstrated at the last section of this paper. Consequently, the noticed reduction of the reaction zone size can be attributed to the decrease in laminar flame speed (reaction rate), flow velocity and turbulence intensity. OH intensity is also noticed to decrease with the increase in pressure. This decrease in OH intensity can be attributed to the recombination of OH radicals to form O2H2 compounds under elevated pressure conditions (Kazakov & Frenklach, Citation1994).
Figure 9. Predicted contours of OH mole fraction for the adiabatic case at different pressures.
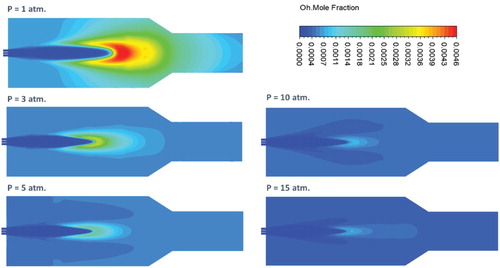
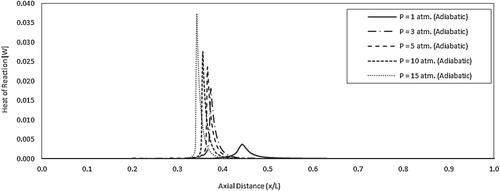
Figure shows the effect of pressure on the predicted contours of mean temperature at the combustor symmetry plane. Under atmospheric pressure conditions, a gradual increase of temperature is noticed along the combustor center line. This gradual increase in temperature can be attributed to the widely distributed reaction zone previously noticed under the same conditions. No temperature peaks or definite flame front are apparent which further confirms the flameless mode of operation under these conditions. Increasing the pressure results in the appearance of a relatively high temperature zone at the middle of the combustor (x/L = 0.4). This high temperature zone can be attributed to the more concentrated reaction zone previously noticed in Figure under elevated pressures. It can be explained as follows: the reaction zone becomes more concentrated with pressure, consequently, heat of reaction increases as it becomes more localized leading eventually to the noticed elevated temperature spot. Moreover, the peak temperature increases with pressure leading to the noticed higher temperature gradient. To further support this conclusion, the effect of pressure on the predicted axial profile of heat of reaction along the combustor centerline is shown in Figure . It can be noticed from the figure that with increasing the pressure, the heat of reaction becomes higher and more concentrated. Moreover, it is shifted toward the combustor inlet as a result of the decreased flow velocity. The plotted profiles are noticed to confirm the previous results.
Figure 10. Predicted contours of mean temperature for the adiabatic case at different pressures
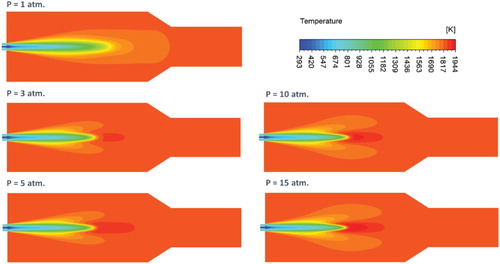
Figure 11. Predicted axial profiles of heat of reaction for the adiabatic case at different pressures.
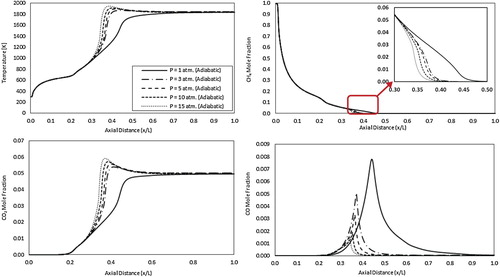
To further explain the previous results, Figure shows the predicted axial profiles of mean temperature, and CH4, CO2 and CO concentrations for the adiabatic case. Looking at the mean temperature axial profiles, temperature is noticed to first increase from ambient temperature (fuel inlet temperature) until it reaches 773 K (the air jet inlet temperature) at x/L = 0.2. In this region, fuel is preheated apparently due to the mixing with the high temperature air jet. After that, temperature is noticed to increase at a higher rate from x/L = 0.2 to 0.3 apparently due to the mixing with the hot recirculated exhaust gases. The following bifurcation in temperature increase rate noticed at x/L = 0.3 reveals the difference between the flameless combustion under atmospheric pressure and the conventional combustion under elevated pressures. Under atmospheric pressure, temperature continues to increase with nearly the same rate till x/L = 0.45 followed by a nearly uniform temperature profile till the combustor exit. However, under elevated pressures, temperature tends to increase at a higher rate with a peak noticed at x/L = 0.4. This can be attributed to the more concentrated reaction zone (Figure ) and more localization of heat of reaction (Figure ). Moreover, This temperature peak is noticed to move upstream with increasing the pressure due to decreased axial velocity. These results comply with predicted mean temperature contours shown in Figure . It should be noted that product gases temperature does not show a noticeable increase with pressure as seen in Figure . This means that the recirculated gases density will not change considerably due to temperature, which explains the slight decrease in recirculation ratio noted in Figure . The predicted CH4 mole fraction axial profiles reflects the previous results. A gradual decrease of CH4 mole fraction from 1 at x/L = 0 to 0.055 at x/L = 0.3 is noticed. Apparently, this decrease is the result of the fuel jet mixing with air and recirculated exhaust gases. After that, reaction starts at x/L = 0.3 and extends to x/L = 0.8. Within the reaction zone, CH4 mole fraction is decreased at different rates under different pressures. This can be attributed to the increased methane consumption rate resulted by the more concentrated reaction zone and elevated temperature. CO2 mole fraction axial profiles appear to follow the temperature profiles in the reaction zone (x/L = 0.3–0.8) as expected. Moreover, an increase in CO2 mole fraction is noticed from x/L = 0.2 to x/L = 0.3 apparently because of the mixing between air, fuel and the hot recirculated exhaust gases as previously mentioned. CO mole fraction axial profiles usually represents the location and size of the reaction zone. It can be noticed from these profiles that the reaction zone under atmospheric pressure is relatively wide compared with elevated pressure conditions. It extends from x/L = 0.3 to 0.9 with its peak at x/L = 0.45. Increasing the pressure results in a more concentrated CO profile, which demonstrates a more concentrated reaction zone. Moreover, it is noticed to shift the reaction zone in the upstream direction as noticed from the locations of the CO mole fraction peak. Finally, increasing the pressure results in reducing the CO emissions due to the increased residence time, the elevated temperature, and the encouragement of CO transformation to CH2O as per the reaction H2+CO(+M)<=>CH2O(+M) (Kazakov & Frenklach, Citation1994).
Figure 12. Predicted axial profiles of mean temperature, and CH4, CO2 and CO concentrations for the adiabatic case at different pressures.
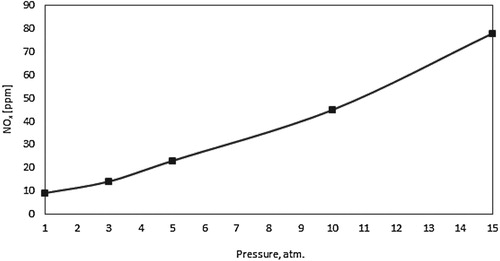
Finally, Figure shows the predicted NOx for the present combustor under adiabatic conditions and elevated pressures. Thermal, prompt and N2O intermediate NOx were evaluated. As noticed, NOx emissions increases with pressure, which can be attributed to the increase in both residence time and temperature. The majority of the predicted NOx are generated via the thermal route (nearly 90%) while the N2O intermediate and prompt NOx constitute less than 10%. Similar trends were noticed in the work of Khalil et al. (Khalil & Gupta, Citation2015).
Figure 13. Variation of the predicted NOx emissions with pressure at the adiabatic case.
3.3. Effect of pressure – the isothermal case
In the isothermal case, the combustor wall temperature is kept constant at 1173 K for all pressures investigated. To demonstrate the effect of pressure on flow turbulence and mixing under isothermal conditions, predicted contours of turbulent intensity at combustor symmetry plane are shown in Figure . As noticed in the adiabatic case, relatively high turbulence intensity which occupies most of the combustor volume is noticed under atmospheric pressure conditions. It reaches its peak at the shear layer between the inlet high velocity air jet and the surrounding medium. Similar to the adiabatic case, increasing the pressure appears to suppress this turbulence due to the decreased inlet velocity. Figure shows the variation of the recirculation ratio with pressure. Despite the considerable effect of pressure on turbulence intensity, increasing the pressure appears to have a slight effect on recirculation ratio. Increasing the pressure from 1 to 5 atm. results in a slight increase in recirculation ratio. However, further increase in pressure from 5 to 15 atm. shows no effect on recirculation ratio. As explained in the previous section, the recirculation ratio is affected by temperature rather than pressure. Consequently, this slight variation of recirculation ratio with pressure can be explained to follow the slight variation of the combustion temperature with pressure (as will be shown).
Figure 14. Predicted contours of turbulence intensity for the isothermal case at different pressures.
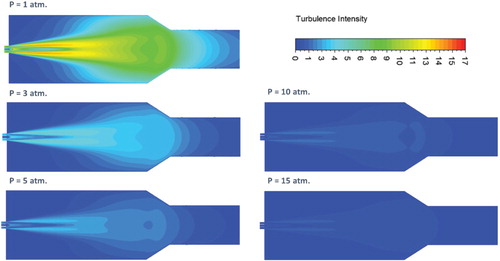
Figure 15. Variation of the computed recirculation ratio with pressure at the isothermal case.
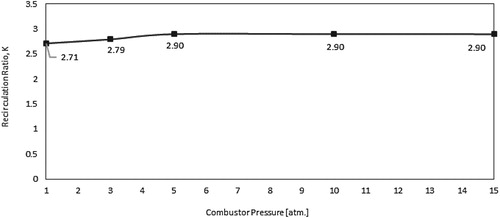
Figure shows the effect of pressure on the predicted contours of OH mole fraction at the combustor symmetry plane. Similar to the adiabatic case, a considerable decrease in OH intensity with increasing the pressure is noticed which can be attributed to the recombination of OH radicals to form O2H2 compounds (Kazakov & Frenklach, Citation1994). Moreover, the reaction zone size is noticed to decrease with increasing the pressure, which is expected due to the reduced laminar flame speed (as will be shown later) and flow velocity. However, in contrary to the adiabatic case, the reaction zone structure noticed at the atmospheric pressure appears to maintain its distributed shape under elevated pressure conditions. No high OH gradient is noticed with increasing pressure in the present case (Figure ) in contrary to the adiabatic case (Figure ). This difference in behavior can be explained as follows. In the adiabatic case, increasing the pressure results in a more concentrated reaction zone, which subsequently leads to an increase in heat of reaction and temperature. However, in the present isothermal case, heat transfer is believed to play a role in limiting the increase in heat of reaction and temperature resulting from increasing the pressure.
Figure 16. Predicted contours of OH mole fraction for the isothermal case at different pressures.
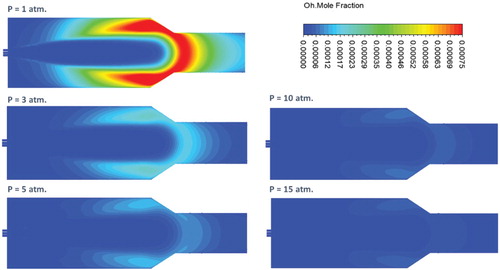
Figure shows the effect of pressure on the predicted contours of mean temperature at the combustor symmetry plane. A gradual increase of temperature is noticed along the combustor centerline and in the recirculation zone for all pressure conditions. No temperature peaks appear with increasing the pressure in contrary to the adiabatic case (see Figure ). Temperature gradient is noticed to be relatively low at atmospheric pressure but increases with increasing the pressure. This can be attributed to the increased tendency of the reaction zone to be concentrated with pressure as noticed in Figure . The low gradient temperature contours conforms well to the distributed reaction zone noticed in Figure for all pressure conditions. These results confirm the flameless mode of operation under elevated pressure conditions for the present case. As mentioned before, in the present isothermal case, heat transfer limits the increase in heat of reaction and temperature resulting from increasing the pressure. Consequently, the variation of combustion temperature with pressure is relatively small compared with the adiabatic case (Figure ), and the reaction remains distributed (Figure ) rather than concentrated (Figure ). To maintain the distributed combustion and low gradient temperature profile while increasing the pressure, heat transfer is noticed to increase. To further support these conclusions the effect of pressure on the predicted axial profile of heat of reaction along the combustor center line is shown in Figure . Compared with the adiabatic case (Figure ), heat of reaction is noticed to decrease considerably in the present isothermal case. This can be attributed to the effect of heat transfer either directly through drawing the excess heat of reaction or indirectly through maintaining distributed reaction zone. Looking at the trend of the heat of reaction with pressure, it is noticed to decrease with pressure from 1 atm. to 5 atm. This might be attributed to the considerable increase in radiative heat transfer across the walls. However, at pressures from 5 to 15 atm. an increase in the heat of reaction is noticed. The increase in heat of reaction due to the more concentrated reaction zone is higher than the heat loss due to radiation.
Figure 17. Predicted contours of mean temperature for the isothermal case at different pressures.
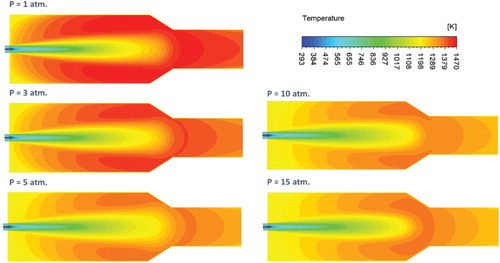
Figure 18. Predicted axial profiles of heat of reaction for the isothermal case at different pressures.
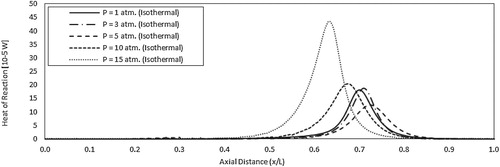
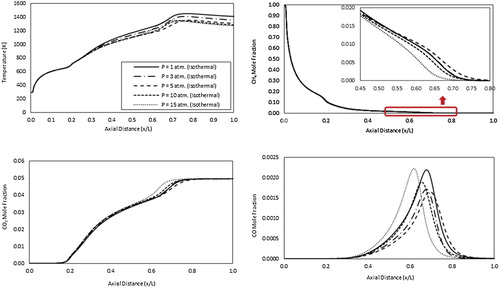
Figure shows the predicted axial profiles of mean temperature, and CH4, CO2 and CO concentrations for the isothermal case. Looking at the mean temperature axial profiles, temperature is noticed to first increase from ambient temperature (fuel inlet temperature) until it reaches 773 K (the air jet inlet temperature) at x/L = 0.2. In this region, fuel is preheated apparently due to the mixing with the high temperature air jet. After that, temperature is noticed to increase at a higher rate from x/L = 0.2–0.3 apparently due to the mixing with the hot recirculated exhaust gases. The following bifurcation in temperature increase rate noticed at x/L = 0.3 is believed to result from the different levels of heat transfer at various pressures. However, temperature maintains the same flameless profile under elevated pressures with no apparent temperature peaks noticed thanks to the included effect of heat transfer. These results comply with the predicted mean temperature contours shown in Figure and confirm the flameless combustion onset under high pressure conditions for the present case. Finally maximum temperature is noticed to decrease slightly with increasing the pressure from 1 to 5 atm. due to the dominant effect of increasing heat transfer. Further increase in pressure has no apparent effect on temperature, which may be attributed to the equal but opposite effects of pressure and heat transfer increase on temperature. This variation of temperature with pressure explains the previously noticed trend of recirculation ratio (Figure ). The predicted CH4 mole fraction axial profiles reflects the previous results. A gradual decrease of CH4 mole fraction from 1 at x/L = 0 to 0.055 at x/L = 0.3 is noticed. Apparently, this decrease is the result of the fuel jet mixing with air and recirculated exhaust gases. After that, reaction starts at x/L = 0.3 and extends to x/L = 0.8. Within the reaction zone, CH4 mole fraction is noticed to decrease at different rates, which may be attributed to an oscillating reaction zone location with pressure. As pressure increases from 1 to 5 atm. methane consumption rate is noticed to decrease due to a slight shift of the reaction zone location in the downstream direction. Further increase in pressure from 5 to 15 atm. results in a sharper methane consumption rate due to a slight shift of the reaction zone location in the opposite direction. CO2 mole fraction axial profiles also show this oscillating behavior in the reaction zone location with pressure in the same distance range (x/L = 0.3–0.8) as expected. The oscillating reaction zone location is apparent and further confirmed from the locations of the CO mole fraction peak. Finally, increasing the pressure from 1 to 5 atm. results in reducing the CO emissions due to the increased residence time, and the encouragement of CO transformation to CH2O as per the reaction H2+CO(+M)<=>CH2O(+M) (Kazakov & Frenklach, Citation1994). However, with further increase in the pressure from 5 to 15 atm. an unexpected increase of CO is noticed. This may be attributed to the increased cooling heat transfer.
Figure 19. Predicted axial profiles of mean temperature, and CH4, CO2 and CO concentrations for the isothermal case at different pressures.
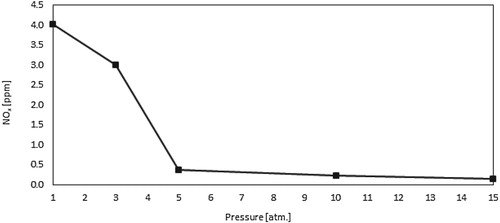
Finally, Figure shows the predicted NOx for the present combustor under isothermal conditions and elevated pressures. As noticed, NOx emissions decreases with pressure, which is opposite to the typical trend noticed in the adiabatic case (Figure ). This unusual trend can be attributed to the more dominant effect of the increased heat transfer and the subsequent decrease in temperature with increasing the pressure. The majority of the predicted NOx are generated via the thermal route (nearly 90%) while the N2O intermediate and prompt NOx constitute less than 10%. Single digit NOx is noticed in the isothermal case compared with the two digit NOx demonstrated in the adiabatic case, which is apparently contributed to the absence of temperature peaks in the former case.
Figure 20. Variation of the predicted NOx emissions with pressure at the isothermal case.
3.4. Identification of combustion regime
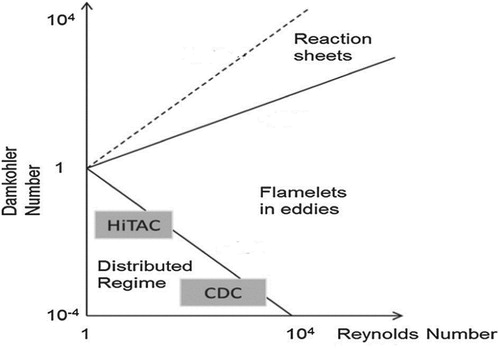
Figure shows Borghi diagram for different combustion regimes (Abdel-Gayed, Bradley, & Lung, Citation1989; Buckmaster, Citation1985). In this diagram, both Damköhler and turbulent Reynolds numbers characterize combustion regimes. The distributed reaction regime is characterized by low Damköhler number ( < 1), where the reaction rate is lower than the turbulent mixing rate, such that the combustion behavior is dictated by mixing rather than kinetics.
Figure 21. Combustion regimes with respect to and
(Abdel-Gayed et al., Citation1989).
Therefore, and to further explain and confirm the previous results regarding the role of heat transfer in sustaining flameless combustion under elevated pressure conditions, both Damköhler and turbulent Reynolds numbers are calculated for all reacting cases investigated under adiabatic and isothermal conditions. These cases are then pinpointed on Borghi diagram to identify their corresponding combustion regime.
Damköhler number is a ratio between the chemical reaction rate and the mixing rate:
(11)
(11) Both of these rates can be given by Khalil and Gupta (Citation2017):
(12)
(12)
(13)
(13) Where
is the laminar flame speed,
is the laminar flame thickness,
is the eddy dissipation rate, and
is the turbulent kinetic energy.
The laminar flame speed is estimated using the empirical correlation first developed by Metghalchi and Keck (Citation1980), and further tuned by Stone, Clarke, and Beckwith (Citation1998):
(14)
(14) Here,
is the fuel/air equivalence ratio,
is the diluent level,
,
,
are coefficients associated with the diluent level,
,
,
,
,
are empirical coefficients associated with equivalence ratio,
,
,
is the stoichiometric temperature exponent,
is the stoichiometric pressure exponent, and
and
show the equivalence ratio dependency.
and
are the dimensionless temperature and pressure and are given by:
(15)
(15)
(16)
(16) where
and
are the unburnt temperature and pressure respectively,
is the reference temperature (298 K), and
is the reference pressure (1 atm.).
The values for the above mentioned coefficients are obtained from (Stone et al., Citation1998) and are summarized in the table below: Table .
Table 4. Parameters for the laminar flame speed correlation of Methane/Air/Diluent mixtures.
The laminar flame thickness can be estimated from the following equation (Khalil & Gupta, Citation2017):
(17)
(17) In this equation,
is the thermal conductivity,
is the unburnt gases density,
is the specific heat capacity, and
is the laminar flame speed.
Following the previous procedure, the reaction and turbulence parameters are estimated for both adiabatic and isothermal cases as follows:
3.4.1. For the adiabatic case
Table shows the calculated parameters necessary to identify the combustion regime for the adiabatic case. It can be noted that, in the adiabatic case, the unburnt gas temperature increases with increasing the pressure due to mixing with hot product gases. The latter is of increased temperature following the increase in combustion temperature with pressure resulted by the more concentrated reaction zone and high heat of reaction as noticed in Figures and respectively. The diluent percentage in the unburnt gases is noticed to decrease with increasing pressure. This complies with the noticed decrease in recirculation ratio (Figure ), following the increase in product gases temperature and decreased density as explained before. Although increasing unburnt gases temperature and decreasing diluent level should lead to an increase in the laminar flame speed, the latter is noticed to decrease significantly with increasing pressure. This demonstrates the dominant effect of pressure on laminar flame speed, which outweighs the effects of both unburnt gases temperature and diluent level. Consequently, chemical reaction rate is noticed to decrease significantly with pressure. From another side, increasing the pressure is found to reduce the turbulent kinetic energy significantly which complies with the previous results noted in Figure . Consequently, mixing rate is substantially decreased with increasing pressure leading to a final increase in Damköhler number and a decrease in turbulent Reynolds number.
Table 5. Calculated parameters for the combustion regime identification of the adiabatic case.
3.4.2. For the isothermal case
Table shows the calculated parameters necessary to identify the combustion regime for the isothermal case. In the isothermal case, the unburnt gas temperature is noticed to decrease with increasing the pressure from 1 to 5 atm. before it becomes nearly constant for pressures above 5 atm. As mentioned before, the unburnt gases temperature is controlled through the product gases temperature which in turn controlled by the combustion temperature. Consequently, this behavior complies with the previously noticed decrease in combustion temperature with increasing pressure from 1 to 5 atm. and the nearly constant temperature for pressures above this value, see Figure . As previously explained in Section 3.3, maximum temperature is noticed to decrease slightly with increasing the pressure from 1 to 5 atm. due to the dominant effect of increasing heat transfer. Further increase in pressure has no apparent effect on temperature, which may be attributed to the equal but opposite effects of pressure and heat transfer increase on temperature. This variation of temperature with pressure explains the noticed trend of diluent level with pressure, which also complies, with the previously noticed trend of recirculation ratio, see Figure . Similar to the adiabatic case, the laminar flame speed is noticed to decrease significantly with increasing pressure. Consequently, chemical reaction rate is noticed to decrease significantly with pressure. From another side, increasing the pressure is found to reduce the turbulent kinetic energy significantly which complies with the previous results noted in Figure . Consequently, mixing rate is substantially decreased with increasing pressure leading to a final increase in Damköhler number and a decrease in turbulent Reynolds number. However, it should be noted that both the laminar flame speed and reaction rate for the isothermal case are considerably lower than their counterparts in the adiabatic case for all pressures investigated. This can be attributed to the considerably lower unburnt gases temperature in the former case than in the latter case due to the heat transfer effect. Consequently, Damköhler number for the isothermal case is considerably lower than the adiabatic case for all pressures investigated which favors distributed reaction.
Table 6. Calculated parameters for the combustion regime identification of the isothermal case.
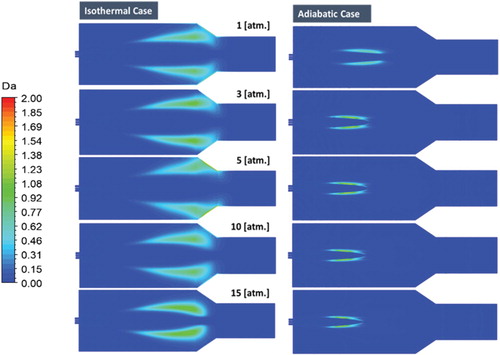
Figure shows a comparison between the predicted contours of Damköhler number under adiabatic and isothermal conditions. It can be noted from the figure that the reaction zone (identified by regions where Da > 0) is far more distributed under isothermal wall conditions compared with the adiabatic wall conditions for all pressure studied. It is also apparent that, in the isothermal case, within the area of reaction, Damköhler number is lower than one for all pressures investigated which reflects the sustained flameless mode of combustion. In the adiabatic case, Damköhler number is relatively higher and reaches twice its value in the isothermal case. This complies with the transition to the conventional concentrated mode of combustion in the adiabatic case with elevated pressures.
Figure 22. Predicted contours of Damköhler number for both the isothermal and the adiabatic cases at different pressures.
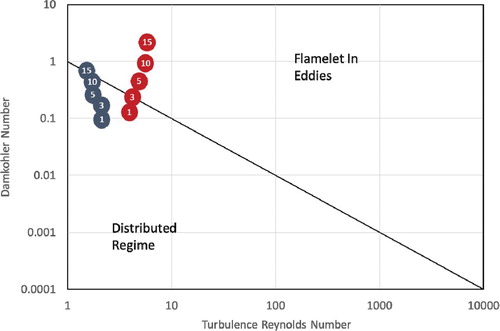
Finally, Figure shows the locations of the above-investigated cases on Borghi diagram. Circles in blue color represent the isothermal cases while circles in red color represent the adiabatic cases. Pressure for each case is shown inside the circle. It can be noted from the figure that, of all adiabatic cases, only the one under atmospheric pressure is located in the distributed regime. The adiabatic case with pressure of 3 atm. represents a transition state. Further increase in pressure above 3 atm. leads to combustion transition from the distributed regime to the flamelet in eddies regime. From another side, all isothermal cases (cases with heat transfer incorporated) are located in the distributed combustion regime. This complies with the previously demonstrated contours of temperature, and OH and CO mole fractions in sections 3.2, and 3.3.
Figure 23. Combustion regimes of both adiabatic (red color) and isothermal (blue color) cases.
Finally, it is noteworthy to mention that enlarging heat transfer on the combustor walls might decrease the enthalpy of the combustor hot products as expected. This might have a negative effect on gas turbine thermal efficiency. However, this effect can be considered similar to the effect of the dilution air in conventional combustors, which is added to the hot products so that the exit temperature becomes appropriate for turbine blades material. In addition, this heat is not necessarily being lost. The combustion air can pass over the combustor walls for cooling them while it is being preheated at the same time. Using the heat transfer across the combustor walls to preheat combustion air might increase the gas turbine thermal efficiency.
4. Conclusion
Combined effects of pressure and increasing heat transfer on flameless combustion mode were investigated in a 10 kW flameless combustor with coaxial methane and air jets arrangement. Operating pressures covered in the current study are in the range from 1 to 15 atm. Heat transfer across the combustor wall is increased through keeping the combustor wall temperature at a value (1173 K) that is well below the combustor operating temperature. Two-dimensional axisymmetric computations were performed under reacting conditions using ANSYS Fluent 17. DRM22 mechanism is tuned for improved CO predictions. The effect of pressure on mixing and recirculation ratio, reaction zone location and spread, global flame characteristics, and emissions was investigated. Results were reported for both adiabatic and isothermal combustor wall conditions. Following conclusions are made:
Under adiabatic combustor wall conditions, increasing the pressure results in a more concentrated reaction zone, and a subsequent increase in the heat of reaction. A transition from flameless to conventional combustion modes eventually occurs at 3 atm. The calculated Damköhler number is noticed to increase from 0.2 to 1.9, while the turbulence Reynolds number decreases from 5.48 to 5.37. As peak temperature increases from 1840 to 1940 K, NOx emissions increases subsequently from 10 to 78 ppm. The majority of the predicted NOx are generated via the thermal route (nearly 90%).
Under isothermal combustor wall conditions, increased heat transfer is noticed to limit the increase in heat of reaction and temperature with pressure. Peak temperature remains in the range (1350–1400 K) for all pressures investigated. The calculated Damköhler number is noticed to increase from 0.12 to 0.85, which is nearly half the values encountered under adiabatic conditions. Moreover, turbulence Reynolds number decreases from 2.09 to 1.84. These results demonstrate a distributed reaction under all pressures investigated. Finally, predicted NOx emissions are found below 5 ppm for all conditions.
Enlarging heat transfer on the combustor walls might decrease the enthalpy of the combustor hot products as expected. This might have a negative effect on gas turbine thermal efficiency. However, this effect can be considered similar to the effect of the dilution air in conventional combustors, which is added to the hot products so that the exit temperature becomes appropriate for turbine blades material. In addition, this heat is not necessarily being lost. The combustion air can pass over the combustor walls for cooling them while it is being preheated at the same time. Using the heat transfer across the combustor walls to preheat combustion air might increase the gas turbine thermal efficiency.
Finally, the numerical predictions were generally in fairly good agreement with the experimental measurements despite some discrepancies between the CO predictions and the experiments. These discrepancies in CO predictions are still noted despite the previous tuning of the reduced chemical reaction mechanism. The main reason for this might be the limited ability of the current chemical reaction mechanism to predict all CO consumption and production routes in flameless combustion. The DRM22 reduced mechanism is derived from the GRI-MECH 1.2 which was primarily developed for conventional combustion. Thus, future work will focus on the development of new mechanisms for this purpose.
Disclosure statement
No potential conflict of interest was reported by the authors.
References
- Abdel-Gayed, R. G., Bradley, D., & Lung, F. K. K. (1989). Combustion regimes and the straining of turbulent premixed flames. Combustion and Flame, 76(2), 213–218. doi: 10.1016/0010-2180(89)90068-0
- Akbarian, E., Najafi, B., Jafari, M., Faizollahzadeh Ardabili, S., Shamshirband, S., & Chau, K.-W. (2018). Experimental and computational fluid dynamics-based numerical simulation of using natural gas in a dual-fueled diesel engine. Engineering Applications of Computational Fluid Mechanics, 12(1), 517–534. doi: 10.1080/19942060.2018.1472670
- Buckmaster, J. D. (1985). The mathematics of combustion (Vol. 97). Philadelphia, PA: Society for industrial and applied mathematics.
- Cavaliere, A., & de Joannon, M. (2004). Mild combustion. Progress in Energy and Combustion Science, 30(4), 329–366. doi: 10.1016/j.pecs.2004.02.003
- Cohé, C., Halter, F., Chauveau, C., Gökalp, I., & Gülder, ÖL. (2007). Fractal characterisation of high-pressure and hydrogen-enriched CH4–air turbulent premixed flames. Proceedings of the Combustion Institute, 31(1), 1345–1352. doi: 10.1016/j.proci.2006.07.181
- De Joannon, M., Saponaro, A., & Cavaliere, A. (2000). Zero-dimensional analysis of diluted oxidation of methane in rich conditions. Proceedings of the Combustion Institute, 28(2), 1639–1646. doi: 10.1016/S0082-0784(00)80562-7
- Duwig, C., Stankovic, D., Fuchs, L., Li, G., & Gutmark, E. (2007). Experimental and numerical study of flameless combustion in a model gas turbine combustor. Combustion Science and Technology, 180(2), 279–295. doi: 10.1080/00102200701739164
- Faizollahzadeh Ardabili, S., Najafi, B., Shamshirband, S., Minaei Bidgoli, B., Deo, R. C., & Chau, K.-W. (2018). Computational intelligence approach for modeling hydrogen production: A review. Engineering Applications of Computational Fluid Mechanics, 12(1), 438–458. doi: 10.1080/19942060.2018.1452296
- Flamme, M. (2004). New combustion systems for gas turbines (NGT). Applied Thermal Engineering, 24(11), 1551–1559. doi: 10.1016/j.applthermaleng.2003.10.024
- Flamme, M. (2005). New combustion systems for gas turbines.
- Fluent, A. (2016). 17.0 theory Guide. Ansys Inc, 5.
- Ghalandari, M., Mirzadeh Koohshahi, E., Mohamadian, F., Shamshirband, S., & Chau, K. W. (2019). Numerical simulation of nanofluid flow inside a root canal. Engineering Applications of Computational Fluid Mechanics, 13(1), 254–264. doi: 10.1080/19942060.2019.1578696
- Goswami, M., Derks, S. C. R., Coumans, K., Slikker, W. J., de Andrade Oliveira, M. H., Bastiaans, R. J. M., … Konnov, A. A. (2013). The effect of elevated pressures on the laminar burning velocity of methane+air mixtures. Combustion and Flame, 160(9), 1627–1635. doi: 10.1016/j.combustflame.2013.03.032
- Griebel, P., Siewert, P., & Jansohn, P. (2007). Flame characteristics of turbulent lean premixed methane/air flames at high pressure: Turbulent flame speed and flame brush thickness. Proceedings of the Combustion Institute, 31(2), 3083–3090. doi: 10.1016/j.proci.2006.07.042
- Han, D., & Mungal, M. (2001). Direct measurement of entrainment in reacting/nonreacting turbulent jets. Combustion and Flame, 124(3), 370–386. doi: 10.1016/S0010-2180(00)00211-X
- Hosseini, S. E., & Abdul Wahid, M. (2015). Effects of burner configuration on the characteristics of biogas flameless combustion. Combustion Science and Technology, 187(8), 1240–1262. doi: 10.1080/00102202.2015.1031224
- Hosseini, S. E., Bagheri, G., & Wahid, M. A. (2014). Numerical investigation of biogas flameless combustion. Energy Conversion and Management, 81, 41–50. doi: 10.1016/j.enconman.2014.02.006
- Kazakov, A., & Frenklach, M. (1994). http://www.me.berkeley.edu/drm/. Retrieved from http://www.me.berkeley.edu/drm/
- Khalil, H. M., Eldrainy, Y. A., Saqr, K. M., & Abdelghaffar, W. A. (2018). Evaluation criteria for a flameless combustor based on recirculation and mixing – A CFD approach. Acta Astronautica, doi: 10.1016/j.actaastro.2018.07.054
- Khalil, A. E., & Gupta, A. K. (2015). Impact of pressure on high intensity colorless distributed combustion. Fuel, 143, 334–342. doi: 10.1016/j.fuel.2014.11.061
- Khalil, A. E. E., & Gupta, A. K. (2017). Towards colorless distributed combustion regime. Fuel, 195, 113–122. doi: 10.1016/j.fuel.2016.12.093
- Khalil, H., Saqr, K., Eldrainy, Y., & Abdelghaffar, W. (2018). Aerodynamics of a trapped vortex combustor: A comparative assessment of RANS based CFD models. Journal of Advanced Research in Fluid Mechanics and Thermal Sciences, 43(1), 1–19.
- Khidr, K. I., Eldrainy, Y. A., & El-Kassaby, M. M. (2017). Towards lower gas turbine emissions: Flameless distributed combustion. Renewable and Sustainable Energy Reviews, 67, 1237–1266. doi: 10.1016/j.rser.2016.09.032
- Kruse, S., Kerschgens, B., Berger, L., Varea, E., & Pitsch, H. (2015). Experimental and numerical study of MILD combustion for gas turbine applications. Applied Energy, 148, 456–465. doi: 10.1016/j.apenergy.2015.03.054
- Lammel, O., Schütz, H., Schmitz, G., Lückerath, R., Stöhr, M., Noll, B., … Krebs, W. (2010). FLOX® combustion at high power density and high flame temperatures. Journal of Engineering for Gas Turbines and Power, 132(12), 121503. doi: 10.1115/1.4001825
- Liu, Y., Cheng, J., Zou, C., Cai, L., He, Y., & Zheng, C. (2017). Experimental and numerical study on the CO formation mechanism in methane MILD combustion without preheated air. Fuel, 192, 140–148. doi: 10.1016/j.fuel.2016.12.010
- Locci, C. (2015). Large Eddy Simulations modelling of flameless combustion. Senftenberg: BTU Cottbus-Senftenberg.
- Lückerath, R., Meier, W., & Aigner, M. (2008). FLOX® combustion at high pressure with different fuel compositions. Journal of Engineering for Gas Turbines and Power, 130(1), 011505. doi: 10.1115/1.2749280
- Magnussen, B. F. (1989). Modeling of NOx and soot formation by the eddy dissipation concept. Trondheim, Norway: Int. Flame Research Foundation.
- Metghalchi, M., & Keck, J. C. (1980). Laminar burning velocity of propane-air mixtures at high temperature and pressure. Combustion and Flame, 38, 143–154. doi: 10.1016/0010-2180(80)90046-2
- Mou, B., He, B.-J., Zhao, D.-X., & Chau, K.-W. (2017). Numerical simulation of the effects of building dimensional variation on wind pressure distribution. Engineering Applications of Computational Fluid Mechanics, 11(1), 293–309. doi: 10.1080/19942060.2017.1281845
- Nemitallah, M. A., Rashwan, S. S., Mansir, I. B., Abdelhafez, A. A., & Habib, M. A. (2018). Review of novel combustion techniques for clean power production in gas turbines. Energy & Fuels, 32(2), 979–1004. doi: 10.1021/acs.energyfuels.7b03607
- Perpignan, A. A. V., Talboom, M. G., Levy, Y., & Rao, A. G. (2018). Emission modeling of an interturbine burner based on flameless combustion. Energy & Fuels, 32(1), 822–838. doi: 10.1021/acs.energyfuels.7b02473
- Pope, S. B. (1997). Computationally efficient implementation of combustion chemistry using in situ adaptive tabulation. Combustion Theory and Modelling, 1(1), 41–63. doi: 10.1080/713665229
- Raithby, G. D., & Chui, E. H. (1990). A finite-volume method for predicting a radiant heat transfer in enclosures with participating media. Journal of Heat Transfer, 112(2), 415–423. doi: 10.1115/1.2910394
- Ramezanizadeh, M., Alhuyi Nazari, M., Ahmadi, M. H., & Chau, K.-W. (2019). Experimental and numerical analysis of a nanofluidic thermosyphon heat exchanger. Engineering Applications of Computational Fluid Mechanics, 13(1), 40–47. doi: 10.1080/19942060.2018.1518272
- Rebola, A., Coelho, P. J., & Costa, M. (2013). Assessment of the performance of several turbulence and combustion models in the numerical simulation of a flameless combustor. Combustion Science and Technology, 185(4), 600–626. doi: 10.1080/00102202.2012.739222
- Rebola, A., Costa, M., & Coelho, P. J. (2013). Experimental evaluation of the performance of a flameless combustor. Applied Thermal Engineering, 50, 805–815. doi: 10.1016/j.applthermaleng.2012.07.027
- Shareh, F. B., Silcox, G., & Eddings, E. G. (2018). Calculated impacts of diluents on flame temperature, ignition delay, and flame speed of methane–oxygen mixtures at high pressure and low to moderate temperatures. Energy & Fuels, 32(3), 3891–3899. doi: 10.1021/acs.energyfuels.7b02647
- Shih, T.-H., Liou, W. W., Shabbir, A., Yang, Z., & Zhu, J. (1995). A new k-ε eddy viscosity model for high reynolds number turbulent flows. Computers & Fluids, 24(3), 227–238. doi: 10.1016/0045-7930(94)00032-T
- Stone, R., Clarke, A., & Beckwith, P. (1998). Correlations for the laminar-burning velocity of methane/diluent/air mixtures obtained in free-fall experiments. Combustion and Flame, 114(3), 546–555. doi: 10.1016/S0010-2180(97)00329-5
- Tsuji, H., Gupta, A. K., Hasegawa, T., Katsuki, M., Kishimoto, K., & Morita, M. (2002). High temperature air combustion: From energy conservation to pollution reduction. New York: CRC Press.
- Tu, Y., Yang, W., & Liu, H. (2017). A refined global reaction mechanism for gently preheated MILD combustion of methane. Energy & Fuels, 31(9), 10144–10157. doi: 10.1021/acs.energyfuels.7b01666
- Wünning, J., & Wünning, J. (1997). Flameless oxidation to reduce thermal NO-formation. Progress in Energy and Combustion Science, 23(1), 81–94. doi: 10.1016/S0360-1285(97)00006-3
- Zahedi, P., & Yousefi, K. (2014). Effects of pressure and carbon dioxide, hydrogen and nitrogen concentration on laminar burning velocities and NO formation of methane-air mixtures. Journal of Mechanical Science and Technology, 28(1), 377–386. doi: 10.1007/s12206-013-0970-5
- Zhang, J., Mi, J., Li, P., Wang, F., & Dally, B. B. (2015). Moderate or intense low-oxygen dilution combustion of methane diluted by CO2 and N2. Energy & Fuels, 29(7), 4576–4585. doi: 10.1021/acs.energyfuels.5b00511
- Zornek, T., Monz, T., & Aigner, M. (2015). Performance analysis of the micro gas turbine turbec T100 with a new FLOX-combustion system for low calorific fuels. Applied Energy, 159, 276–284. doi: 10.1016/j.apenergy.2015.08.075